5037
T2 texture features can detect differences between the discs of patient with and without low back pain1Radiology, University of Calgary, Calgary, AB, Canada, 2Experimental Imaging Centre, University of Calgary, Calgary, AB, Canada, 3McCaig Institute for Bone and Joint Health, University of Calgary, Calgary, AB, Canada, 4Physical Therapy, University of Alberta, Edmonton, AB, Canada
Synopsis
Conventional MRI is often clinically inconclusive in diagnosing the pathology of back pain, as both symptomatic and asymptomatic individuals demonstrate the same abnormal features. We hypothesized that texture driven features could be deployed to identify the underlying pathology of low back pain. Fourteen patients with chronic back pain were matched (age, weight, and gender) with 14 healthy volunteers. A grey-level co-occurrence matrix with one- to four-pixel offset and four directions was constructed to extract texture features. The texture analysis results indicated the discs of the healthy subjects were more uniform (lower contrast) than those of the participants with back pain.
Introduction
Imaging modalities are used extensively for diagnosing the underlying pathology of low back pain (LBP). Conventional MRI is sensitive for depicting structural abnormalities of the discs including changes in water content, collagen loss and atrophy. However, findings are often clinically inconclusive as both symptomatic and asymptomatic individuals often demonstrate the same degenerative features.1 Quantitative measures are needed because qualitative observation is unreliable. Texture analysis computes mathematical patterns of the signal intensity variations (texture features) within a region of interest (ROI). Texture features may be useful for quantifying degeneration and may help improve imaging specificity of LBP. The aim was to determine which texture features extracted from T2 maps present sensitivity and specificity to identify the lumbar discs of participants with LBP.Method
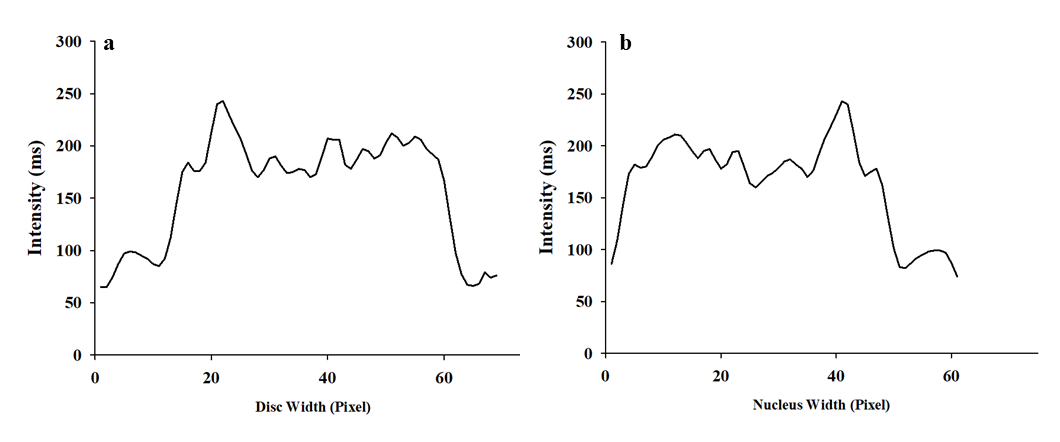
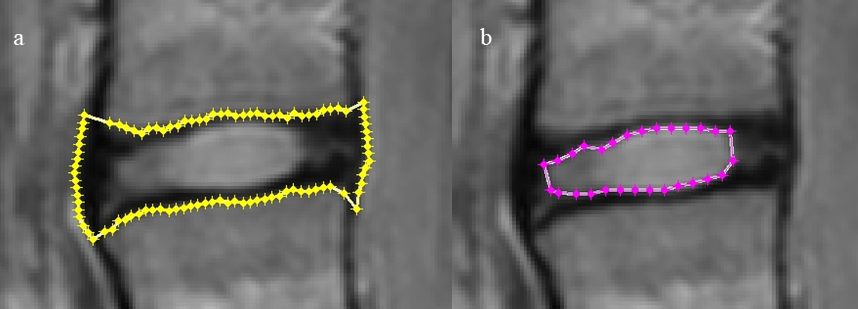
Fourteen consecutive volunteers with chronic LBP were matched for age, weight and gender with 14 healthy volunteers. Mid-sagittal T2 multi-echo images were acquired using a 3T whole-body Philips Intera MRI. Acquisition parameters were: TR/TE: 2500/(16.9, 44, 71, 98 and 125)ms, 2 averages, ETL: 20, FOV: 500×500 mm, matrix: 500×500, and slice thickness: 5 mm. Processing was done using Matlab® algorithms developed in house. Segmentation was done based on texture features (Fig. 1) for lumbar disc and the nucleus using the 3rd echo image (Fig. 2). T2-maps were constructed using the Nelder-Mead Simplex method.
A grey-level co-occurrence matrix with one to four pixels offset and four directions (0°, 45°, 90° and 135°) was constructed to extract second order texture features: contrast (∑(i,j)( |i-j|2p(i,j)), correlation (∑(i,j)((i-μi)(j-μj)p(i,j))/(σiσj)), energy (∑(i,j)p(i,j)2), and homogeneity (∑(i,j)(p(i,j)2)/(1+|i-j|)). Where p is the pixel-of-interest, μi and μj are the means and σi and σj are the standard deviations of the row (i) and column (j). Mean, coefficient of variation and signal intensity range were also extracted for each ROI. A repeated measure ANCOVA with group as a between subjects factor and level as a within subject factor using Sidak for post hoc comparisons was employed to compare different measures between groups. Age and area of the second lumbar vertebra (to adjust for size differences among participants) were included as covariates. The effect size (ES) of differences between groups was estimated using Cohen’s d.
Results
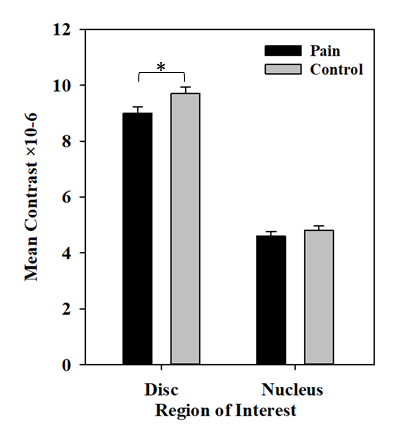
A significant difference was observed in whole disc contrast when one offset (a reference pixel and its immediate neighbour) was used (ES: 0.39; P-value=0.04). The discs of the healthy subjects were more uniform than the participants with pain at all levels (Fig. 3). No statistical difference was observed for the energy, correlation and homogeneity for both disc and nucleus between the two groups. The mean T2 of the pain group for both the disc and nucleus was lower than the controls, but the differences did not reach significance (ES:0.18). Although the coefficient of variation and the range of the T2 values were higher in the pain group for disc and lower for the nucleus than the in the controls, no statistically significant difference was observed between groups.
Discussion
The disc contrast information provided a better ability to detect differences between participants with and without pain than traditional disc signal measurements (mean, coefficient of variation and signal intensity range).2,3 This indicates that discs, consistent with presenting more degeneration, are more anisotropic in the people with LBP, which may affect the hydrostatic pressure of the disc and cause uneven load distribution on the pain-sensitive endplates or annulus fibers. Other texture parameters did not find any other significant differences with traditional disc signal measurements. The contrast measures the local variations in the grey-level co-occurrence matrix.
A limitation of the present study is that participants were scanned in a supine relaxed position despite loading being known to affects the morphology of the lumbar spine.4 As patient’s pain and discomfort are triggered when the spine is loaded, examining the response of texture features in response to loading during imaging may yield even more promising results. Future studies are needed to confirm what pathoanatomical changes are causing the contrast difference we observed between groups.
CONCLUSION
The present study identifies a novel biomarker for detecting differences between those with and without LBP. Of the seven candidate biomarkers considered in the present study, contrast was the most sensitive biomarkers for pain. This shows that texture, which is non-model dependent, may provide a sensitive marker of cartilage degeneration and a link between structure and pain.Acknowledgements
The development of the texture analysis program and data
analysis was funded by the Calgary Health
Trust. Data collection was conducted using grants from the Canadian Physiotherapy
Association and the Department of Physical Therapy at the University of Alberta.
References
1. Tan Y, Aghdasi BG, Montgomery SR, Inoue H, Lu C, Wang JC. Kinetic magnetic resonance imaging analysis of lumbar segmental mobility in patients without significant spondylosis. Eur Spine J. 2012;21(12):2673-2679.
2. Brinjikji W, Luetmer PH, Comstock B, et al. Systematic literature review of imaging features of spinal degeneration in asymptomatic populations. AJNR Am J Neuroradiol. 2015;36(4):811-816.
3. Steffens D, Hancock MJ, Maher CG, Williams C, Jensen TS, Latimer J. Does magnetic resonance imaging predict future low back pain? A systematic review. Eur J Pain. 2014;18(6):755-765.
4. Chung SS, Lee CS, Kim SH, Chung MW, Ahn JM. Effect of low back posture on the morphology of the spinal canal. Skeletal Radiol. 2000;29(4):217-223.
Figures