5035
Measurement of Acute Changes in Articular Cartilage T2 Relaxation Times Immediately After Exercise1Radiology, Stanford University, Stanford, CA, United States, 2Nuclear Medicine, Copenhagen University Hospital, Copenhagen, Denmark
Synopsis
Increased joint loading is a known risk factor for progression of osteoarthritis (OA) of the knee. However, the acute effects of exercise and joint loading are still poorly understood. Quantitative MRI measures, such as T2 relaxation times, provide an opportunity to objectively study how exercise affects cartilage matrix organization and hydration. In this work, we evaluate the feasibility of measuring acute changes in T2 relaxation times immediately after exercise, in both knees simultaneously.
INTRODUCTION
Osteoarthritis (OA) is a widely pervasive chronic degenerative disease of the joint that has a large physical and financial impact on society, yet remains poorly understood1. While increased loading is a risk factor for progression of OA of the knee joint, the short-term effects of exercise are still poorly understood2. MRI provides a non-invasive way to acquire high-resolution images of the joint. Further, quantitative measures, such as T2 relaxation times, can provide objective information regarding changes in cartilage matrix organization and hydration3. However, studies looking at the effects of exercise on cartilage T2 relaxation times are often limited by low resolution or SNR as well as analysis of a single knee or a long duration between the exercise protocol and image acquisition2,4. The goal of this study was to evaluate the feasibility of measuring acute changes in T2 relaxation times immediately after exercise, in both knees simultaneously.METHODS
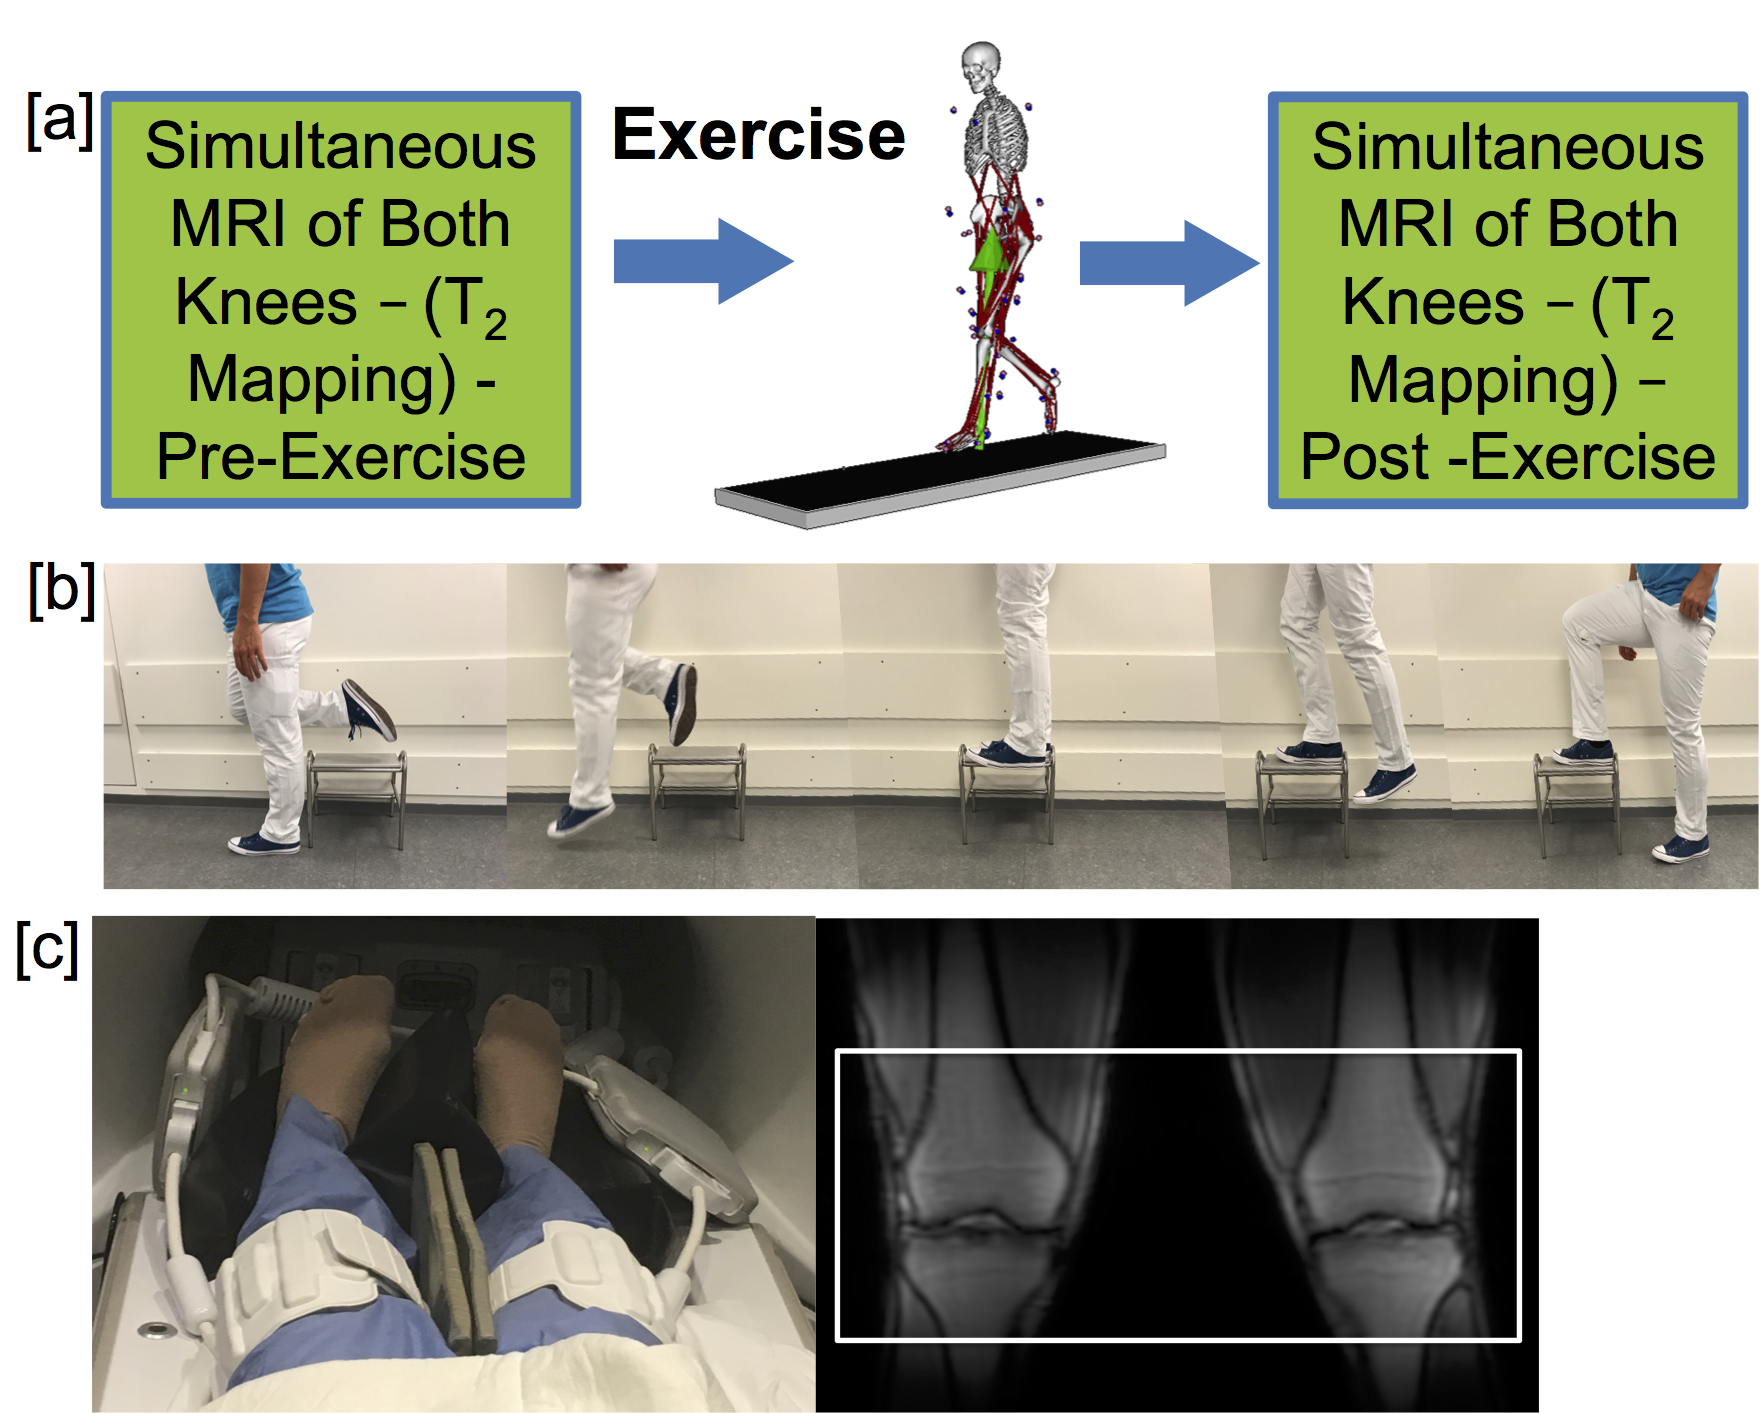
11 healthy volunteers were recruited and imaged on a 3.0T scanner (GE Healthcare) with university IRB approval. Simultaneous bilateral knee imaging was performed before and within 10 minutes after exercise with two 16-channel flexible phased-array extremity coils (NeoCoil, Pewaukee,WI)5 on both knees (Figure 1). The exercise protocol had subjects use their right leg to step up onto a 25 cm high stool and then hop down, landing on a straight left leg, 100 times immediately prior to imaging (Figure 1b). Images were acquired with a bilateral quantitative double-echo steady-state (qDESS) sequence (TR/TE1/TE2: 24.6/5.8/43.4 ms, FOV: 16.0 cm, matrix size: 320 x 320, slice thickness: 1.5 mm, number of slices: 220). T2 relaxation time mapping was performed by fitting the two qDESS images to previously described signal models6. Cartilage in the knee was divided into eight compartments for segmentation (patellar, trochlear, lateral/medial central femoral, lateral/medial posterior femoral, and lateral/medial tibial cartilage). The mean T2 relaxation time from each compartment was calculated before and after exercise. Differences in cartilage T2 relaxation time before and after exercise were compared across knees as well as against a null hypothesis of no change using a Wilcoxon-rank-sum test.RESULTS
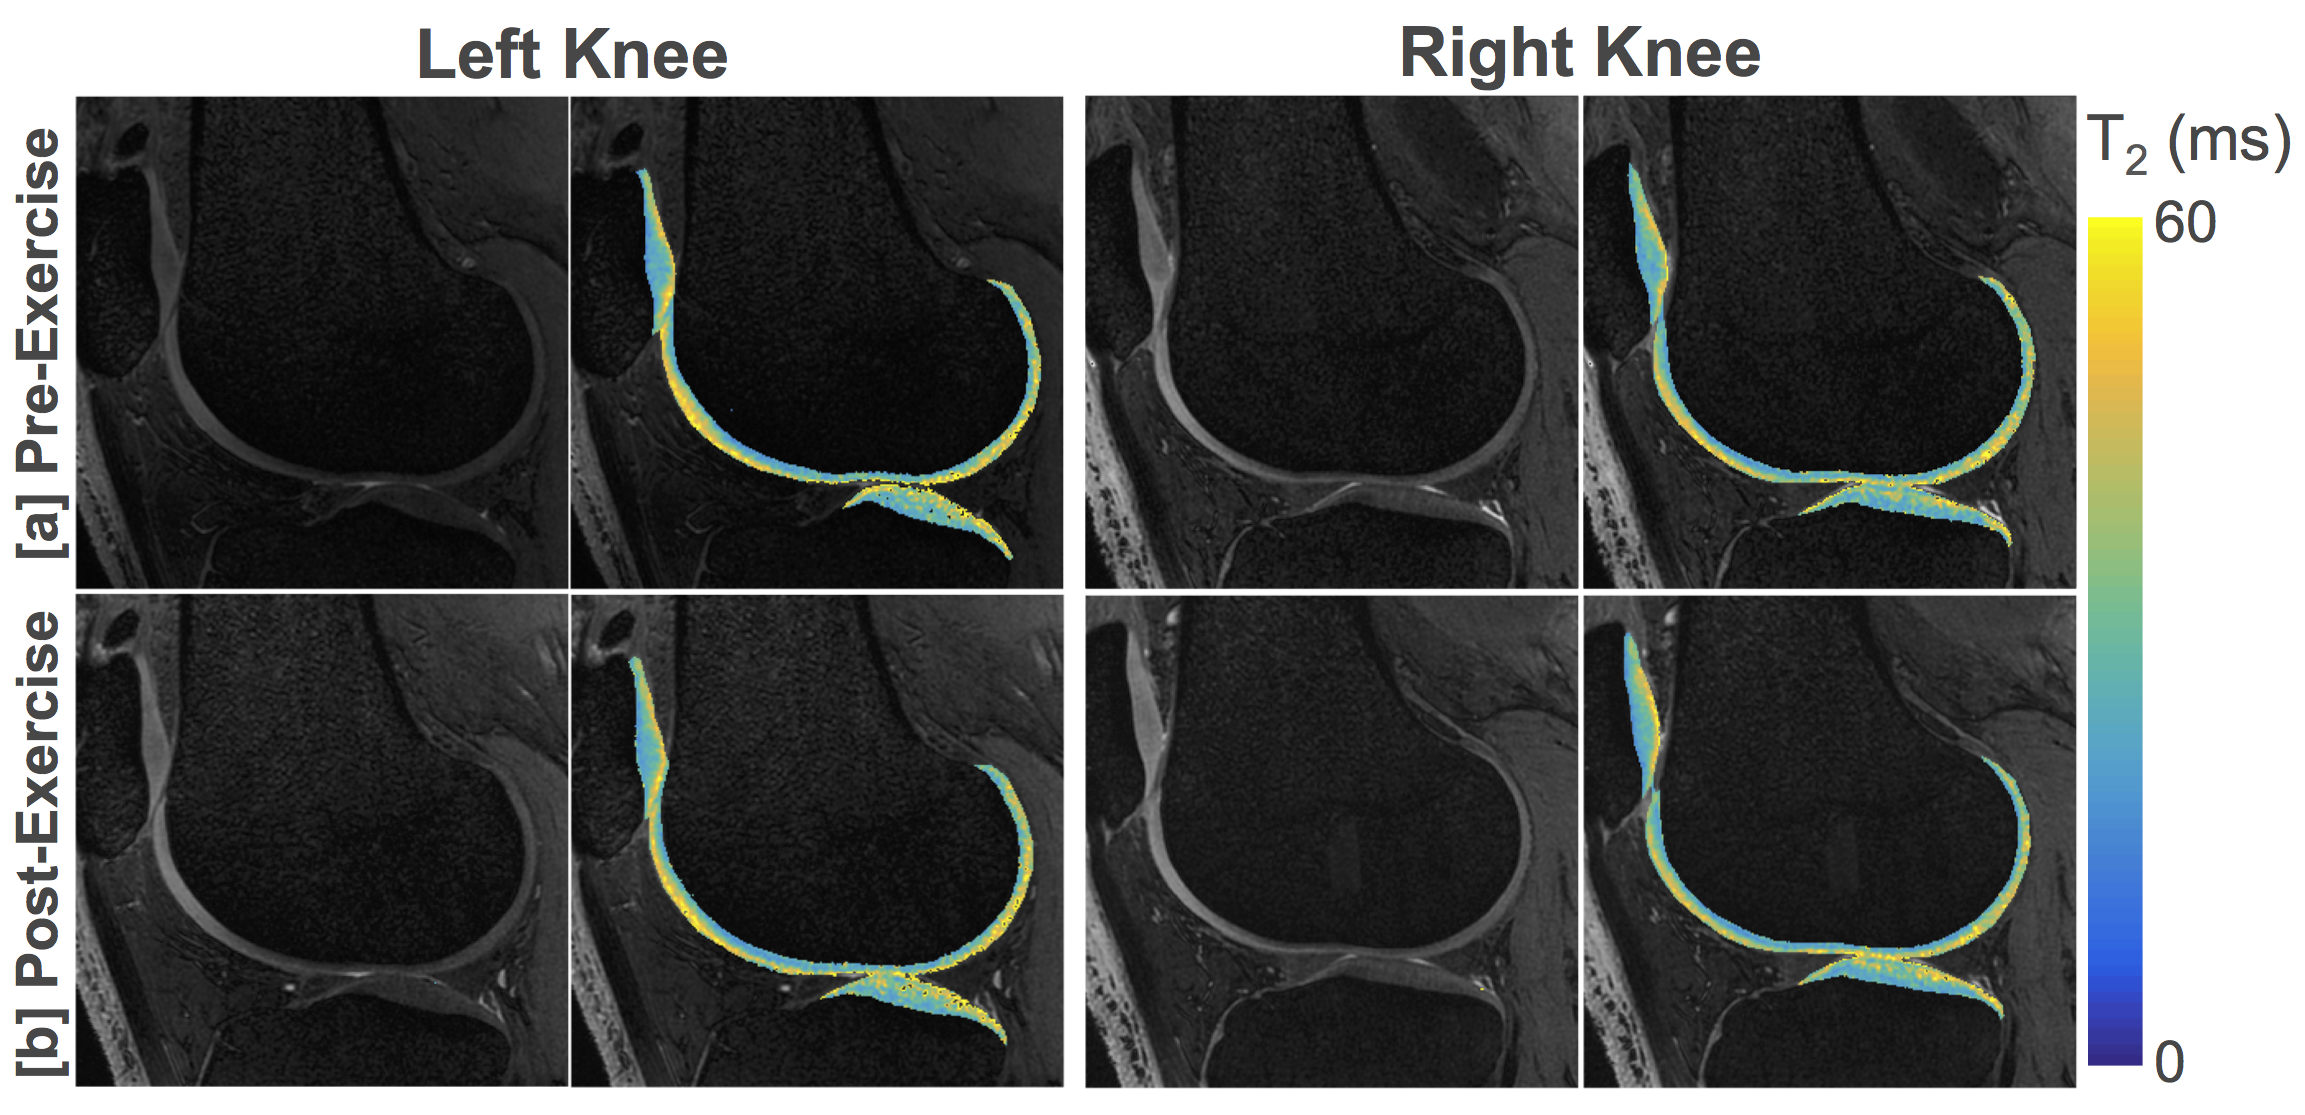
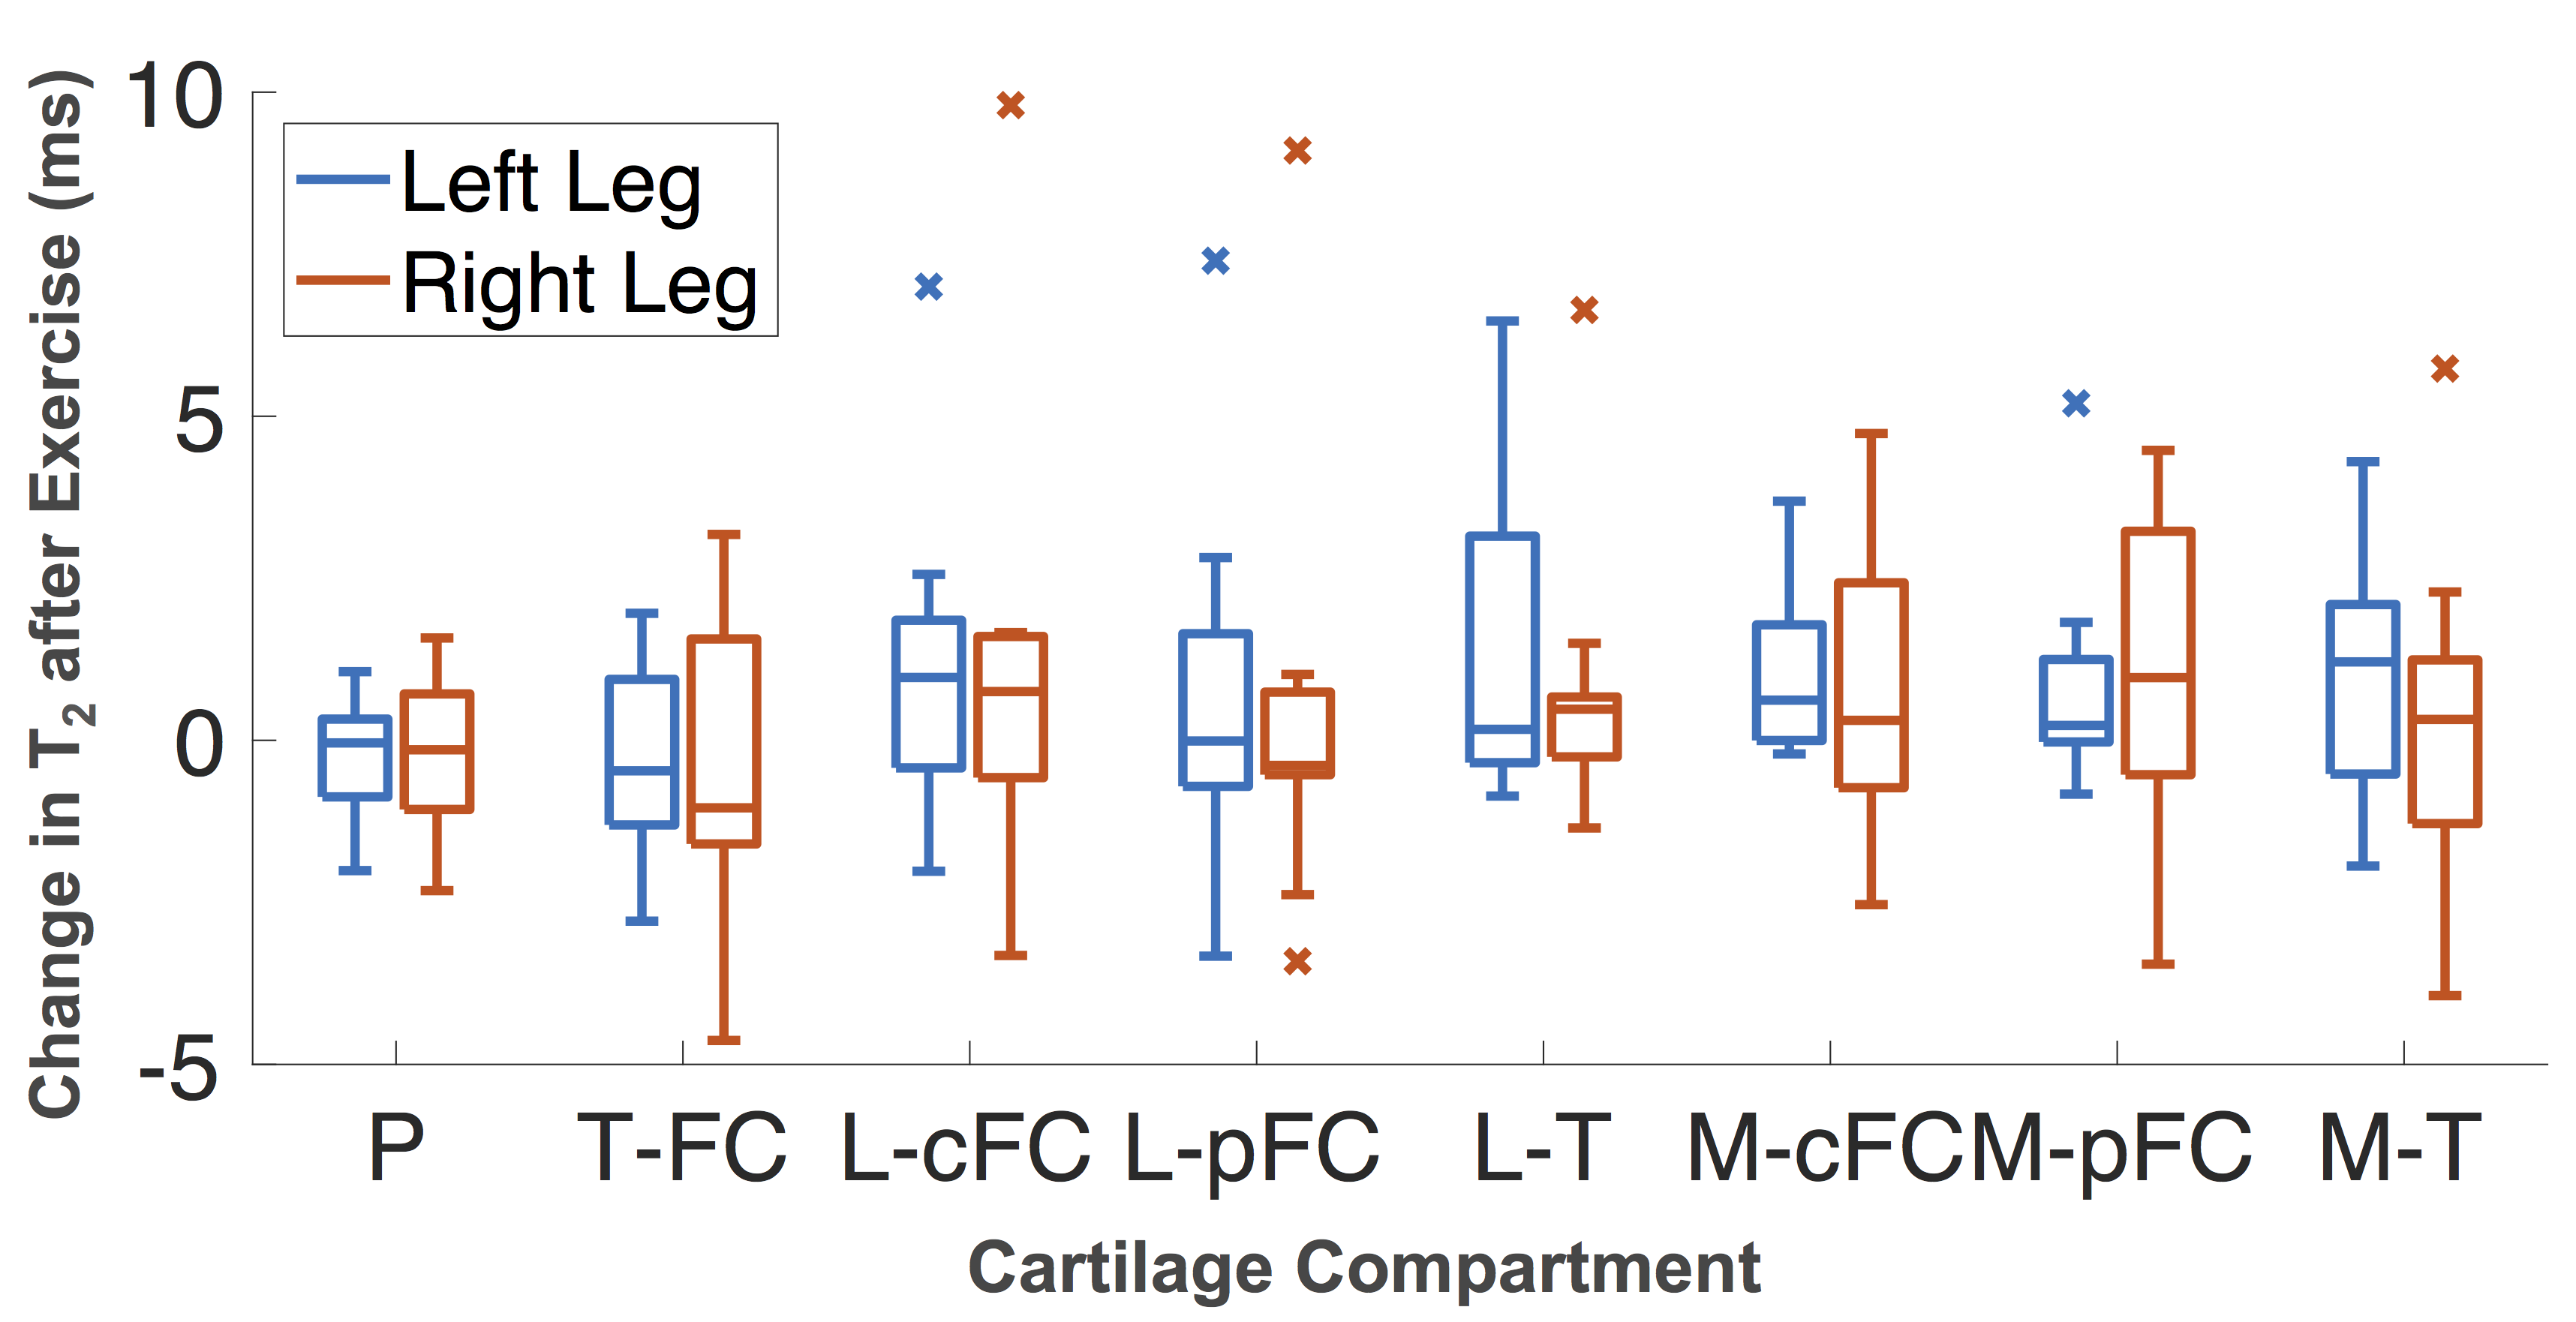
Figure 2 shows representative T2 relaxation time maps before and after exercise, acquired in both knees simultaneously. The mean changes in T2 relaxation times observed in the right and left knees were small. In both knees the patellar and trochlear cartilage showed a slight decrease in T2 relaxation times after exercise, while all other compartments exhibited a small increase in T2 values after exercise (Figure 3). In comparing T2 variations following exercise, the medial femoral and tibial cartilage in the left leg (landing leg) show the most consistent trend of increasing T2 values following exercise (p=0.06 in all three compartments). However, none of the compartmental changes were significant against the null hypothesis of no change. In comparisons between the two leg exercises, the landing leg (left leg) showed, on average, larger increases in T2 relaxation times after exercise compared to the stepping leg (right leg), however these differences were not statistically significant.DISCUSSION
This study shows the feasibility of T2 mapping in both knees simultaneously within 10 minutes of an exercise paradigm. T2 relaxation time mapping provides an objective measure of how exercise affects cartilage hydration and macromolecule organization. While we observed a small mean increase in T2 values after exercise, the results were not statistically significant. This is likely driven by both a small sample size (N=11) as well as the use of healthy volunteers where proper cartilage function is expected. Future studies in an OA population may provide important information about how exercise and knee loading affect proper cartilage mechanics. It should also be noted that simultaneous bilateral knee imaging in this study allowed us to analyze two different types of mild exercise, stepping up and jumping down. More strenuous exercise may have larger and varying effects on cartilage T2 values and exercise protocols can be tailored to examine various aspects of joint loading. Further, bilateral imaging allows the possibility of performing exercise in a single knee and using the contralateral knee as a control. Analyzing the impact of exercise and loading on the knee joint could give important insight about the breakdown of proper knee function and early signs of osteoarthritis.CONCLUSION
We demonstrated in healthy volunteers the feasibility of cartilage T2 relaxation time mapping, in both knees simultaneously, within 10 minutes of an exercise paradigm. This may allow us to study how exercise and joint loading affect proper cartilage mechanics.Acknowledgements
Acknowledgements: This work was funded by GE Healthcare and National Institute of Health (NIH) grants K99EB022634, R01EB002524, R01AR0063643, and K24AR062068.References
1. Kogan, F., Fan, A. P., McWalter, E. J., Oei, E. H. G., Quon, A. and Gold, G. E. (2016), PET/MRI of metabolic activity in osteoarthritis: A feasibility study. J. Magn. Reson. Imaging, 45: 1736–1745.
2. Hohmann, E., Wörtler, K., Imhoff A.B. MR Imaging of the Hip and Knee before and after Marathon Running. The American Journal of Sports Medicine, 2004.
3. Oei E, Van Tiel J, Robinson W, Gold G. Quantitative Radiologic Imaging Techniques for Articular Cartilage Composition: Toward Early Diagnosis and Development of Disease-Modifying Therapeutics for Osteoarthritis. American College of Rheumatology, 2014.
4. Mosher, T.J., Liu, Y., Torok, C.M. (2010), Functional Cartilage MRI T2 Mapping: Evaluating the effect of Age and Training on Knee Cartilage Response to Running. Osteoarthritis Research Society International. Volume 18, Issue 3.
5. Kogan F, Levine E, Monu U, Chaudhari A, Gold GE, Hargreaves BA. Feasibility of Simultaneous Bilateral Knee Imaging with a Dual-Coil Setup. 25th Annual Meeting of ISMRM, Honolulu, HI 2017.
6. Sveinsson B, Chaudhari AS, Gold GE, Hargreaves BA. A simple analytic method for estimating T2 in the knee from DESS. Magn Reson Imaging 2017;38:63-70.
Figures