5033
Automated evaluation of T2 relaxation time measurements in the knee cartilage at 3T1The Australian E-Health Research Centre, CSIRO, Brisbane, Australia, 2School of Information Technology and Electrical Engineering, University of Queensland, Brisbane, Australia, 3School of Human Movement and Nutrition Sciences, University of Queensland, Brisbane, Australia, 4K.G. Jebsen Center of Exercise in Medicine, Department of Circulation and Medical Imaging, Faculty of Medicine, Norwegian University of Science and Technology, Trondheim, Norway, 5Siemens Healthcare, Sydney, Australia
Synopsis
A software framework for fully automated analysis in 3D of regional distribution of biochemical MRI values in knee cartilage sub-regions was proposed. The framework was compared to values extracted using manual segmentations and strong agreement with the automated measures was found. The framework was applied in a preliminary analysis to assess the reproducibility of T2 relaxation time measurements at 3T with promising results. The proposed automated framework can facilitate investigations and advance the search for biomarkers of pathophysiological processes preceding the development of osteoarthritis.
Introduction
Quantitative magnetic resonance imaging (MRI) using T2 relaxometry has gained considerable attention as a potential imaging biomarker of osteoarthritis1. Previous studies reported promising results in identifying early degenerative changes in the cartilage with the T2 mapping techniques, but also some challenges (variability due to used hardware, imaging protocols, post-processing and reconstruction techniques) that need to be overcome before they can be considered a reliable and valid biomarker1,2. Evaluations of T2 mapping protocols in the literature have been limited to studies with manually or semi-automatically drawn regions of interest which considerably limits the number of included cases and the reproducibility of the volumetric assessment3,4. There is a clear need for automated standardized processing workflows that would enable to study these issues in larger cohorts across various protocols, imaging equipment and reconstruction methods. This study aimed to design a fully automated framework for describing distributions of any quantitative MRI signal in pre-defined sub-regions of the knee cartilage. A secondary aim was to show how the framework can be applied to investigate the reliability of the T2 relaxation time measurements.Methods
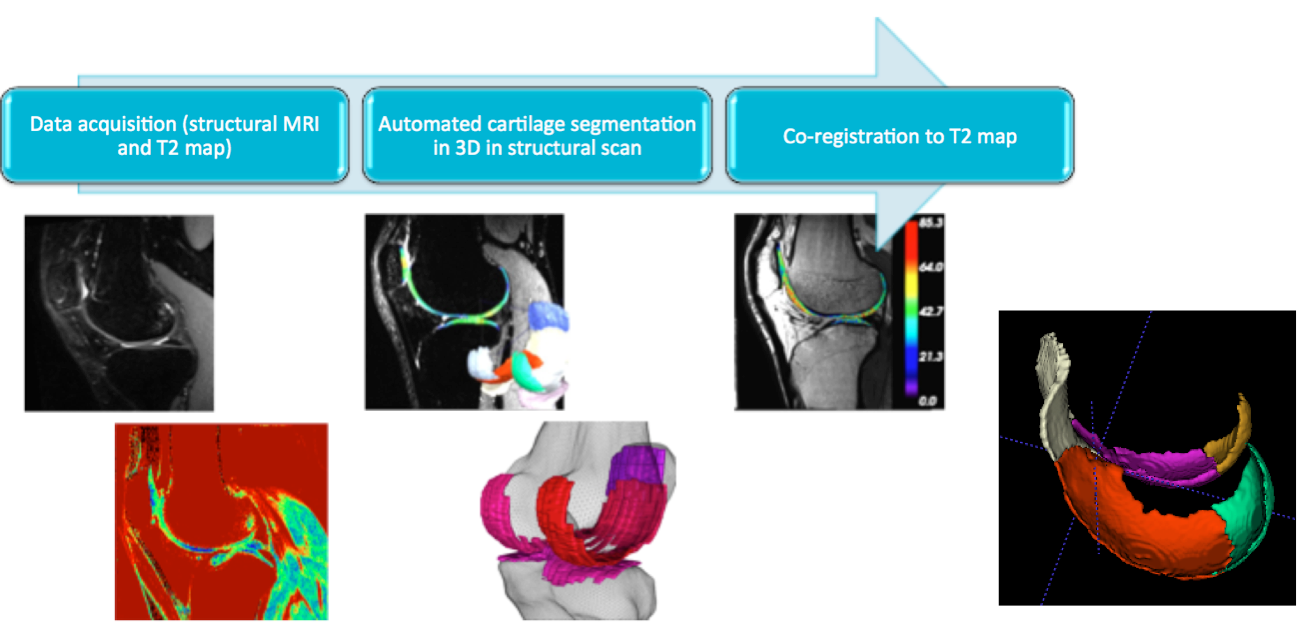
The framework was based on an established segmentation algorithm that extracts knee cartilages in 3D from a volumetric structural MRI scan5 (e.g. DESS, SPACE). A rigid co-registration algorithm6 was applied to align the volumetric structural image and the corresponding segmentation to the T2 echo image. The cartilage segmentation was partitioned into 8 sub-regions (1 for patellar, 2 for tibial and 5 for femoral cartilage) defined by experts on a set of prior atlases7: patellar, medial tibial, lateral tibial, trochlear (anterior femoral cartilage), medial and lateral inferior condyle (contact regions), medial and lateral posterior condyle. The processing workflow and example of the femoral cartilage partitioning are illustrated in Fig 1. The proposed framework was used to extract median T2 relaxation times in each cartilage sub-region. To limit the effects of outliers and unreliable boundary voxels, the outer voxel layer was excluded from the analysis and only the internal cartilage voxels were considered. The lowest and highest 10% of the voxel values were trimmed to further increase the robustness of the measurement. The extracted values from this automated analysis were compared to median values obtained in the same manner using manual segmentations of a trained rater (IC) supervised by experienced musculoskeletal anatomist (CE).
The T2 measurements were evaluated on a dataset of eighteen asymptomatic subjects (30.1±7.9 years, BMI 24.0±4.3 kg/m2, 50% female). The images were acquired at 3T MRI (MAGNETOM Prisma, Siemens Healthcare, Erlangen, Germany) using a 16-channel knee coil. The acquisition consisted of a structural 3D DESS scan (0.3x0.3x0.6mm, TE/TR 5.04/14.84ms) for the segmentation, and a multi-echo spin-echo T2 mapping scan in the sagittal plane (voxel size 0.5x0.5mm, slice thickness 2mm, slice gap 2mm) with 7 echo times (13.8-96.6ms). For two subjects, the T2 mapping acquisition was performed twice within the same exam to evaluate the reproducibility of the signal. Furthermore, one male subject (46 years) was examined at 3 time points: baseline (TP1), 1 week (TP2) and 3 weeks (TP3) to assess the effects of day-to-day variability.
Results
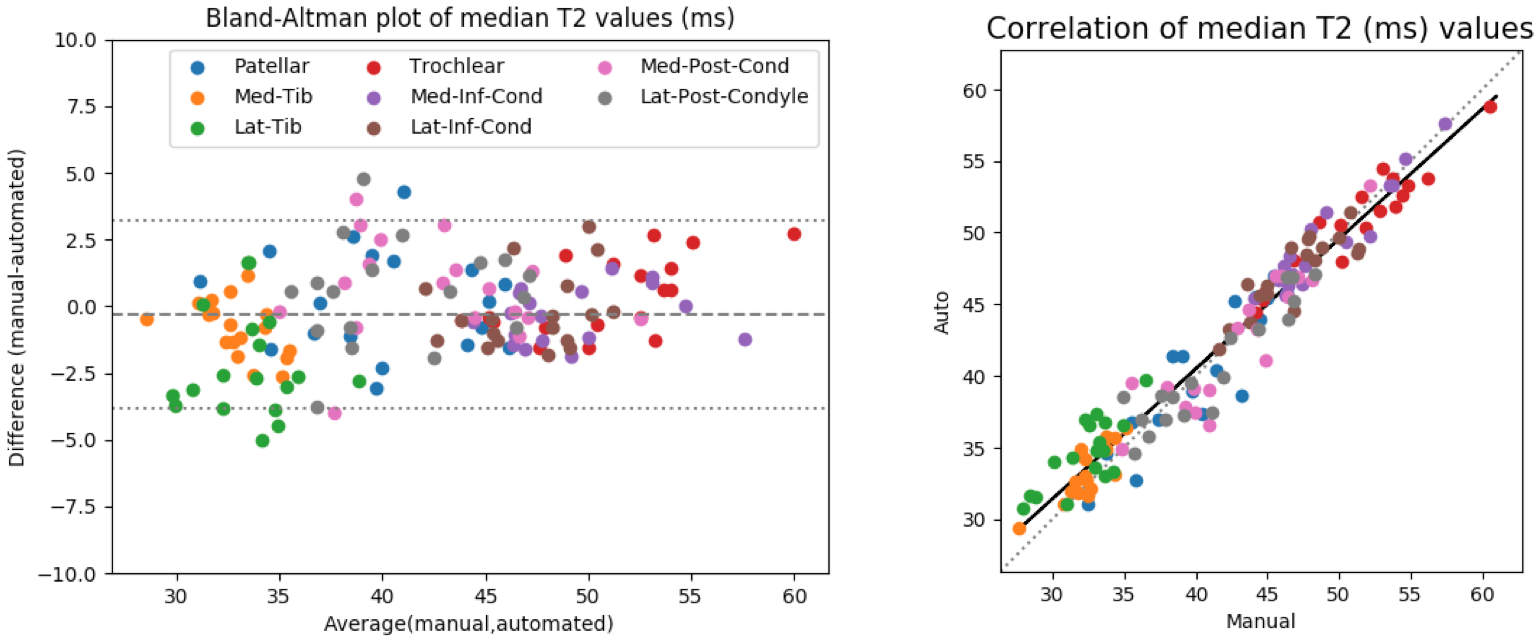
Bland-Altman and correlation plots of agreement between the median T2 relaxation times of combined 8 cartilage sub-regions extracted using the manual and automated segmentations are presented in Fig 2. The overall 95% limits of agreement were -0.3±3.5ms (-0.7±8.3%) and the intra-class correlation was 0.96.
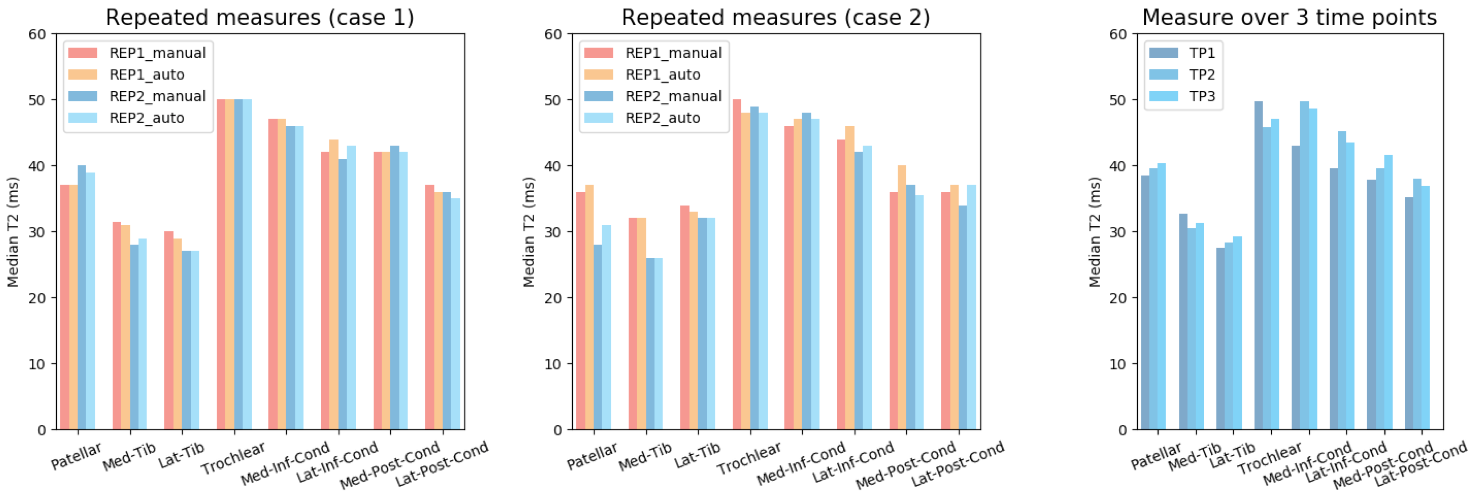
Comparison of T2 values between two repeated acquisitions within the same exam and across three time points are presented in Fig. 3.
Discussion
Strong agreement between measures from manual and automated segmentations was observed over 18 subjects. The highest T2 values were observed in the femoral cartilage, followed by the patellar and tibial regions. The values reflecting the different composition in each sub-region were consistent with the literature7. Repeated acquisitions showed minimal variation in the T2 time measurements (both for manual and automated methods). The largest difference observed (8ms in the pattelar cartilage for case 2 and 7ms between TP1 and TP2 for the third case) were small compared to the values and differences seen in diseased cartilage3. These results overall support the use of the framework for quantitative analysis of T2 maps in the knee cartilage that will automated the tedious manuals assessments and enable application to large study cohorts.Conclusion
The proposed software framework enables fully automated analysis in 3D of local distribution of biochemical MRI values in knee cartilage sub-regions with any quantitative MRI protocol. Preliminary analysis of reproducibility of T2 relaxation time measurements on a limited dataset showed promising results but warrants further investigations on larger cohorts with heterogeneous data.Acknowledgements
This research was supported under Australia’s NHRMC Development Grant No. APP1091996. IC is supported by a postdoctoral fellowship from the Swiss National Science Foundation.References
[1] Baum T, Joseph GB, Karampinos DC, Jungmann PM, Link TM, Bauer JS. Cartilage and meniscal T2 relaxation time as non-invasive biomarker for knee osteoarthritis and cartilage repair procedures. Osteoarthr Cartil. 2013;21(10):1474-1484. doi:10.1016/j.joca.2013.07.012.
[2] Surowiec RK, Lucas EP, Ho CP. Quantitative MRI in the evaluation of articular cartilage health: Reproducibility and variability with a focus on T2 mapping. Knee Surgery, Sport Traumatol Arthrosc. 2014;22(6):1385-1395. doi:10.1007/s00167-013-2714-6.
[3] Glaser C, Mendlik T, Dinges J, et al. Global and regional reproducibility ofT2 relaxation time measurements in human patellar cartilage. Magn Reson Med. 2006;56(3):527-534. doi:10.1002/mrm.21005.
[4] Mosher TJ, Zhang Z, Reddy R, et al. Knee Articular Cartilage Damage in Osteoarthritis: Analysis of MR Image Biomarker Reproducibility in ACRIN-PA 4001 Multicenter Trial. Radiology. 2011;258(3):832-842. doi:10.1148/radiol.10101174.
[5] Fripp J, Crozier S, Warfield SK, Ourselin S. Automatic segmentation and quantitative analysis of the articular cartilages from magnetic resonance images of the knee. IEEE Trans Med Imaging. 2010;29(1):55-64. doi:10.1109/TMI.2009.2024743.
[6] Ourselin S, Stefanescu R, Pennec X. Robust registration of multi-modal images: towards real-time clinical applications. Med Image Comput Comput Interv. 2002:140-147.
[7] Surowiec RK, Lucas EP, Fitzcharles EK, et al. T2 values of articular cartilage in clinically relevant subregions of the asymptomatic knee. Knee Surgery, Sport Traumatol Arthrosc. 2014;22(6):1404-1414. doi:10.1007/s00167-013-2779-2.
Figures