5031
Formalin fixation significantly changes cell membrane permeability in cortical brain tissue1Interdisciplinary Institute of Neuroscience and Technology, Qiushi Academy For Advanced Studies, Zhejiang University, Hangzhou, China, 2Section on Quantitative Imaging and Tissue Sciences, DIBGI, NICHD, National Institutes of Health, Bethesda, MD, United States
Synopsis
Ex vivo, formalin-fixed biological tissue sample are often used to validate MRI methods for in vivo applications. However, since fixation may alter the chemical and physical properties of tissue, including the cell membrane permeability, it is important to know how and whether fixation changes in water microdynamics and potentially affects MRI signals. In this work, we studied the transmembrane water exchange kinetics in live rat brain cortical tissue in vitro, and following formalin fixation. We found that the fixation process can significantly increase the transmembrane water exchange kinetics by increasing the cell membrane permeability to water.
Introduction
Ex vivo biological tissue is widely used as a “gold standard” to validate quantitative MRI methods. Its higher signal-to-noise ratio, absence of motion and flow artifacts, long-term stability, and the possibility to perform histological comparisons make it an ideal MRI phantom material. However, the fixation process also alters the chemical and physical properties of tissue, and may affect the cells’ cytoplasmic membranes. Water in the intra- and extracellular spaces is in steady-state exchange, which can significantly affect many MRI experiments (e.g., diffusion MRI1,2, microstructure MRI3,4). Thus, it is necessary to understand how formalin fixation affects transmembrane water exchange kinetics, to relate data from fixed tissue MRI to in vivo MRI. In this work, we studied the water exchange kinetics in live cortical brain tissue–organotypic cortical cultures (OCC)–from newborn rat somatosensory cortex, under in vitro conditions, and following fixation with 4% formalin.Methods
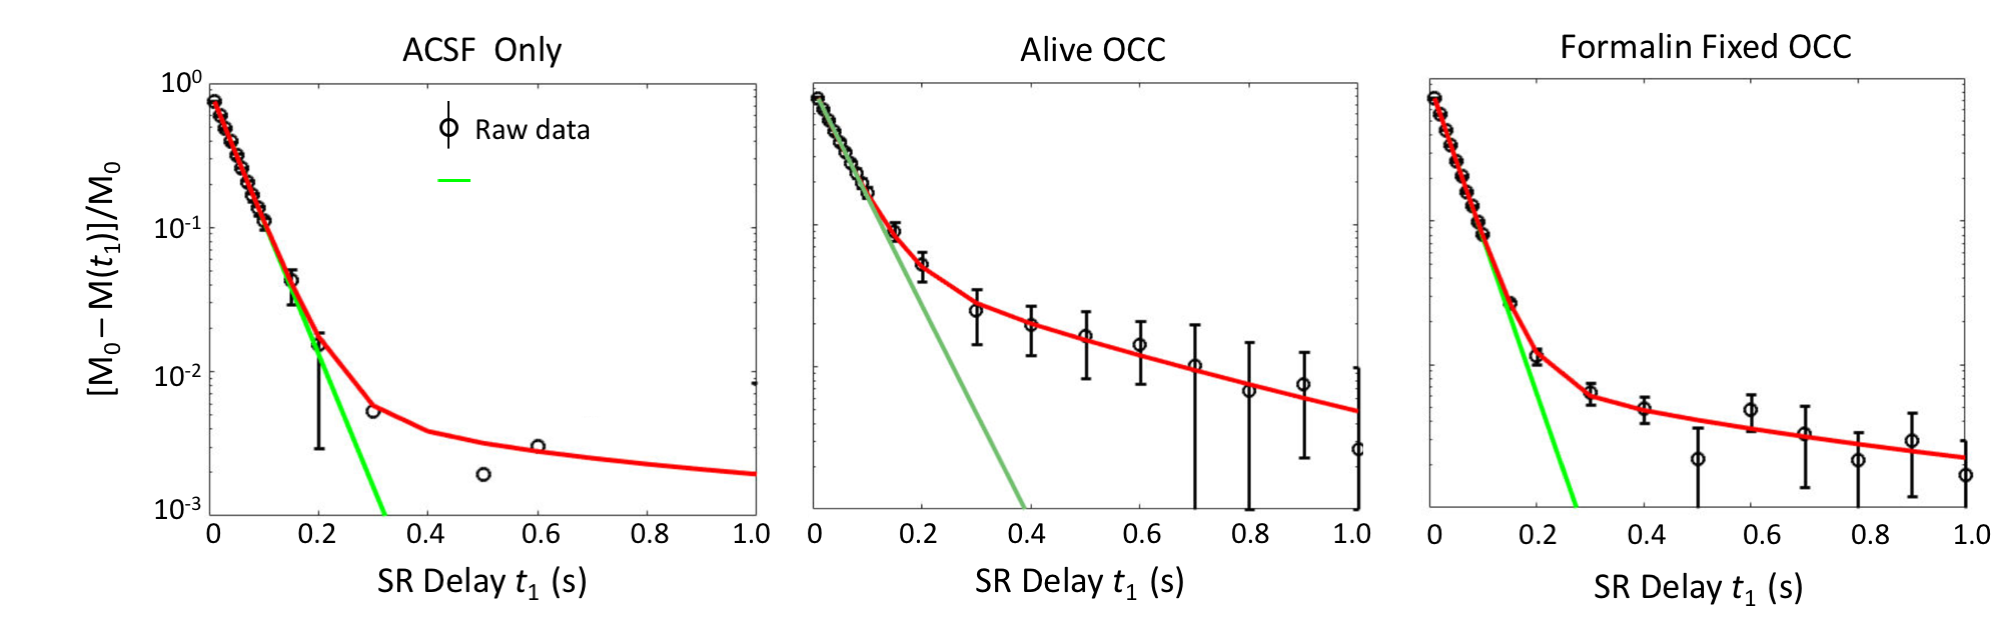
We studied OCC at two conditions: (A) alive exhibing normal functional activity, perfused with ACSF at a constant temperature 34.0 (± 1.0) °C, and (B) 4% formalin fixed for approximately 1 hour, washed by PBS, and kept at room temperature 23.0 (± 1.0) °C. Longitudinal MR relaxometry with an extracellular gadolinium-based MR relaxation contrast agent (CA), Gadoteridol (Prohance (PH)), was used to distinguish intracellular and extracellular water compartments by increasing the extracellular waters’ longitudinal relaxation rate constant (R1o). A saturation-recovery (SR) MR sequence with 21 recovery times (t1) was used to measure sample R1 values at CA concentration of 5.0 mM. Details of this experimental method are provided in ref 5. The equilibrium longitudinal magnetization, M0, was assigned the value acquired at the longest t1 (= 5 s) The longitudinal magnetization at all other t1 values, M(t1), was subtracted from and normalized by M0. The quantity, [M0 - M(t1)]/M0 was fitted with empirical single-exponential and bi-exponential models,
$$\frac{M_{0}-M(t_{1})}{M_{0}}=(1-\alpha)e^{-R_1^{'}t_{1}}$$ (1)
$$\frac{M_{0}-M(t_{1})}{M_{0}}=(1-\alpha)[p_{sm}^{'}e^{-R_{1sm}^{'}t_{1}}+(1-p_{sm}^{'})e^{-R_{1lar}^{'}t_{1}}]$$ (2)
where $$$\cos^{-1}\alpha $$$ is the effective flip-angle of the saturation pulse, $$$R_{1sm}^{'} $$$ and $$$R_{1lar}^{'} $$$ are the small and large apparent relaxation rate constants, respectively, and $$$p_{sm}^{'} $$$ is the apparent fractional intensity of the $$$R_{1sm}^{'} $$$ signal.
Results
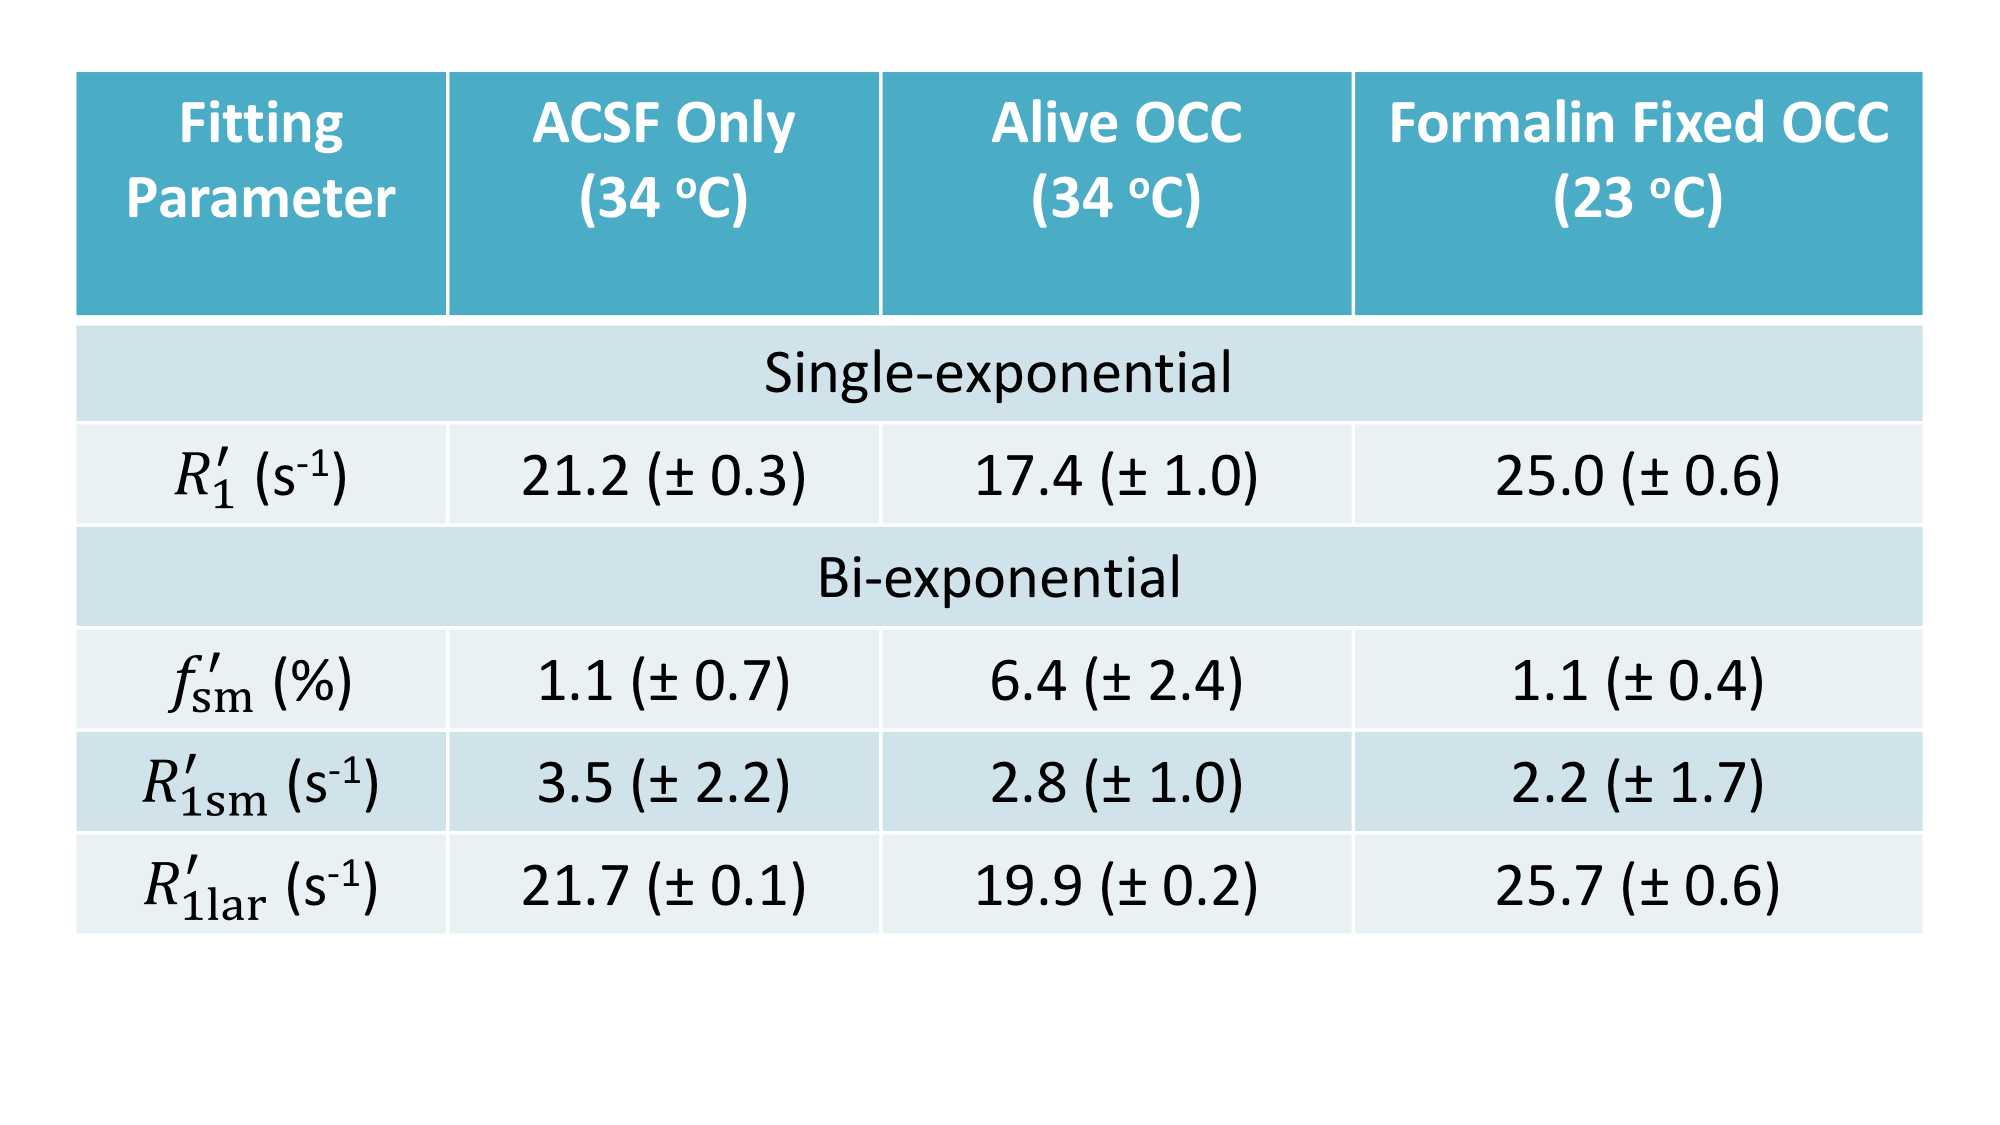
In Figure 1, the SR data from ACSF is fit well by a single-exponential function at [PH] = 5 mM. However, the live OCC SR data clearly requires at least a bi-exponential model fit (Eq. (2)), suggesting that at least two water compartments exist in the live OCC. The parameters estimated are summarized in Figure 2. The $$$p_{sm}^{'} $$$, is approximately 0.064, which is significantly larger than that from ACSF only (0.011, p = 1 × 10⁻⁵, Student t-test). Interestingly, the SR data from formalin-fixed OCCs largely differed from the live OCCs. In the bi-exponential fitting, the $$$p_{sm}^{'} $$$ from formalin-fixed OCCs (0.011) is significantly smaller than that from live OCCs (p = 1× 10⁻⁶), while not significantly different from that of ACSF only (p = 0.87).Discussion
Healthy live brain tissue (including OCC) transmembrane water exchange has been measured previously with MR CA perfusion or infusion: kio ~ 2 s-1.5,6 In the formalin-fixed OCC, the SR data is very close to a single-exponential decay, with a small $$$p_{sm}^{'} $$$ from bi-exponential fitting (0.011), close to the values obtained from MR SR data of ACSF only. This suggests that this small $$$p_{sm}^{'} $$$ might be a result of noise, rather than a second water compartment.
Two cases may explain the phenomena observed in formalin-fixed OCC: (1) fixation makes cell membrane permeable to the CA (PH in this case), and then the intra- and extracellular water compartments can no longer be distinguished by the R1 difference caused by CA localization; or (2) formalin fixation increases cell membrane permeability to water but not to PH, and the system reaches the fast-exchange-limit. In case (1), the cell membrane permeability to water must also be significantly increased since water molecules (Mw = 18) are much smaller than PH molecules (Mw = 559). In both cases, kio has been significantly enhanced, which agrees with other studies on erythrocyte ghost tissue model7. Transmembrane water exchange in live brain cortex involves two pathways: a passive pathway driven by diffusion across membrane and an active pathway mainly driven by the action of the Na+/K+ pump and associated with transport of ions and other molecules.5 Formalin fixation stops all active pathways. The lower temperature of the ex vivo experiments (23 oC vs 34 oC) should also reduce water exchange via the diffusion-based passive pathway. Thus, the mechanism behind the accelerated transmembrane water exchange kinetics in formalin-fixed OCC must be that that the fixative increases the lipid bilayer permeability to water.
Acknowledgements
PB was supported by the Intramural Research Program (IRP) of the Eunice Kennedy Shriver National Institute of Child Health and Human Development, National Institutes of Health. RB and XJ were supported by the 985 Program at Zhejiang University.References
1. Nilsson M, Lätt J, Nordh E, Wirestam R, Ståhlberg F, Brockstedt S. On the effects of a varied diffusion time in vivo: is the diffusion in white matter restricted? Magn Reson Imaging. 2009;27(2):176-187. .
2. Lee J-HH, Springer CS. Effects of equilibrium exchange on diffusion-weighted NMR signals: The diffusigraphic “shutter-speed.” Magn Reson Med. 2003;49(3):450-458.
3. Pfeuffer J, Flögel U, Dreher W, Leibfritz D. Restricted diffusion and exchange of intracellular water: theoretical modelling and diffusion time dependence of 1H NMR measurements on perfused glial cells. NMR Biomed. 1998;11(1):19-31.
4. Harkins KD, Dula AN, Does MD. Effect of intercompartmental water exchange on the apparent myelin water fraction in multiexponential T2 measurements of rat spinal cord. Magn Reson Med. 2012;67(3):793-800. doi:10.1002/mrm.23053.
5. Bai R, Springer CS, Plenz D, Basser PJ. Fast, Na + /K + pump driven, steady-state transcytolemmal water exchange in neuronal tissue: A study of rat brain cortical cultures. Magn Reson Med. 2017;Early View. doi:10.1002/mrm.26980.
6. Quirk JD, Bretthorst GL, Duong TQ, et al. Equilibrium water exchange between the intra- and extracellular spaces of mammalian brain. Magn Reson Med. 2003;50(3):493-499.
7. Thelwall PE, Shepherd TM, Stanisz GJ, Blackband SJ. Effects of temperature and aldehyde fixation on tissue water diffusion properties, studied in an erythrocyte ghost tissue model. Magn Reson Med. 2006;56(2):282-289.
Figures