5029
Relaxivity of Ferumoxytol at 1.5T and 3.0T1Department of Radiology, University of Wisconsin – School of Medicine and Public Health, Madison, WI, United States, 2Department of Biomedical Engineering, University of Wisconsin – School of Medicine and Public Health, Madison, WI, United States, 3Department of Medical Physics, University of Wisconsin – School of Medicine and Public Health, Madison, WI, United States, 4Department of Biomedical Engineering, University of Wisconsin – School of Medicine and Public Health, Madison, WY, United States, 5Department of Medicine, University of Wisconsin – School of Medicine and Public Health, Madison, WI, United States, 6Department of Emergency Medicine, University of Wisconsin – School of Medicine and Public Health, Madison, WI, United States
Synopsis
Ferumoxytol (Feraheme, AMAG, Waltham, MA) is an iron supplement that has shown promise as an off-label alternative contrast agent for MRI. Optimization of imaging and dosing protocols requires accurate knowledge of the relaxation characteristics of ferumoxytol, which are currently not well understood. Therefore, the purpose of this work was to measure the r1, r2 and r2* relaxivity of ferumoxytol. Studies were performed at 1.5T and 3.0T over a range of concentrations, in saline, human plasma, and human blood, all at body temperature.
Introduction
Ferumoxytol (Feraheme, AMAG, Waltham, MA) is an iron supplement (1, 2) that has shown promise as an off-label alternative contrast agent for MRI. Precise characterization of the MR relaxation properties of ferumoxytol is necessary for dose and image acquisition optimization. Currently however, rigorous relaxation measurements over a sufficiently wide range of ferumoxytol concentrations at 1.5T are limited (3-6) and completely lacking at 3.0T. This study sought to provide rigorous characterization of the relaxation properties of ferumoxytol under physiological conditions at both 1.5T and 3.0T.
Methods
An IRB waiver was provided for this study. Human packed red blood cells (6 units) and plasma (6 units) were mixed to reconstitute whole blood. Six units of plasma were mixed to obtain an “average” plasma-sample. Dilutions of ferumoxytol with saline, plasma and blood were created (0.26-4.2mM).
In vitro MR-relaxometry experiments were performed in an MR-compatible water bath at 37˚C at 1.5T and 3.0T (1.5T Signa-HDxt and 3.0T Discovery-MR 750, GE Healthcare, Waukesha, WI) using an 8-channel (1.5T) and a 32-channel (3.0T) phased array torso coil, respectively.
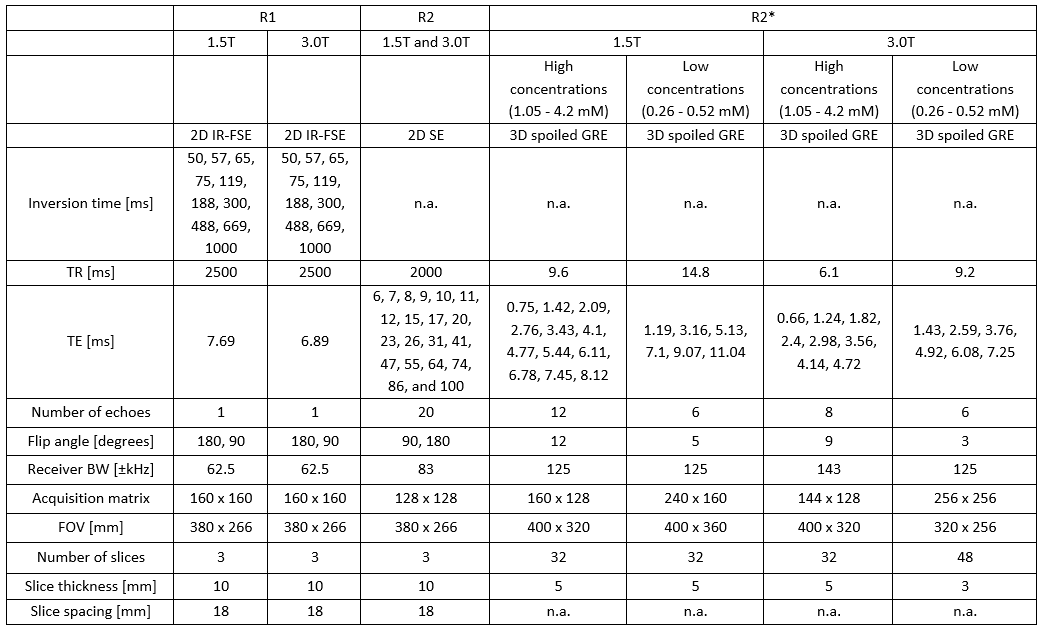
Longitudinal relaxation rate constants (R1) were measured as a function of ferumoxytol concentration using a 2D-FSE inversion recovery sequence with multiple logarithmically spaced inversion times (Table 1). Transverse relaxation rate constants (R2, R2*) were measured using a 2D-SE and a 3D-multiecho spoiled GRE chemical shift-encoded sequence, respectively (Table 1).
Linear regression of the relaxation rates (R1, R2, R2*) at different ferumoxytol concentrations was used to estimate relaxivities (r1, r2, r2*) based on the slope of the regression. When the relationship between relaxation rates and ferumoxytol concentration was nonlinear, 2nd order polynomial fitting was used.
Results
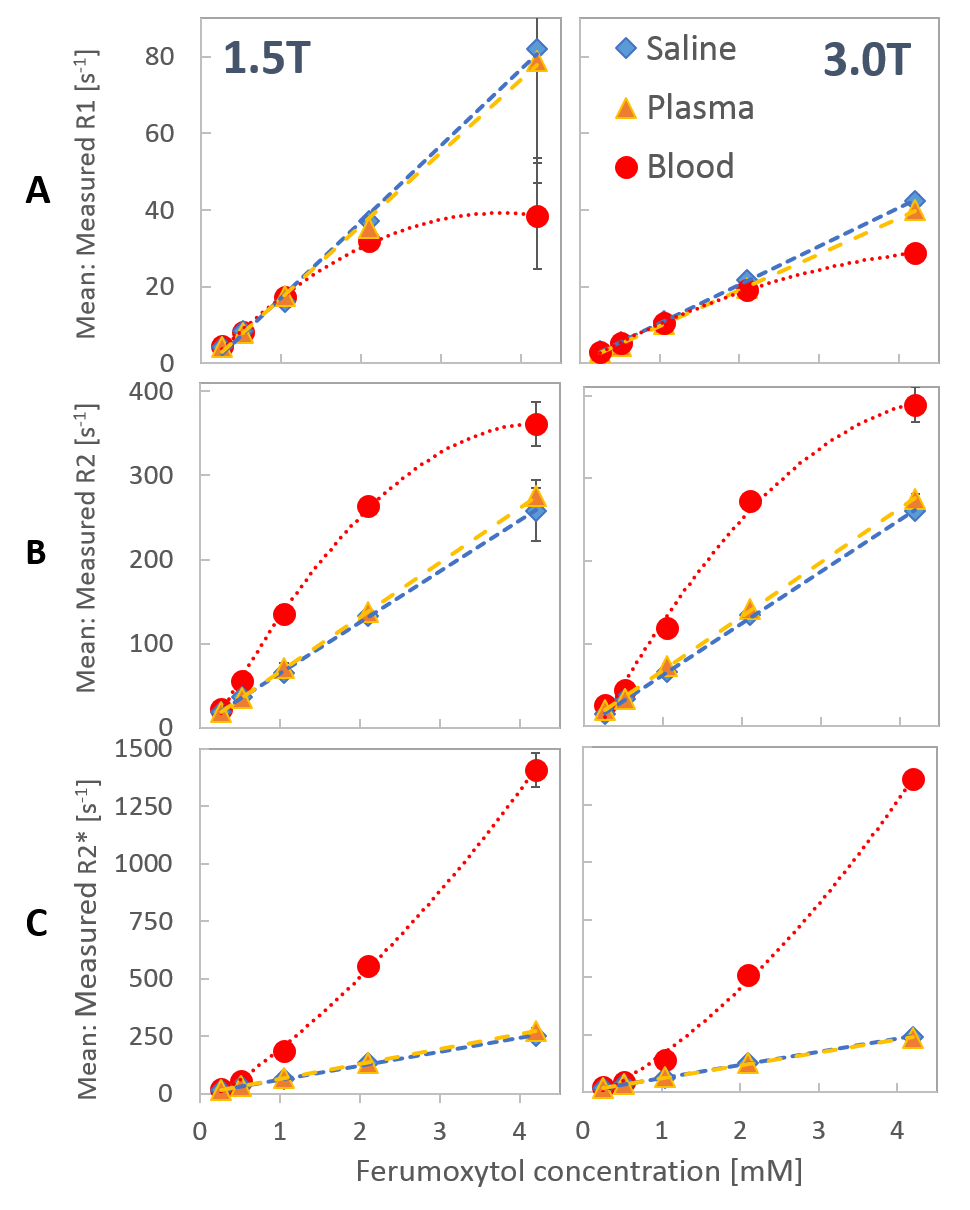
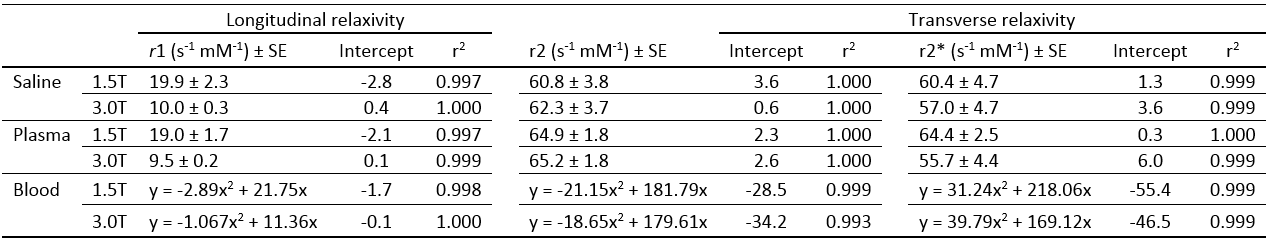
In saline and plasma, a linear dependence of R1, R2 and R2* on ferumoxytol concentration was observed (Figure 1). In blood, the dependence of relaxation rates on ferumoxytol concentration was nonlinear (Figure 1). Formulas for 2nd order polynomial fits of the relaxation rates were calculated, characterizing the relationship between ferumoxytol concentration in blood with R1, R2 and R2* (Table 2).
R1 values at 1.5T were higher than at 3.0T in saline-, plasma- and blood-dilutions (Figure 1, Table 2).
For ferumoxytol in saline and plasma, R2 values were very similar to the corresponding R2* values (Figure 1, Table 2), indicating that there is little to no refocusable transverse magnetization. In blood however, R2 and R2* were unequal with much lower R2 values (Figure 1), indicating the presence of some refocusable transverse magnetization.
Finally, we note that R2 and R2* were similar at 1.5T and 3.0T in saline-, plasma- and blood-dilutions (Figure 1, Table 2).
Discussion
This study is the first to characterize the MR relaxation properties of ferumoxytol over a wide range of concentrations and at near physiological conditions in saline, human plasma and blood, at both 1.5T and 3.0T.
We found that the dependence of relaxation rates on ferumoxytol was highly linear in saline and plasma but nonlinear in blood, which has not been reported previously. The nonlinear behavior can be explained by two different compartmentalization effects: first, a compartmentalization of water protons between the intra- and extracellular space due to a decreased cell membrane permeability with increasing contrast agent concentrations (7, 8). Second, is the compartmentalization or relative aggregation of ferumoxytol within the smaller (solely extracellular) volume in blood (5).
We also found that R1 values are higher at 1.5T than at 3.0T, which is consistent with previous studies showing generally increased R1 at lower field strengths (9, 10).
Further, we demonstrated that R2 and R2* are similar in saline and plasma. This is expected because the diffusion of water occurs over a much larger spatial scale than the microscopic field inhomogeneities induced by individual ferumoxytol particles. Therefore, refocusing pulses do not recover any transverse magnetization. In blood however, the dipole effects between the intra- and extracellular volume cause the formation of vastly different relaxation rates, where intracellular water protons experience a homogeneous and extracellular water protons an inhomogeneous magnetic field. These magnetic field inhomogeneities are on the order of the spatial scale over which water molecules diffuse. For this reason, spin-echo acquisitions can recover some transverse magnetization, leading to lower R2 relaxation rates compared to R2*.
Lastly, the similar behavior of R2 and R2* between 1.5T and 3.0T in all three solutions can be explained by the superparamagnetic properties of ferumoxytol, an iron-oxide which reaches its full magnetization at much lower field strengths (~0.25T) (11).
Conclusion
The MR relaxation properties of ferumoxytol reported in this study may be helpful for future contrast agent dosing and protocol optimization at 1.5T and 3.0T.
Acknowledgements
This project was supported by the Departments of Radiology and Medical Physics, at the University of Wisconsin. The authors also wish to acknowledge support from GE Healthcare and Bracco Diagnostics who provide research support to the University of Wisconsin. Further, we also wish to acknowledge support from the NIH (K24 DK102595, U01HD087216).
Curtis Wiens contributed to this work while employed by UW-Madison but is now an employee of Synaptive Medical in Toronto, Canada.
Tilman Schubert contributed to this work while employed by UW-Madison but is now an employee of the Department of Radiology, University Hospital Bern, Switzerland.
Samir Sharma contributed to this work while employed by UW-Madison but is now an employee of Toshiba Medical Research Institute, USA.
References
1. Lu M, Cohen MH, Rieves D, Pazdur R. FDA report: Ferumoxytol for intravenous iron therapy in adult patients with chronic kidney disease. Am J Hematol. 2010;85(5):315-9.
2. Spinowitz BS, Kausz AT, Baptista J, et al. Ferumoxytol for treating iron deficiency anemia in CKD. J Am Soc Nephrol. 2008;19(8):1599-605.
3. Prince MR, Zhang HL, Chabra SG, et al. A pilot investigation of new superparamagnetic iron oxide (ferumoxytol) as a contrast agent for cardiovascular MRI. J Xray Sci Technol. 2003;11(4):231-40.
4. Li W, Tutton S, Vu AT, et al. First-pass contrast-enhanced magnetic resonance angiography in humans using ferumoxytol, a novel ultrasmall superparamagnetic iron oxide (USPIO)-based blood pool agent. J Magn Reson Imaging. 2005;21(1):46-52.
5. Corot C, Robert P, Idee JM, Port M. Recent advances in iron oxide nanocrystal technology for medical imaging. Adv Drug Deliv Rev. 2006;58(14):1471-504.
6. Finn JP, Nguyen KL, Han F, et al. Cardiovascular MRI with ferumoxytol. Clin Radiol. 2016;71(8):796-806.
7. Wilson GJ, Woods M, Springer CS, Jr., et al. Human whole-blood (1)H2O longitudinal relaxation with normal and high-relaxivity contrast reagents: influence of trans-cell-membrane water exchange. Magn Reson Med. 2014;72(6):1746-54.
8. Zhang Y, Poirier-Quinot M, Springer CS, Jr., Balschi JA. Active trans-plasma membrane water cycling in yeast is revealed by NMR. Biophys J. 2011;101(11):2833-42.
9. Shen Y, Goerner FL, Snyder C, et al. T1 relaxivities of gadolinium-based magnetic resonance contrast agents in human whole blood at 1.5, 3, and 7 T. Invest Radiol. 2015;50(5):330-8.
10. de Bazelaire CM, Duhamel GD, Rofsky NM, Alsop DC. MR imaging relaxation times of abdominal and pelvic tissues measured in vivo at 3.0 T: preliminary results. Radiology. 2004;230(3):652-9.
11. Bullivant JP, Zhao S, Willenberg BJ, et al. Materials characterization of Feraheme/ferumoxytol and preliminary evaluation of its potential for magnetic fluid hyperthermia. Int J Mol Sci. 2013;14(9):17501-10.
Figures