5024
Comparison of Labeling Capacity for Protamine-sulphate-conjugated and FuGENE-labeled Progenitor Cardiac Stem Cells using Perfluorocarbon Nanoparticle Labels for In Vivo Murine Cardiac 19F MRI/MRS1U. Oxford, Oxford, United Kingdom, 2U. Coimbra (UC-BIOTECH), Cantanhede, Portugal, 3Radboud University Medical Center, Nijmegen, Netherlands, 4U. Coimbra, Coimbra, Portugal
Synopsis
Despite prior work, a direct comparison of the labeling of progenitor cardiac stem cells (CPCs) using protamine-sulphate (PS)-conjugated or FuGENE-labeled perfluorocarbon nanoparticle labels (based on their respective cellular uptake mechanisms), and their capacity to achieve direct cardiac 19FMRI on the same animal species, is still lacking. We report herein improved in vivo cardiac 19FMRI performance for FuGENE-labeled compared to PS-labeled CPCs.
Introduction
19F MRI of labeled stem cells following intra-cardiac injections has been successfully implemented in rodents with conjugated (protamine-sulphate (PS), NP1) [1] or non-conjugated (NP2) poly(lactic-glycolic-acid)-coated perfluorocarbon nanoparticles (PFC-NPs, NP2), primarily based on either PS-mediated endocytosis [2] or FuGENE-encapsulation and uptake [3]. However, a direct comparison of the labeling capacity of NP1/NP2 for achieving direct cardiac 19F MRI on the same animal species is still lacking. Therefore, the aim of this study is to compare the labeling capacities of NP1/NP2 in vitro, and in the mouse in vivo, based on 19F MRI of labeled cardiac progenitor cells (CPCs).Methods
Cell Isolation/Labeling: CPCs were isolated from adult, C57BL/6 mouse atria, and labeled using NP1 (1.5 mg/ml, U. Coimbra, Portugal) or NP2 (10 mg/ml, Atto647, Radboud U., Netherlands) for ~24 h, as described previously [3, 4]. To increase the label uptake, a successful electroporation protocol was implemented for NP1 into CPCs with a Gene Pulser Xcell electroporator (BIORAD, Hertfordshire, UK) using a rectangular pulse (amplitude 250 V, duration 5 ms), followed by NP1 incubation for ~1.5 h. In Vivo Cardiac/Post-mortem Skeletal Muscle Imaging: Two mice were injected with either NP1 (mixture of labeled/electroporated) or NP2-labeled CPCs (~3 and ~1×10⁶ CPCs) in femoral areas and imaged post-mortem. Another mouse was injected with NP2-labeled cells (~1.7-2×10⁶ CPCs) under 2% isoflurane (ISO) and 100% oxygen followed by in vivo 19F MRI. MRI/MRS: All experiments were conducted on a 9.4 T Agilent scanner (Agilent Technologies, USA) using a 40×20 mm2 butterfly (post-mortem, in vivo), and a homogeneous 5 (diameter) × 8 (length) mm2 solenoid (in vitro concentration comparisons and T1/T2 measurements). The broad frequency response of the coils allowed intermittent 1H/19F MRI/MRS. Phantom Studies: A phantom containing NP1 media solutions in Eppendorf vials at different concentrations (1-10 mg/ml) and a trifluoroacetic acid (TFA) solution (75mM) was studied (butterfly coil) using 1H/19F MRI/MRS (1H spoiled gradient echo (SPGR): repetition time (TR)/echo time (TE)=64.3/4/number of excitations (NEX)=6/flip angle=20°/slice thickness (ST)=5 mm/field-of-view (FOV)=40×40 mm2/bandwidth (BW)=100 kHz/19F MRI (2D-SPGR)/TR/TE=5.8-5.9/2.9ms/NEX=256/flip angle=50°/ST=5 mm/BW=6kHz; 19F MRS (pulse-acquire): TR=100ms/512 points/BW=15kHz/NEX=512), and the results were compared with NP2s, as reported previously [4]. Fluorine relaxation measurements (19F: Rd-NP solutions: NP1-labeled and electroporated-labeled CPCs), and 19F concentration measurements, were conducted using the homogeneous solenoid coil using pulse-acquire, inversion recovery (T1), or Carr-Purcell-Meiboom-Gill sequences (T2). In Vivo Cardiac/Post-mortem Skeletal 19F MRI: All studies used the butterfly coil. For the in vivo cardiac MRI, the mouse was anesthetized with 4% ISO and maintained and monitored for up to 95 min with 1.5–2.0% ISO in 100% oxygen. 1H Imaging: Double-gated, two-dimensional (2D) multislice, and ungated 2D/3D cardiac 1H images of the mouse thorax were acquired in vivo (2D: TR/TE=1.9-2.13/1-1.1 ms/flip angle=20-50°/NEX=2-6/FOV=40×40 mm2/matrix= 128×128/acquisition time=3-5 min; 3D: TR/TE=1.9-2.13/1-1.1 ms/flip angle=20-50°/NEX=2-6, FOV=40×40 mm2/ matrix= 128×128×128/acquisition time=3-5 min). 19F MRI/MRS: Ungated 19F image acquisitions matched 1H acquisitions (2D: TR/TE=16.5/8.3 ms/flip angle= 50°/NEX=768/FOV=40×40 mm2/1 slice/ST=5 mm/matrix=32×32/BW=2–4 kHz/acquisition time=2.42 min/and 8 phase encoding steps per segment; 3D: TR/TE=16.4/8.3 ms/flip angle=20-30°/NEX=12-72/FOV=40×40 mm2/matrix= 32×32×32/BW=1-3 kHz/acquisition time=3-6 min). Similar imaging parameters /protocols were used for post-mortem skeletal muscle imaging (NEX=2048 for NP1 and 48 for NP2). Image Processing: 19F images were imported and interpolated in ImageJ (NIH, Bethesda, USA) to match the 1H matrix size, and overlaid with 1H MRI (opacity=30-70%). Spectra were processed in CSX (Johns Hopkins, USA) or in IDL (Harris Geospatial, USA).Results
Fast acquisitions confirm detectability of NP1 solutions only at doses of 10 mg/ml (Fig. 1), while the concentration of the fluorine cell label is ~10-50 times smaller compared to NP2 (Fig. 2). Relaxation values are significantly shorter for NP1 (labeled and electroporated) compared to NP2 (T1, p<0.02 and p<0.03; T2, p<0.04), while electroporation leads to significant decreases in T2 values, thereby prohibiting their measurements (Fig. 2). Post-mortem skeletal muscle imaging of administered CPCs confirms visibility for both label types. However, cardiac 19F MRI visualization was only possible with NP2, despite successful injection protocols for both labels (Fig. 3).Discussion-Conclusion
We demonstrate improved cardiac 19F MRI performance for NP2 compared to NP1. The decreased relaxation times of NP1 elicit minor benefits for fast imaging acquisitions indicating that the differences in cardiac MRI visibility for the two labels are attributed to their 19F content or uptake mechanism. Increase of the fluorinated content of NP1 is envisaged to lead to comparable MRI visibility as that for NP2. Relaxation measurements for NP1 after the fluorine content is increased will explain whether the observed differences are owing to PFC content, or to PS-complexation and the cellular uptake process—compared to FuGENE-based encapsulation uptake for NP2.Acknowledgements
The work was supported by the European Union’s Horizon 2020 research and innovation programme under the Marie Sklodowska-Curie [grant agreement No. 652986], and the European Research Council Grant ERC-2013-StG-336454 (MS).References
1. Aday S, Paiva J, Sousa S, Gomes RSM, Pedreiro S, So PW, Carr CA, Cochlin L, Gomes AC, Paiva A, Ferreira L. Inflammatory modulation of stem cells by Magnetic Resonance Imaging (MRI)-detectable nanoparticles. RSC Advances 2014; 4:31706–31709.
2. Gomes RSM, das Neves RP, Cochlin L, Lima A, Carvalho R, Korpisalo P, Dragneva G, Turunen M, Liimatainen T, Clarke K, Yia-Herttuala, Carr C, Ferreira L. Efficient pro-survival/angiogenic miRNA delivery by an MRI-detectable nanomaterial. ACS Nano 2013; 7(4):3362–3372.
3. Constantinides C, McNeill E, Benson M, Urruela RS, Padilla S, Malandraki-Miller S, Maguire ML, Swider E, Ghaffari S, Carr CA, Srinivas M, Schneider JE. Improvements in the cellular uptake of perfluorocarbon nanoparticles and 19F MRS/MRI detectability using the transfection agent FuGENE. ISMRM Workshop on Molecular and Cellular MRI: Focus on Integration: Amsterdam, Netherlands, June 2016.
4. Constantinides C, Maguire ML, Malandraki-Miller S, Swider E, Srinivas M, Carr CA, Schneider JE. Fast, Quantitative 19F MRI: Optimized Imaging Strategies. ESMRMB 2016, Vienna, Austria, October 2016, #122.
Figures
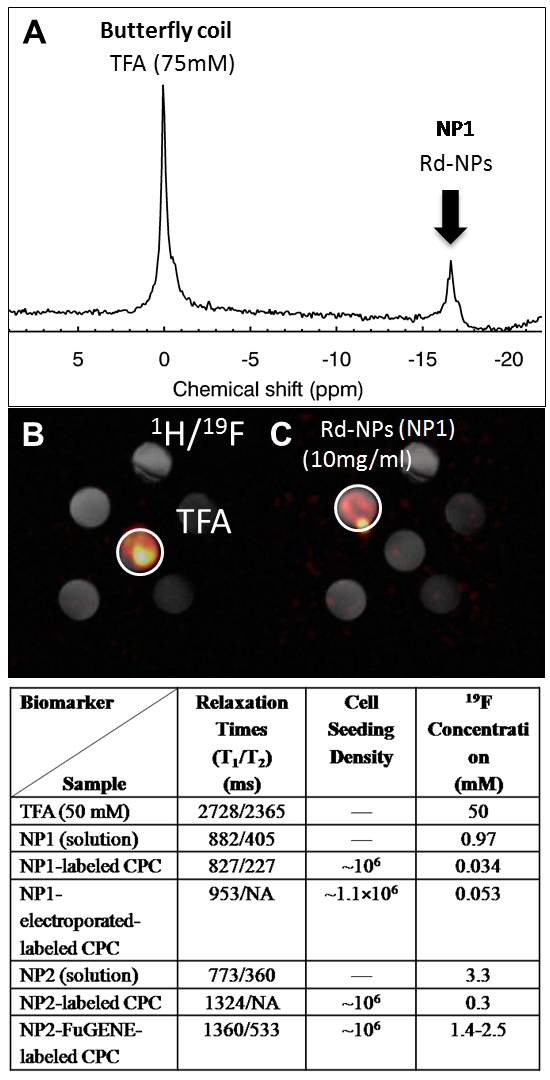
Figure 1: (A-C) 19F MRS of a multivial phantom containing a trifluoro-acetic acid (TFA) reference solution and NP1 solutions at different concentrations ranging from 1-10 mg/dl using the butterfly coil. (B, C) Dose optimization results from 1H/19F MRI indicating that the optimal dose for NP1 detection using a fast imaging acquisition protocol (3.2 min) is 10 mg/ml. Prior published phantom work with the same setup and similar imaging parameters using NP2 yielded detection doses of 2.5-10 mg/ml [4].
Table 1: 19F cell concentration/relaxation value comparisons (n=3) of NPs under different labeling regimes (simple, electroporation, FuGENE). Reported values for NP2 have been reported elsewhere [3, 4].
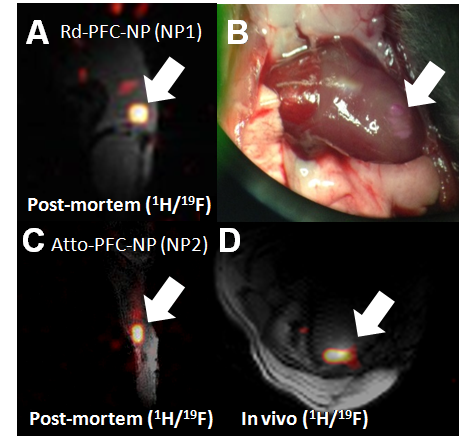
Figure 2: (A) Successful implementation of injection of ~3 million labeled CPCs (NP1) in the skeletal muscle of the post-mortem mouse. (B) Photograph showing successful injection of Rd-conjugated NP1s in the left-ventricular wall of the murine myocardium. Visualization of injected NP1s in the in vivo heart using 19F MRS/MRI was not successful (butterfly coil). (C) Corresponding 19F MRI of NP2 in the post-mortem skeletal muscle of the C57BL/6 mouse (~1 million CPCs), and (D) successful in vivo cardiac 19F MRI following injection of FuGENE-NP2-labeled CPCs (~1.72 million) with fast acquisition times (~5 min).