5023
Reducing T2-related bias in mq-BOLD derived maps of Oxygen Extraction Fraction by 3D acquisition1Department of Neuroradiology, Technical University of Munich, Munich, Germany, 2Department of Radiology & Biomedical Imaging, Yale University, New Haven, CT, United States, 3Philips Healthcare, Hamburg, Germany, 4Departement of Radiology, Technical University of Munich, Munich, Germany, 5School of Engineering & Applied Science, Yale University, New Haven, CT, United States, 6Clinic for Neurology, Technical University of Munich, Munich, Germany
Synopsis
Multi-parametric quantitative BOLD (mq-BOLD) measurements have been successfully applied in several studies to assess the vascular oxygenation, however, calculated relative Oxygen Extraction Fraction (rOEF) shows unphysiological systematic elevations. We suspect biased T2-measurements to be the main source of error. Therefore, we present an optimized 3D-GraSE T2-mapping sequence and its evaluation in four stages within phantoms, young healthy controls, elderly controls and internal carotid artery stenosis (ICAS) patients. We found significant T2-decreases, fully consistent with reference-values, and thereby significantly decreased rOEF-values by ~25 % towards physiologically more realistic values. Additional clinical value was demonstrated by detecting focal rOEF-increases in an ICAS-patient.
Purpose
The multi-parametric quantitative BOLD (mq-BOLD) approach is highly promising for assessing vascular oxygenation, revealing relative Oxygen Extraction Fraction (rOEF) maps.1,2 It requires three separate measurements of T2, T2* and relative Cerebral Blood Volume (rCBV) and has been successfully applied in several studies.3-6 However, rOEF-values tend to be systematically elevated due to biased T2-measurements.1 This work therefore focuses on improving T2-mapping for mq-BOLD-imaging by analyzing current method’s errors, optimizing the T2 imaging-sequence and evaluating the new sequence’s performance. Measurements were performed in four stages with phantoms, young healthy controls (YHC), elderly healthy controls (EHC) and internal carotid-artery stenosis (ICAS) patients.Methods
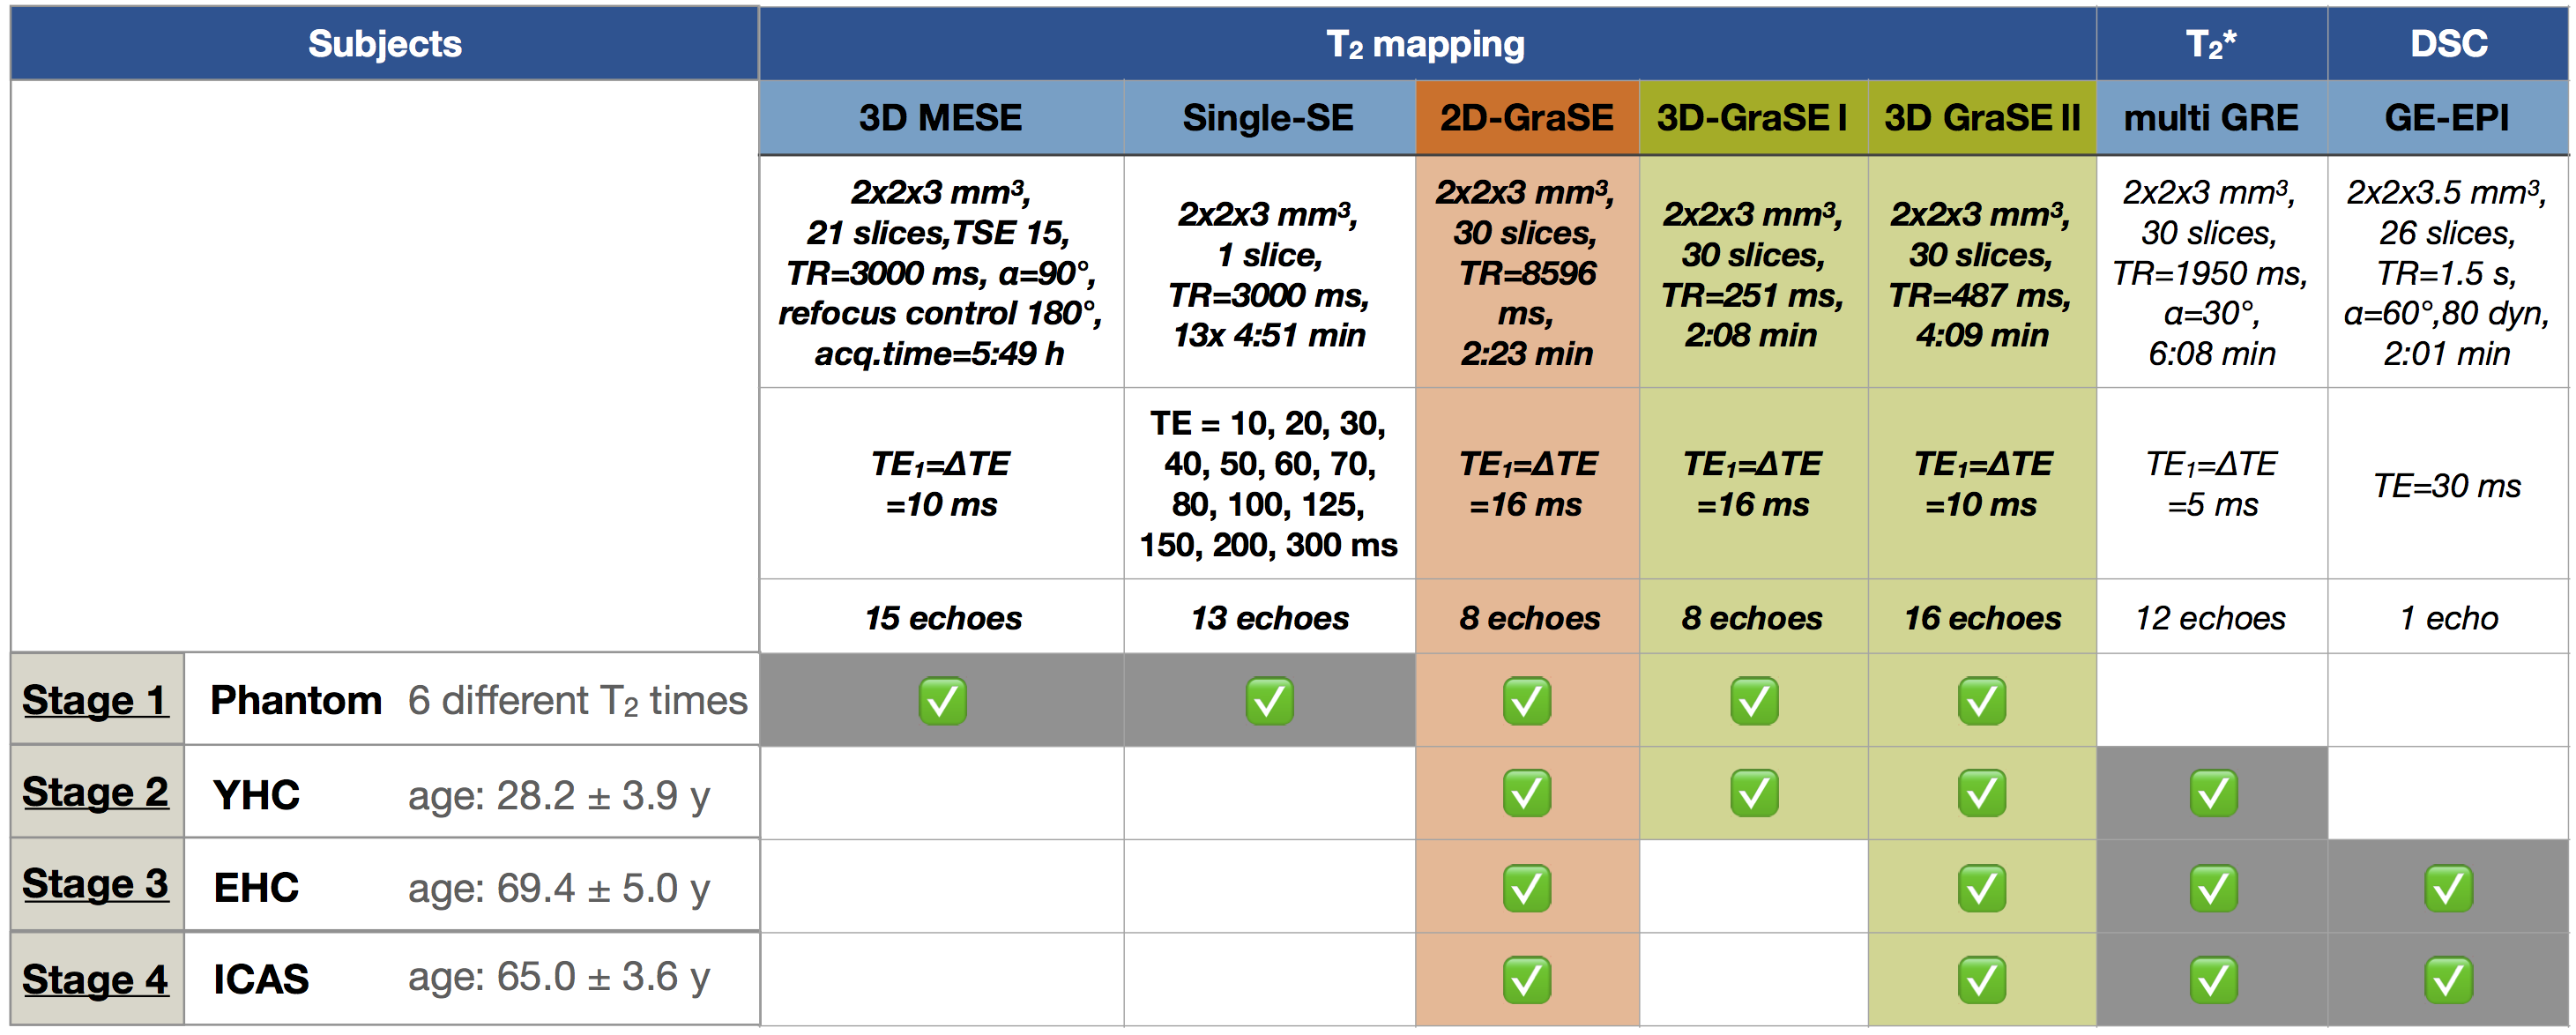
All measurements were performed on a clinical Philips 3T Ingenia MR-Scanner (Philips Healthcare, Best, Netherlands) using a 16ch head-neck-coil. An overview of the applied imaging sequences and their parameters is given in Fig.1. For T2-mapping, a 2D multi-echo GraSE-sequence (8 echoes, ∆TE$$$\,$$$=$$$\,$$$16$$$\,$$$ms, stimulated echo reduction by even-echo fitting) was originally employed for rOEF-mapping.1 We optimized two 3D multi-echo GraSE sequences for T2-mapping with either 8 echoes and ∆TE$$$\,$$$=$$$\,$$$16$$$\,$$$ms (3D-GraSE-I) or 16 echoes and ∆TE$$$\,$$$=$$$\,$$$10$$$\,$$$ms (3D-GraSE-II). Fit-reliability was assessed by voxelwise fitting-error mapping using the relative sum of fit-deviations averaged per echo. To facilitate artefact recognition, artefact-maps were generated by applying empirical thresholds: Either R2’$$$\,$$$>$$$\,$$$18, FitError(T2)$$$\,$$$>$$$\,$$$10 or FitError(T2*)$$$\,$$$>$$$\,$$$4. For experimental evaluations, first, all T2-mapping sequences were compared to 3D-MESE and single-SE in a phantom consisting of six vessels with different agarose gel and Gd-DTPA concentrations featuring typical cerebral T2-relaxation times. Second, all T2-mapping sequences were compared in-vivo in 10 YHC (age: 28.2±3.9$$$\,$$$y) with additional T2*-mapping for R2’ evaluation $$$\left( R_2’=\frac{1}{T_2^*}-\frac{1}{T_2}\right)$$$. Third, DSC-MRI7 was additionally acquired in seven EHC (age: 69.4±5.0$$$\,$$$y) to evaluate the influence of T2-mapping on rOEF following the mq-BOLD approach: $$rOEF=\frac{R_2’}{c\cdot rCBV}$$ with $$$c=\gamma\cdot \frac{4}{3}\cdot \pi\cdot \Delta\chi\cdot B_0$$$.1 Fourth, T2-mapping induced rOEF-differences were evaluated in 3 patients (age: 65.0±3.6$$$\,$$$y, asymptomatic unilateral high-grade ICAS, NASCET$$$\,$$$>$$$\,$$$70$$$\,$$$%). All in-vivo imaging included FLAIR and MP-RAGE for tissue-segmentation (PGM>0.95 & PWM>0.95). Images were post-processed with SPM128 and custom Matlab9 programs.Results
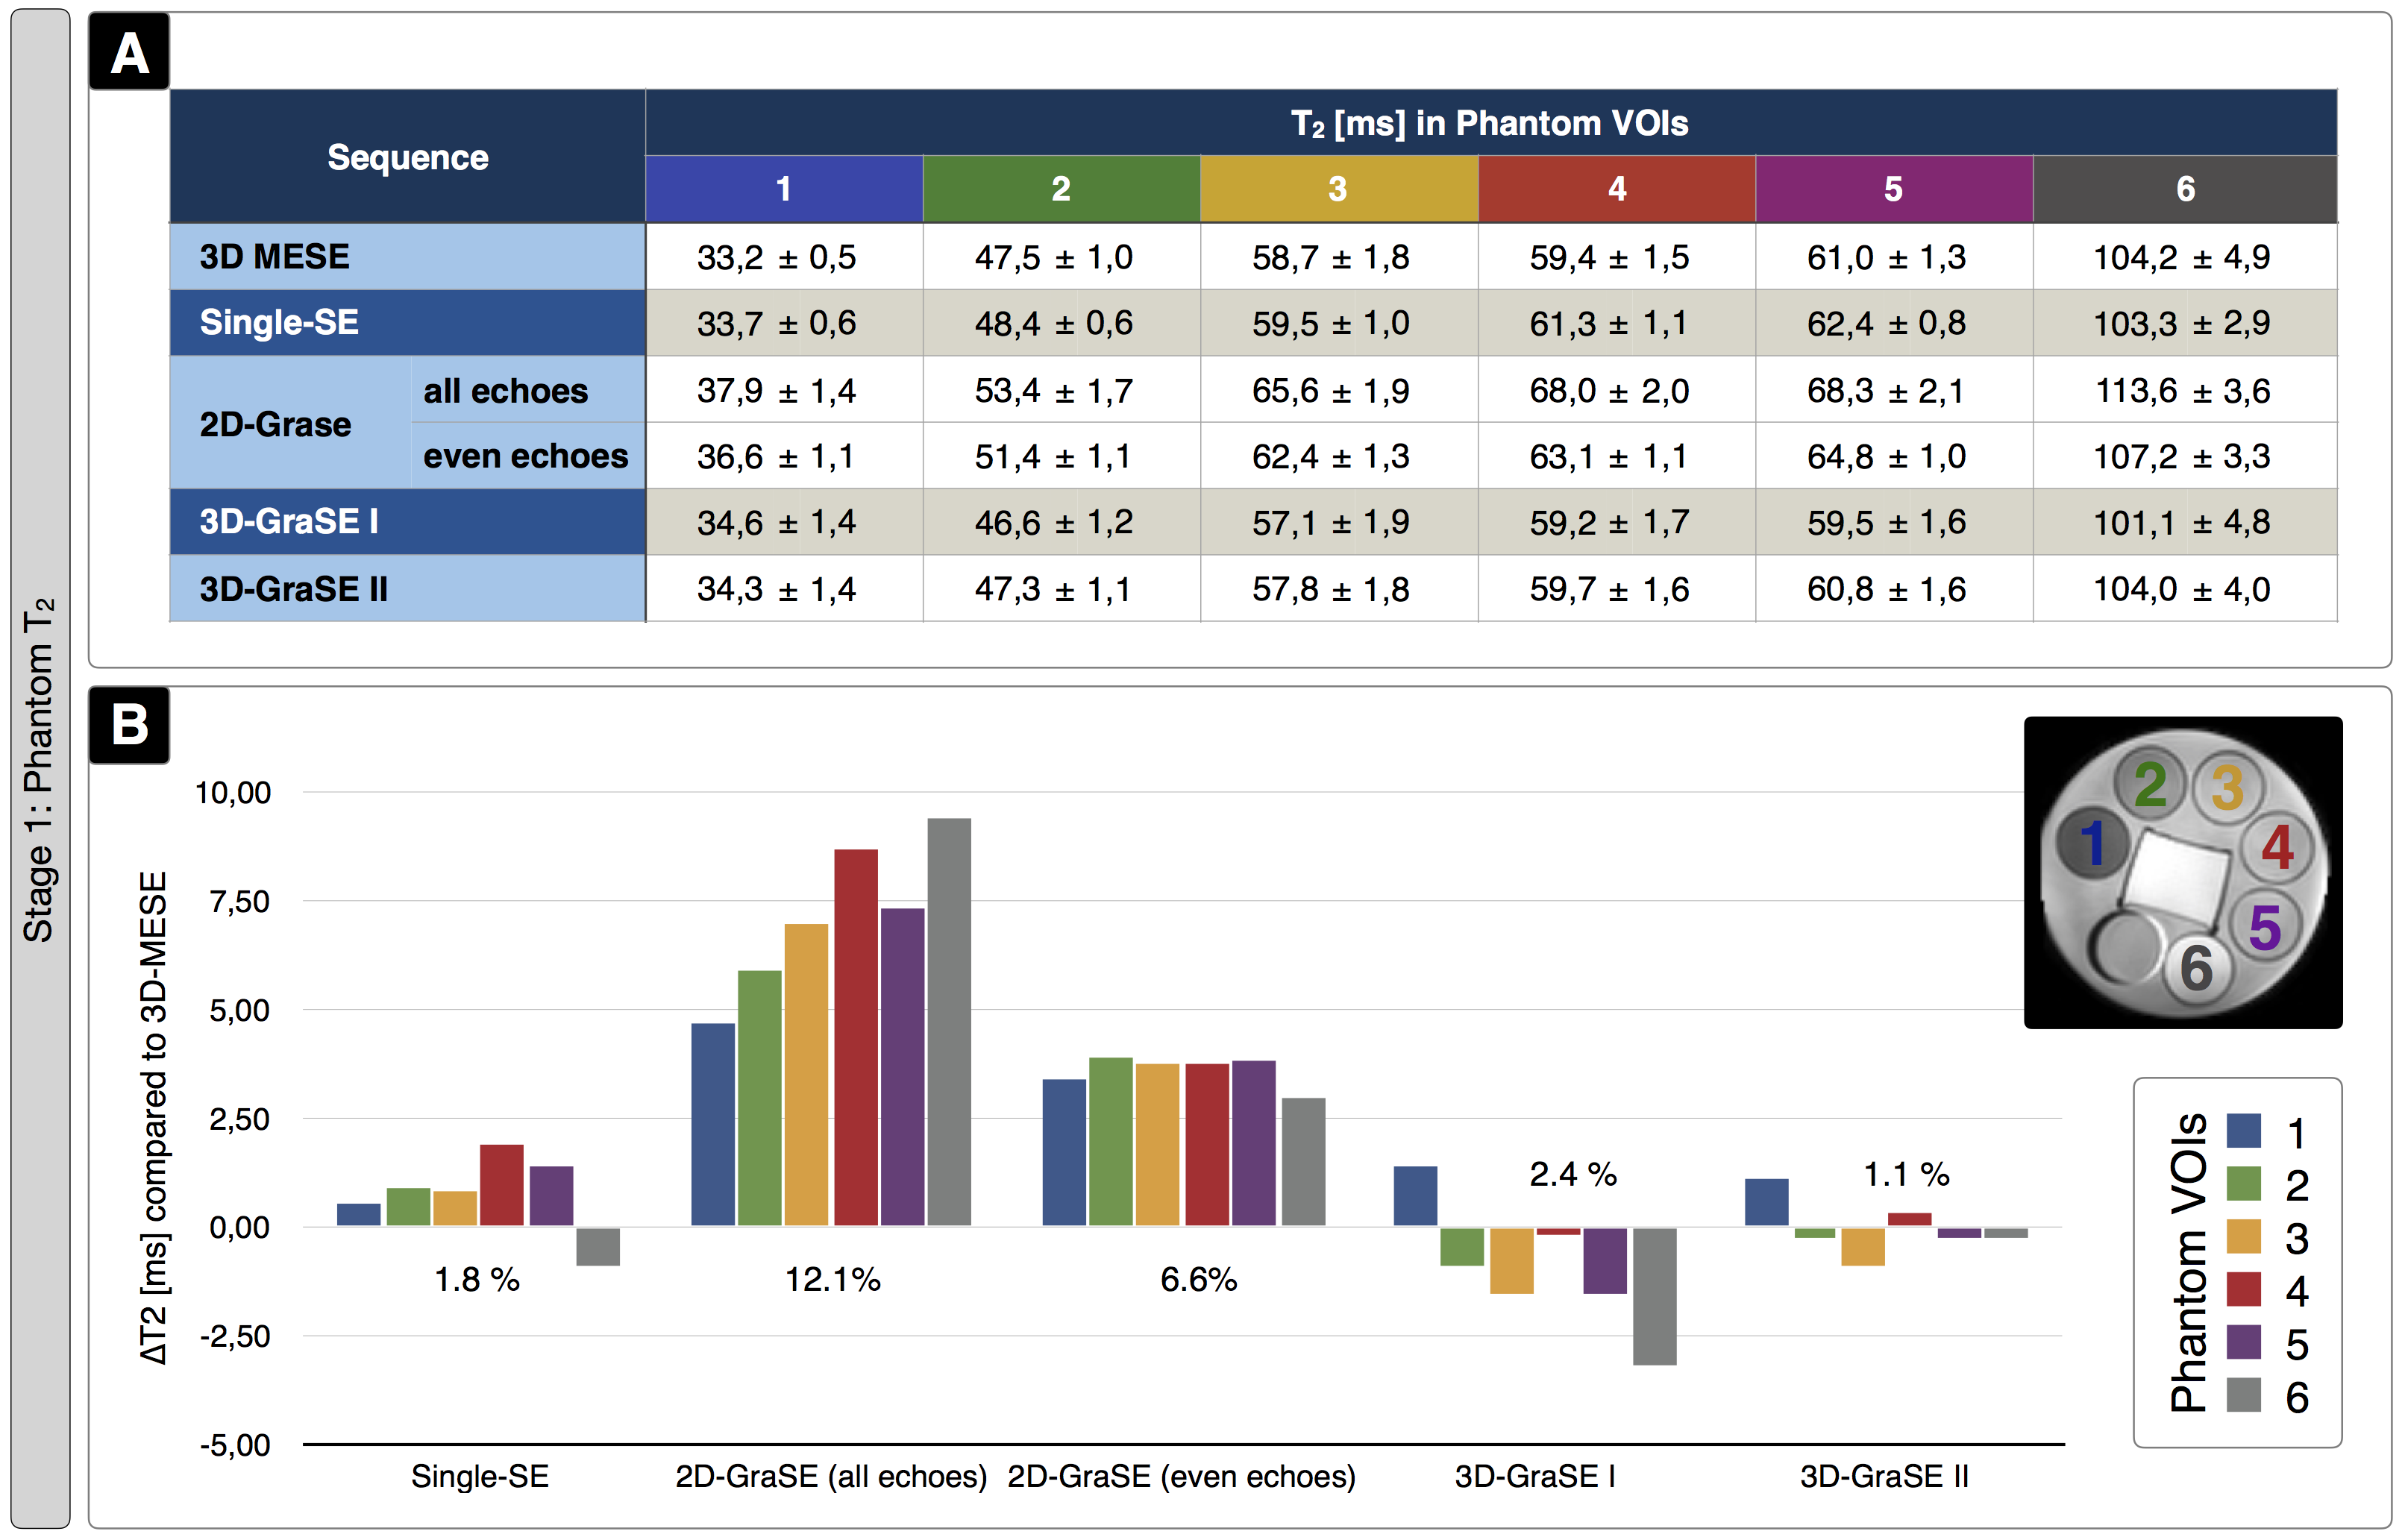
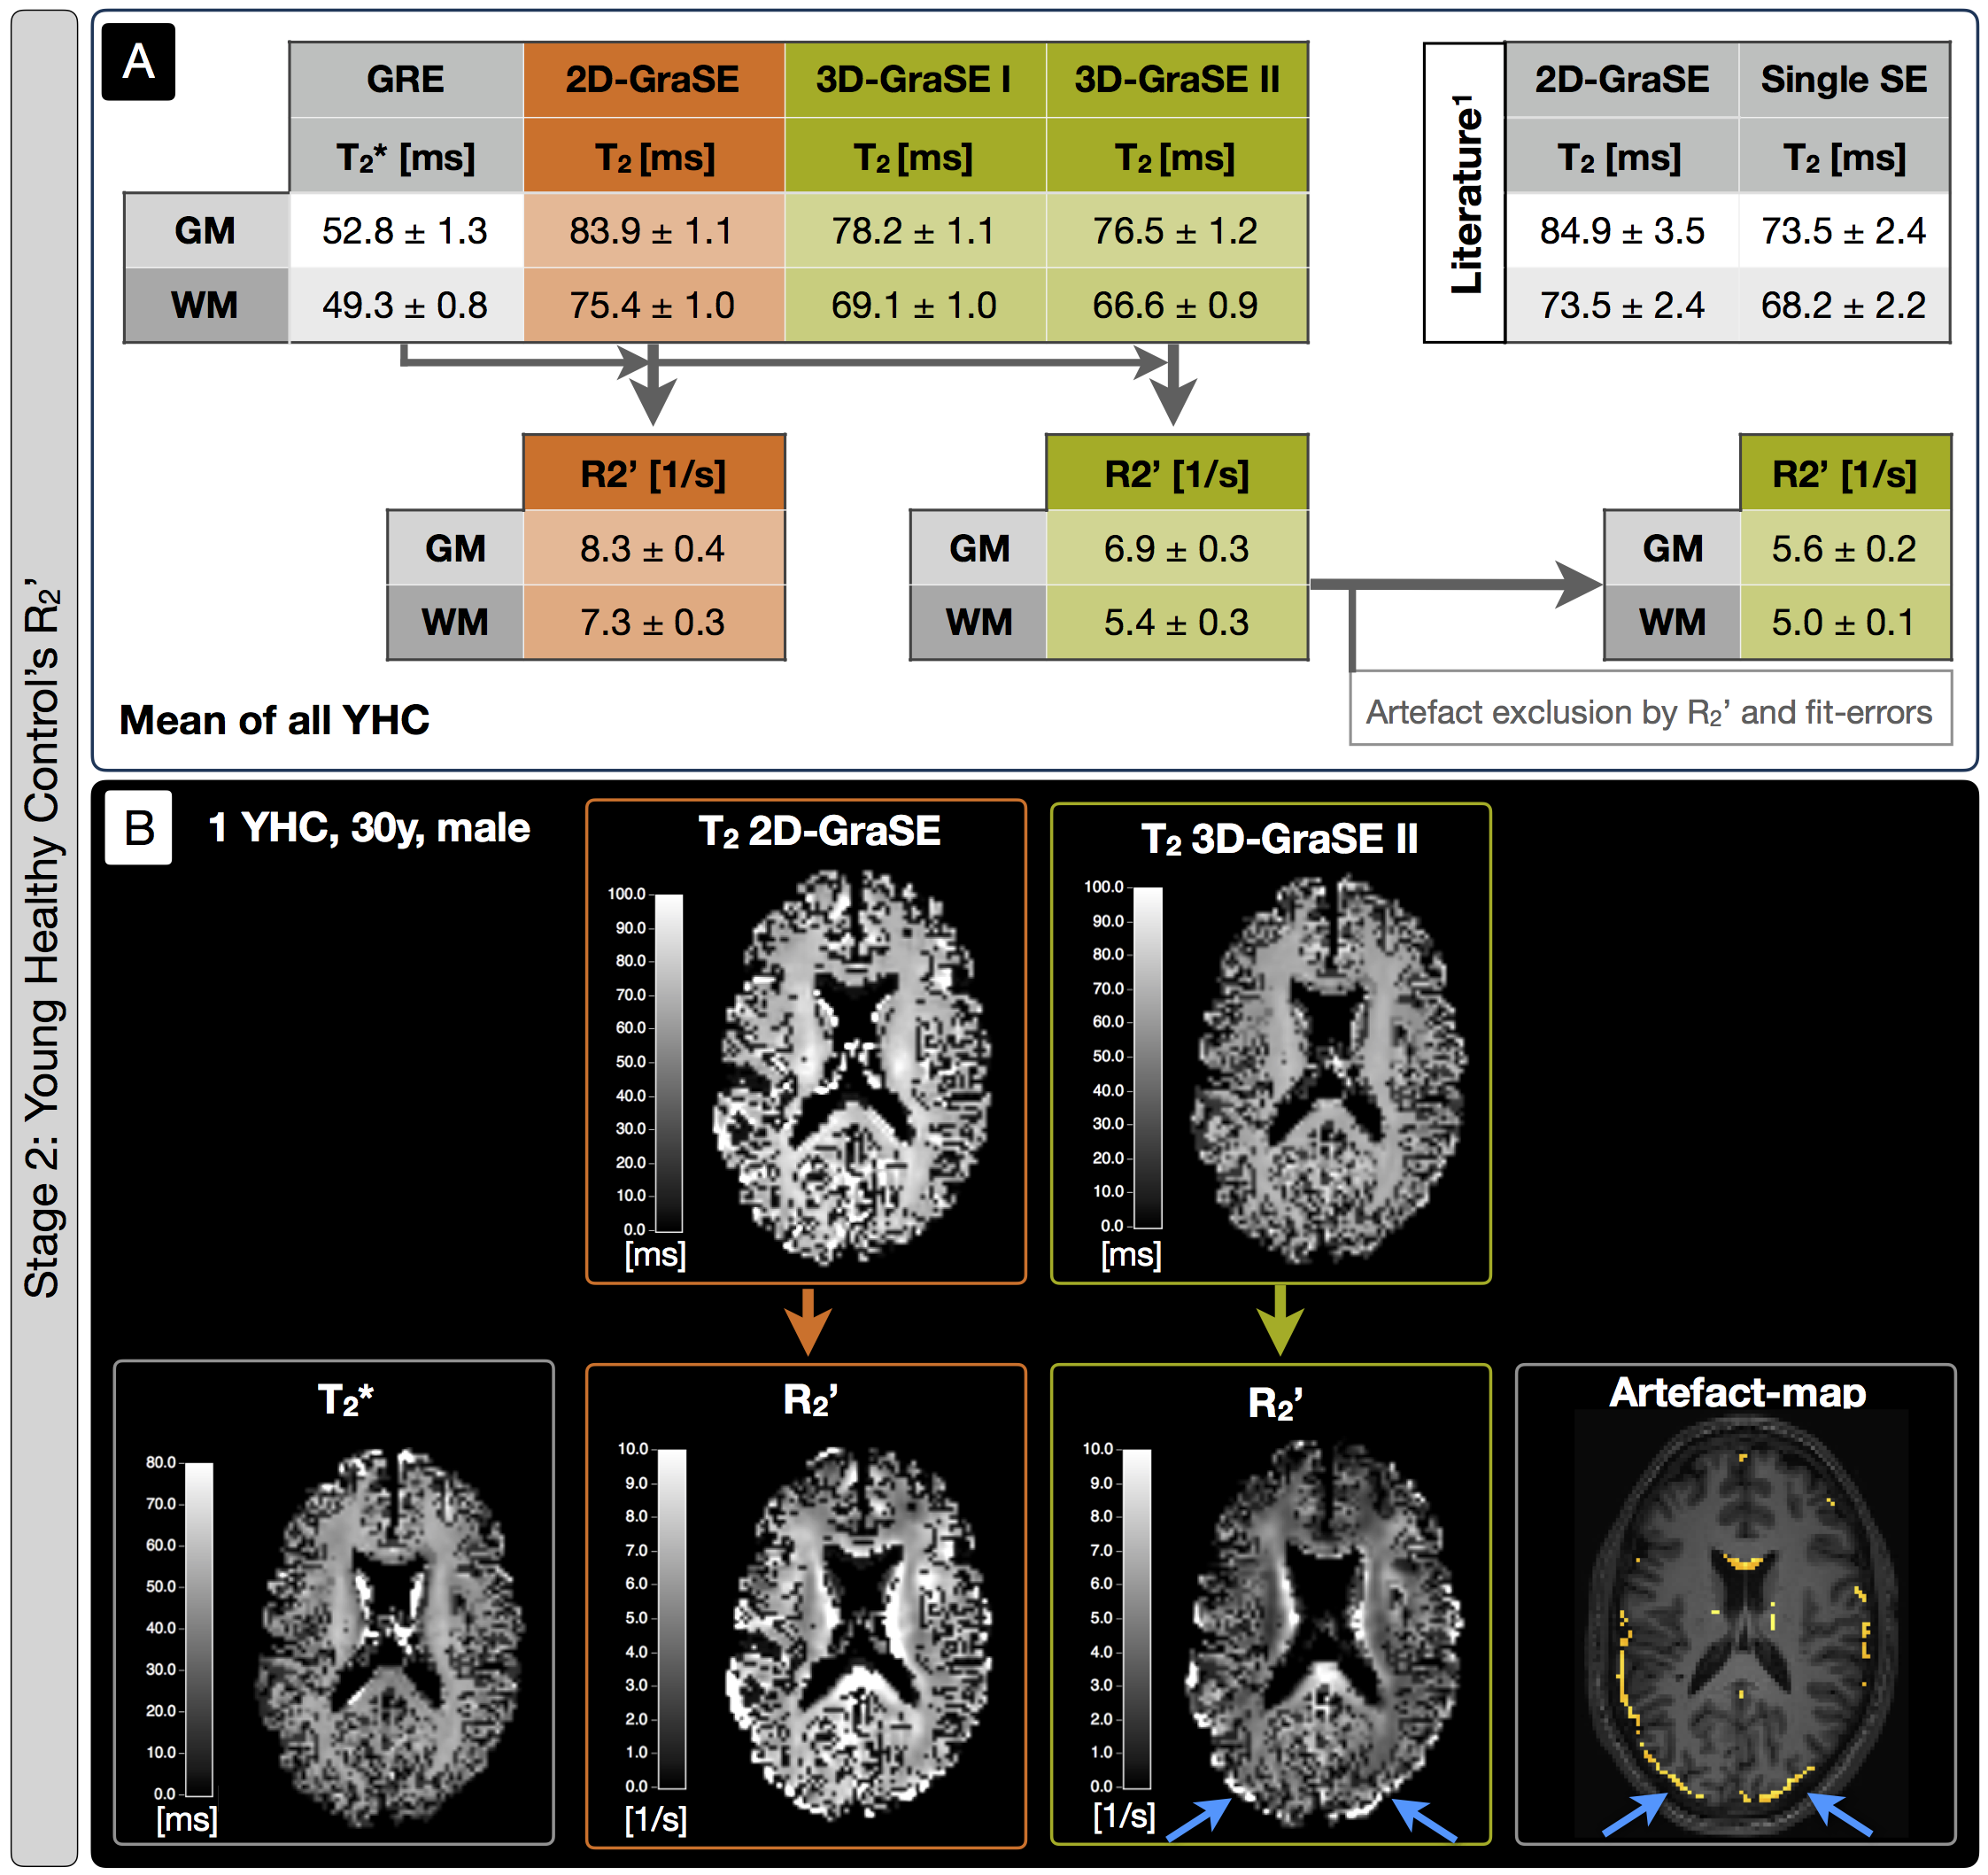
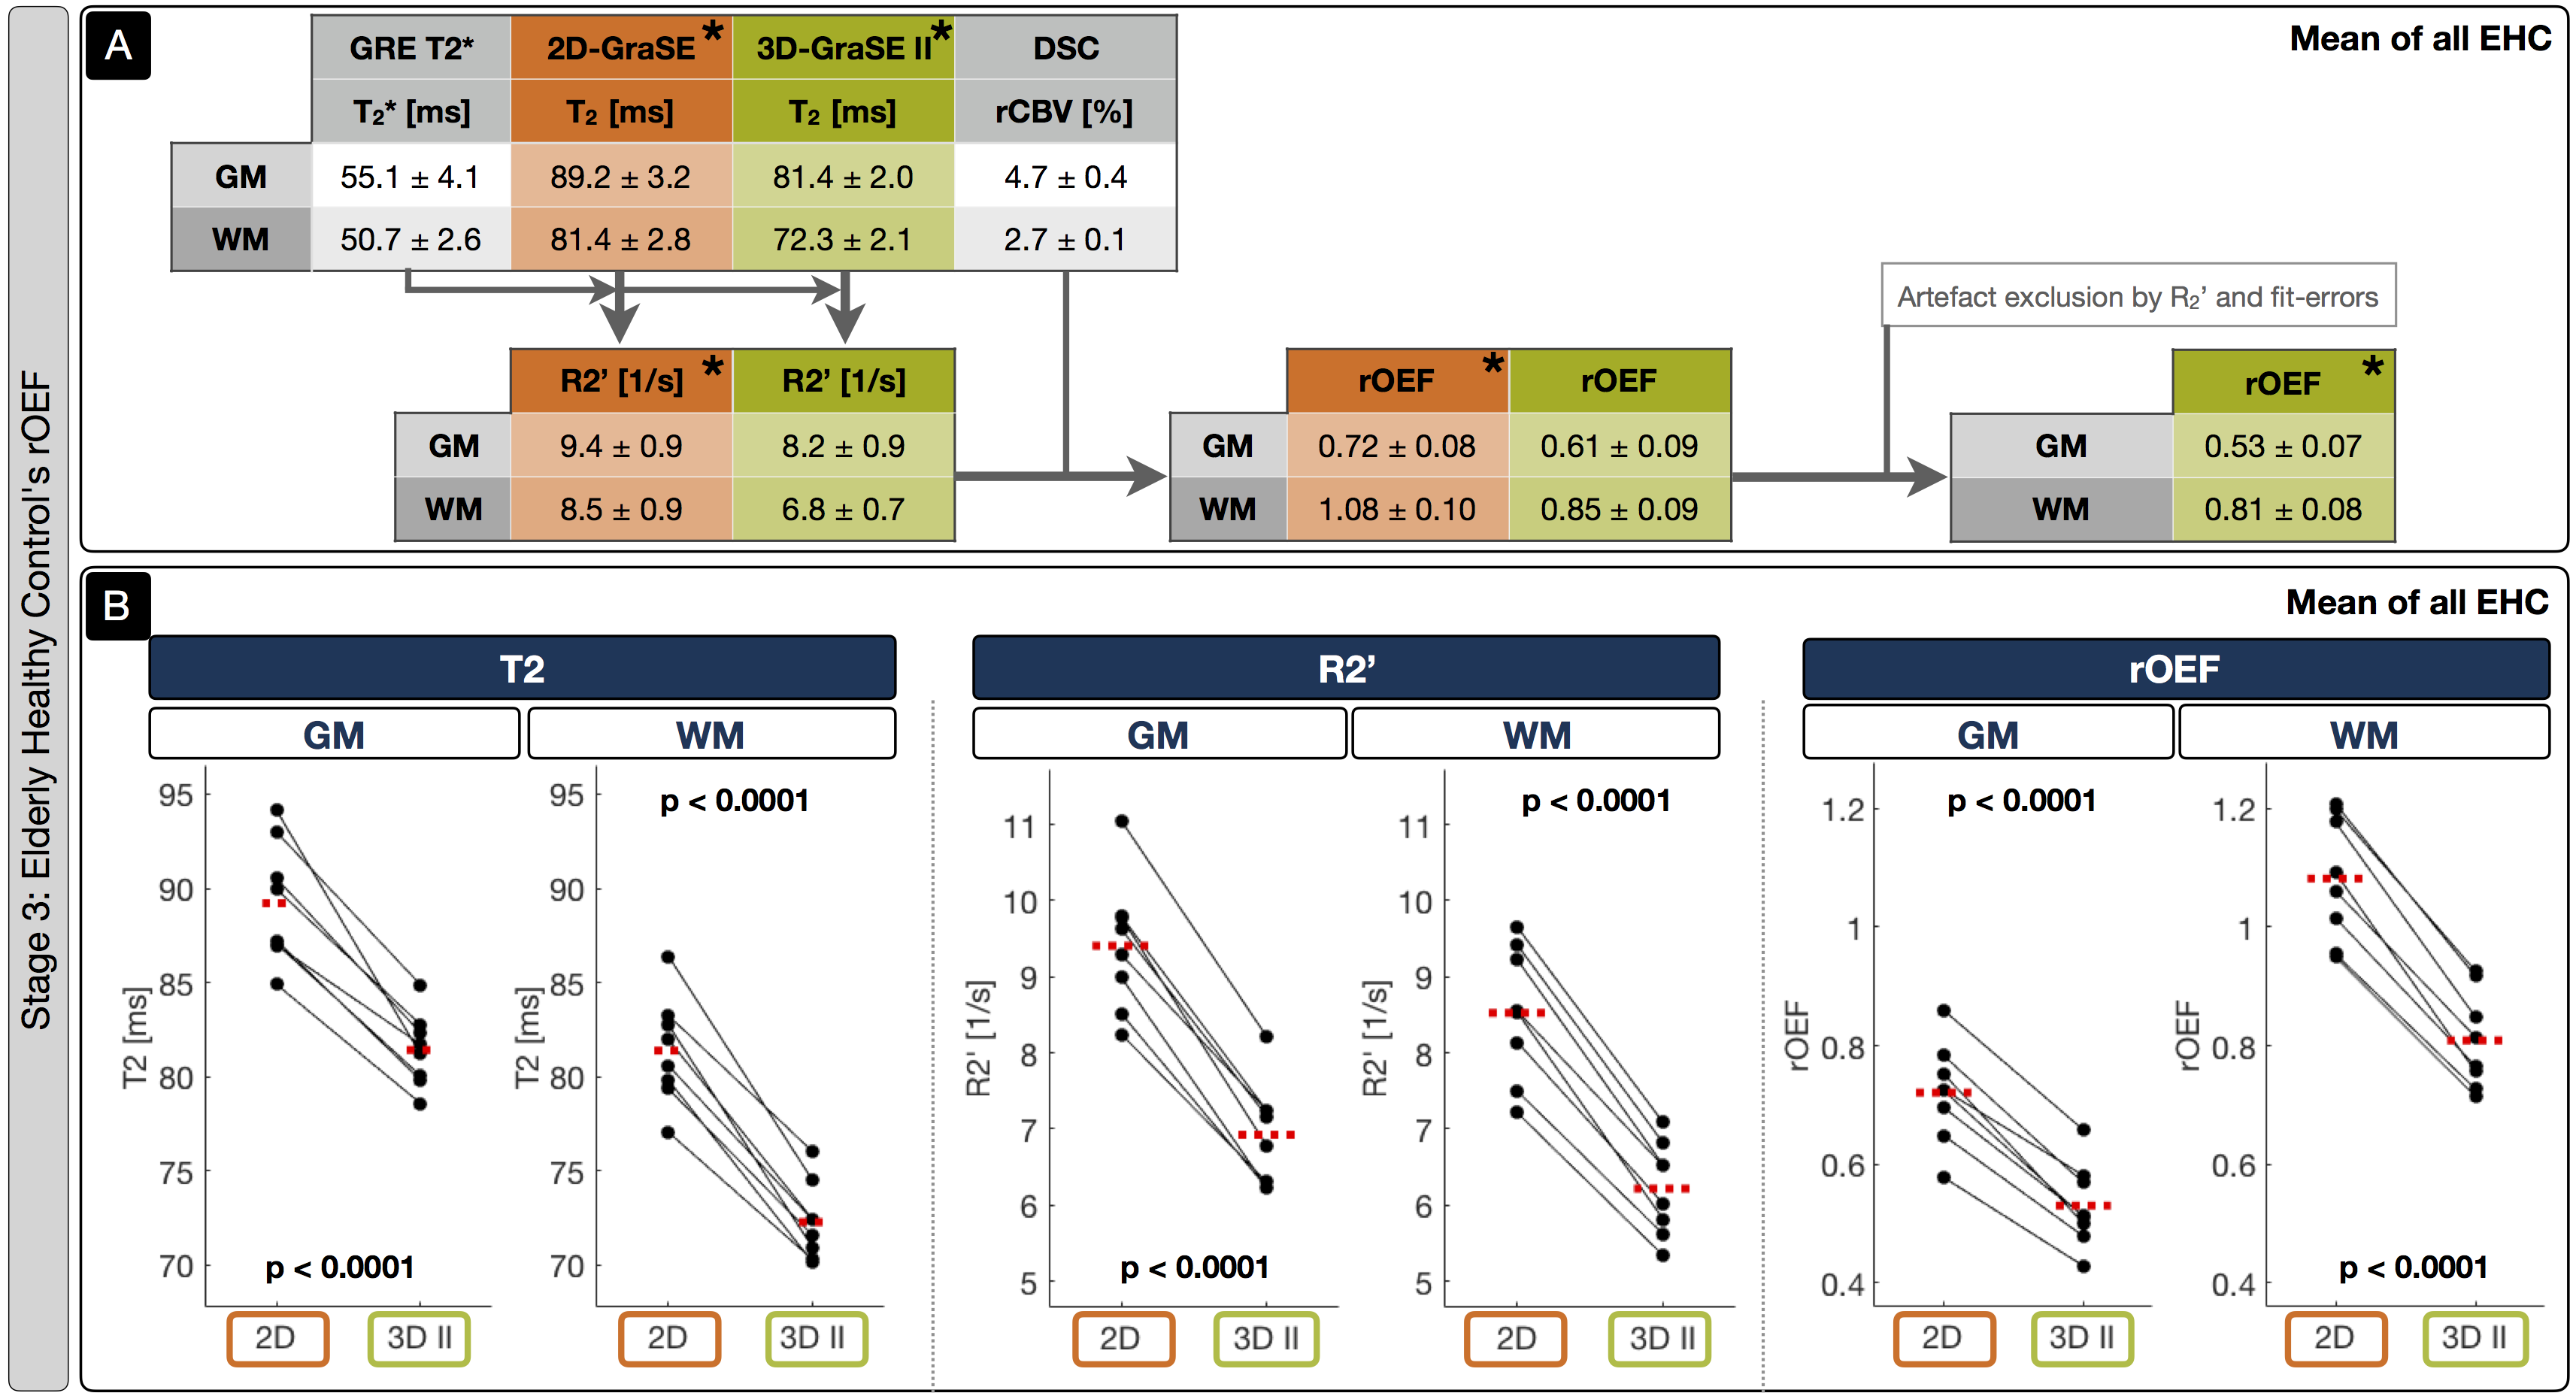
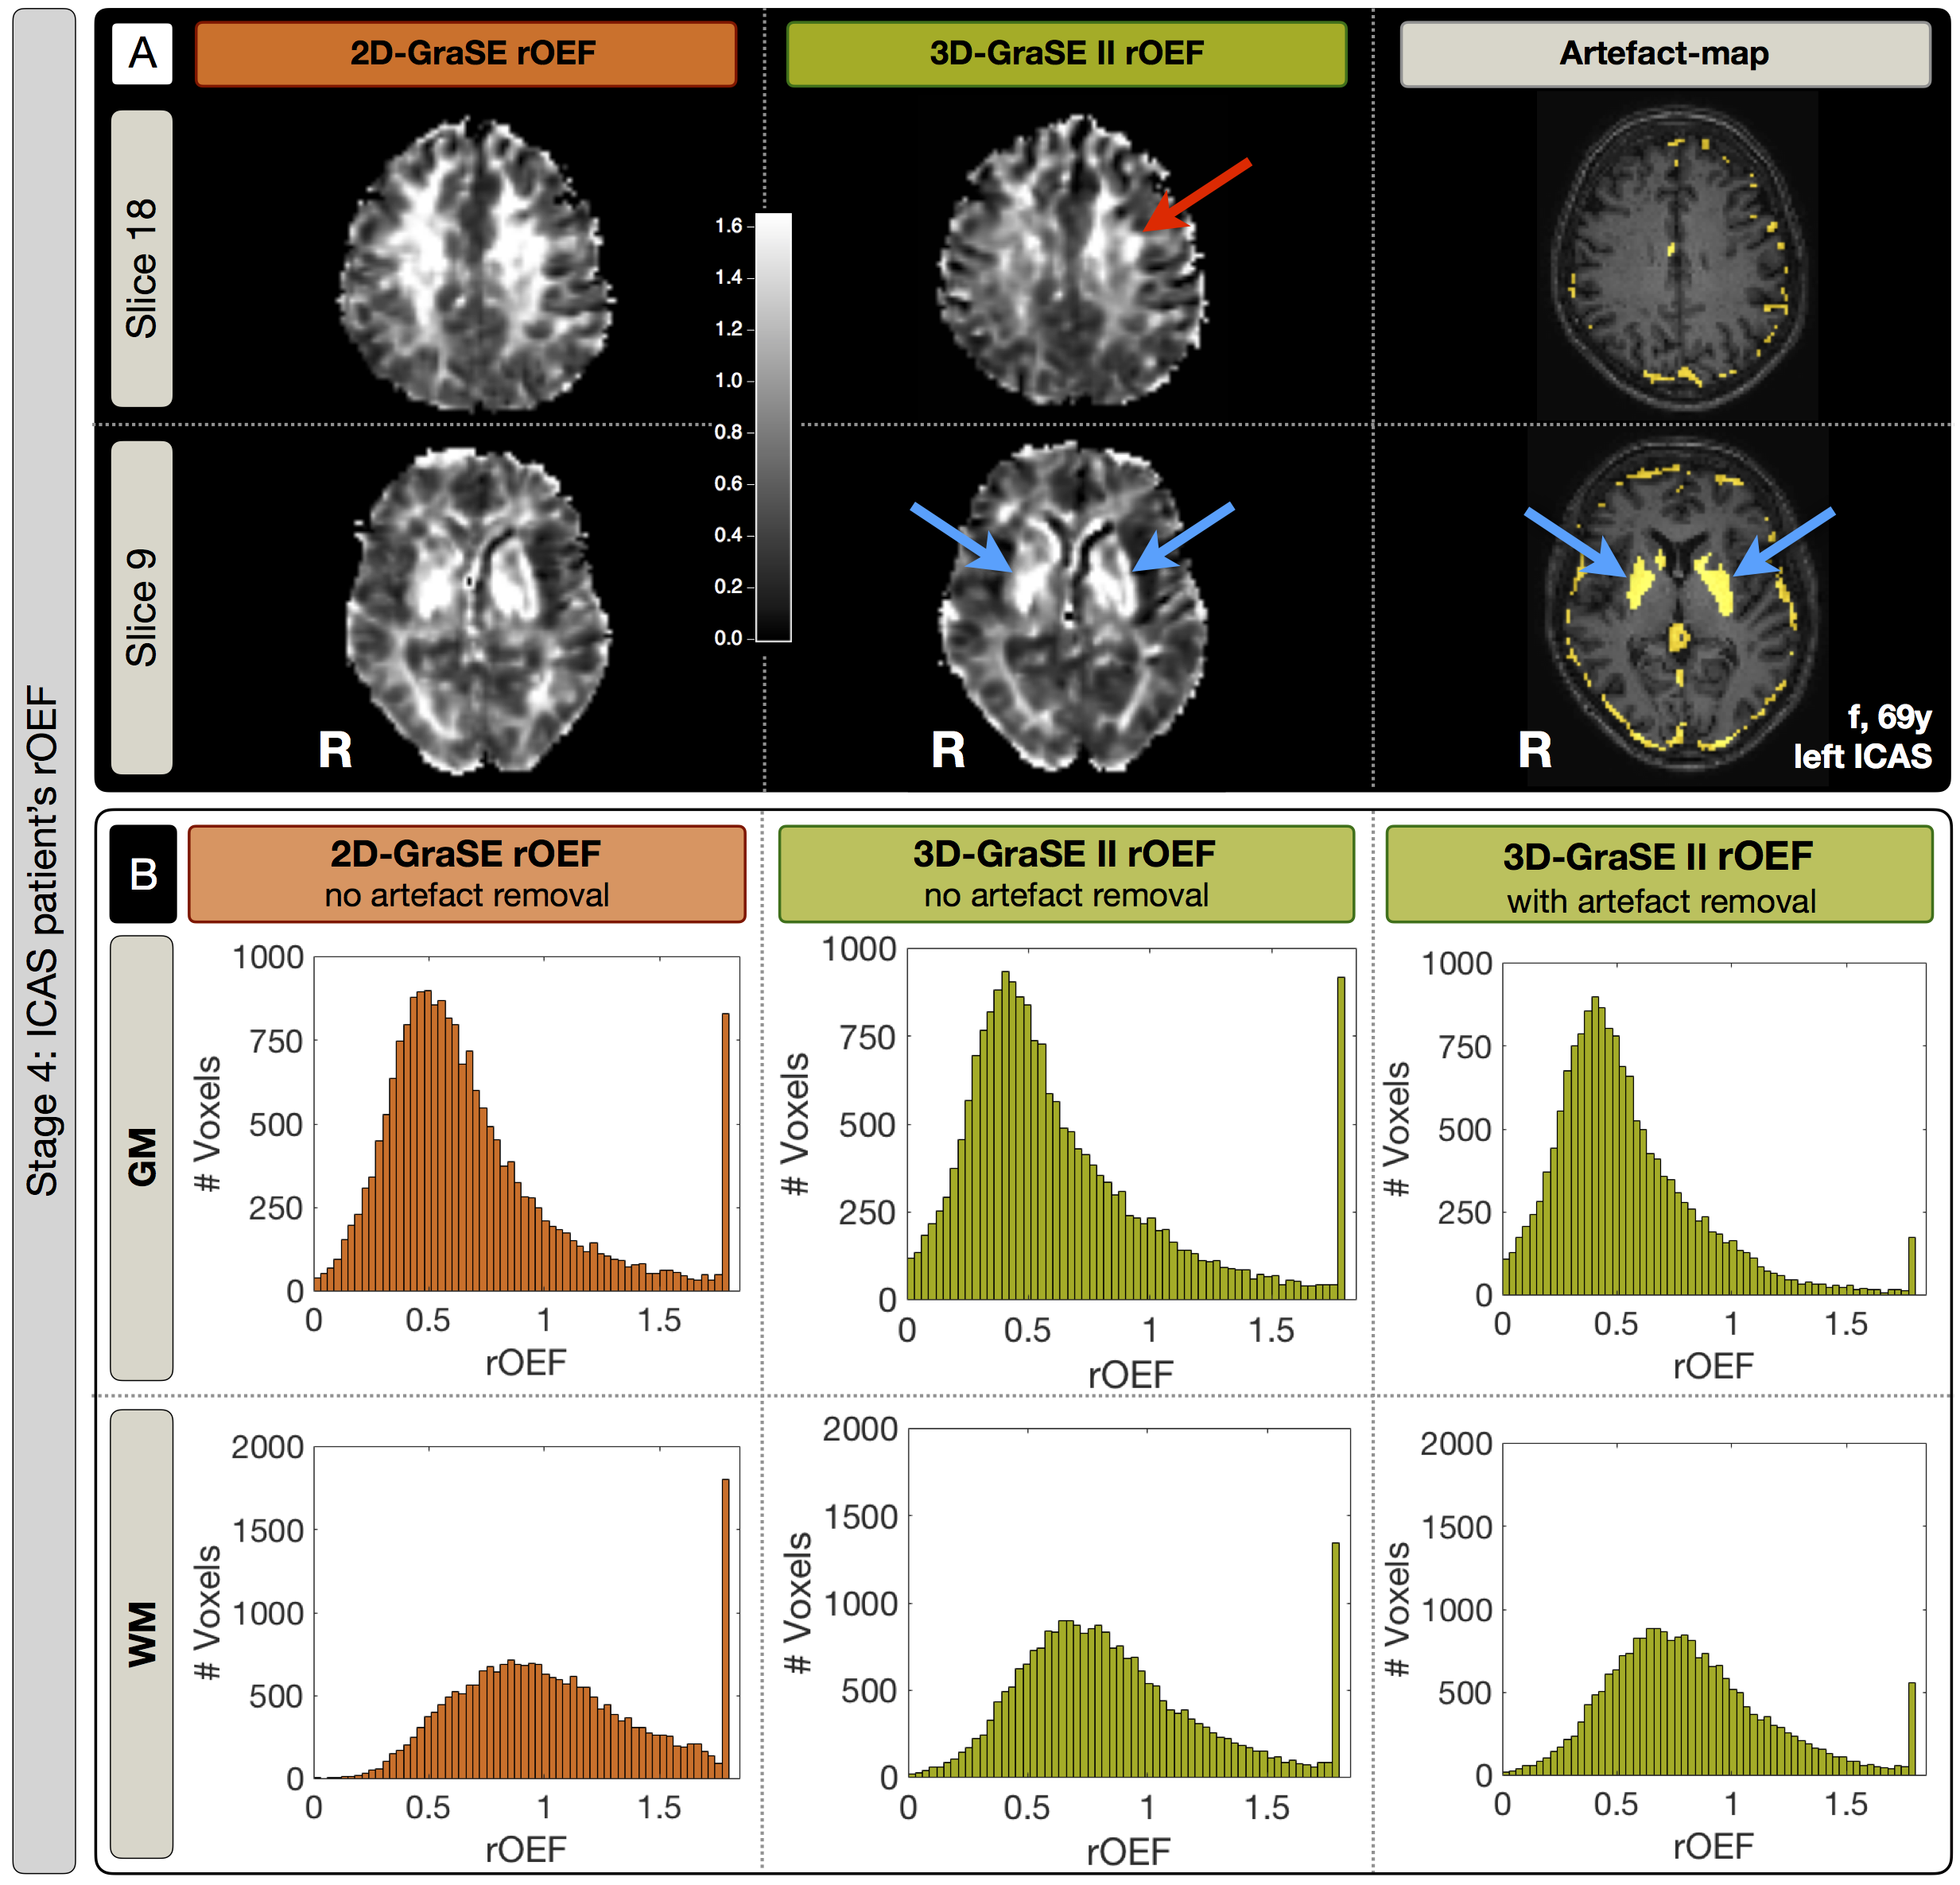
Sequence comparisons in the phantom yielded relaxation times between T2$$$\,$$$=$$$\,$$$33-104$$$\,$$$ms for 3D-MESE, which we regarded as reference-values (Fig.2). In comparison, the original 2D-GraSE sequence showed systematic T2-elevations (average: 12.1%), which could be reduced by even echo fitting (6.6%) as reported previously.1 3D-GraSE-I deviated from the reference by 2.4% and 3D-GraSE-II by 1.1%. In YHC, the original 2D-GraSE yielded mean-values of T2,GM$$$\,$$$=$$$\,$$$83.9$$$\,$$$ms and T2,WM$$$\,$$$=$$$\,$$$75.4$$$\,$$$ms (Fig.3). The new 3D-GraSE-I and 3D-GraSE-II revealed T2,GM$$$\,$$$=$$$\,$$$78.2/76.5$$$\,$$$ms, T2,WM$$$\,$$$=$$$\,$$$69.1/66.6$$$\,$$$ms. Resulting 3D-GraSE-II-based R2’ was reduced by -16.9% in GM and -26.0% in WM compared to 2D-GraSE. With additional artefact exclusion, R2’ was decreased in total by -32.5% in GM and -31,5% in WM. In EHC, T2-mapping showed the same trend of decreased T2 and R2’-values by the new 3D-GraSE-II compared to 2D-Grase (Fig.4). Analysis of rOEF with 2D-GraSE based T2-maps yielded: rOEFGM$$$\,$$$=$$$\,$$$0.72$$$\,$$$±$$$\,$$$0.08 and rOEFWM$$$\,$$$=$$$\,$$$1.08$$$\,$$$±$$$\,$$$0.10. By applying 3D-GraSE-II based T2 and removing artefact voxels, rOEF was decreased by ~25% resulting in rOEFGM$$$\,$$$=$$$\,$$$0.53$$$\,$$$±$$$\,$$$0.07 and rOEFWM$$$\,$$$=$$$\,$$$0.81$$$\,$$$±$$$\,$$$0.08. Results in ICAS-patients likewise reveal rOEF-value decreases by 3D-GraSE-II compared to 2D-Grase (Fig.5). Histogram analysis of the artefact-corrected 3D-GraSE-II data demonstrated rOEF-shifts towards lower values and reduction of artefact-related clipped peak values (-74.4%). Interestingly, clear rOEF hyperintensities ipsilateral to the stenosis appear only with 3D-GraSE-II based T2-mapping (Fig.5A).Discussion
Previously observed T2-elevations with 2D-GraSE could be replicated in all four experimental stages.1 3D-Grase-II yielded best results in phantom and YHC scans, fully consistent with reference values.1 We explain the excellent performance of 3D-GraSE-II by elimination of slice excitation profile related artefacts, higher sampling rate (4 echoes$$$\,\to\,$$$16 echoes) and the longer echo train (128 ms$$$\,\to\,$$$160 ms). Due to decreased T2, we measured lowered R2’-values with 3D-Grase-II in YHC, EHC and ICAS-patients. Consequently, rOEF was significantly decreased in EHC and ICAS-patients yielding physiologically more reasonable rOEF-values. In spite of restrictive tissue segmentation (PGM>0.95 & PWM>0.95), assessment of artefact-maps still suggested strong influence of CSF partial volume effects and iron deposition. Besides clearly improving the reliability of mq-BOLD, the new 3D-GraSE-II sequence additionally seems to increase the sensitivity to detect focal rOEF-changes (Fig.5A).Conclusion
Our results demonstrate successful implementation of the 3D-GraSE-II sequence, which yields T2-values in agreement with reference measurements within reasonable scan time. Previously observed systematical rOEF-elevations could be significantly reduced. Thereby, the reliability of mq-BOLD was greatly improved. Additionally, 3D-GraSE-II allowed to detect a focal ICAS-related rOEF-increase. The proposed artefact-voxel detection by R2’-maps and fit-errors further improved the method. However, artefact-analysis also highlights remaining bias due to CSF partial-volume-effects, suggesting future CSF-suppression to further improve mq-BOLD based rOEF-imaging. Further validation of improved mq-BOLD derived rOEF could be performed by comparison to a reference measurement.
Acknowledgements
The authors acknowledge support by the Friedrich-Ebert-Stiftung and Dr.-Ing. Leonhard-Lorenz-Stiftung.References
1: Hirsch NM, Zimmer C & Preibisch C et al (2014). „Technical considerations on the validity of blood oxygenation level-dependent-based MR assessment of vascular deoxygenation.“ NMR Biomed, 27: 853-862.
2: Christen T, Schmiedeskamp H, Zaharchuk G et al (2012). „Measuring brain oxygenation in humans using a multiparametric quantitative blood oxygenation level dependent MRI approach.“ MRM 68(3): 905-911.
3: Preibisch C, Shi K, Kluge A, Lukas M, Wiestler B, Gottler J, Gempt J, RingelF , Jaberi MA, Schlegel J, Meyer B, Zimmer C, Pyka T and Forster S (2017). “Characterizing hypoxia in human glioma: A simultaneous multimodal MRI and PET study.” NMR Biomed 30(11).
4: Toth V, Forschler A, Hirsch NM, den Hollander J, Kooijman H, Gempt J, Ringel F, Schlegel J, Zimmer C & Preibisch C (2013). „MR-based hypoxia measures in human glioma.“ J Neurooncol, 115: 197-207.
5: Gersing AS, Ankenbrank M, Preibisch C et al (2015). „Mapping of cerebral metabolic rate of oxygen using dynamic susceptibility contrast and blood oxygen level dependent MR imaging in acute ischemic stroke.“ Neuroradiology 57(12): 1253-1261.
6: Bouvier J, Detante O, Tahon F, et al (2015). „Reduced CMRO2 and cerebrovascular reserve in patients with severe intracranial arterial stenosis: A combined multiparametric qBOLD oxygenation and BOLD fMRI study.“ Human Brain Mapping 36(2) 695-706.
7: Kluge A, Lukas M, Preibisch C et al (2016). „Analysis of three leakage-correction methods for DSC-based measurement of relative cerebral blood volume with respect to heterogeneity in human gliomas.“ MRI 34(4): 410-421.
8: SPM12: Statistical Parametric Mapping software (SPM12) Version 6225: www.fil.ion.ucl.ac.uk/spm.
9: MATLAB and Statistics Toolbox Release 2013a, The MathWorks, Inc., Natick, Massachusetts, United States.
10: Vinci software, Max-Planck-Institut für neurologische Forschung, Cologne, Germany: http://www.nf.mpg.de/vinci3/. Assessed 09.Nov 2015.
11: Bai R, Koay C, Hutchinson E, Basser PJ (2014). "A framework for accurate determination of the T(2) distribution from multiple echo magnitude MRI images." Journal of magnetic resonance (San Diego, Calif. : 1997) 244: 53-63.
Figures