5020
Phenols as Diamagnetic T2-exchange Magnetic Resonance Imaging Contrast Agents1Department of Radiology and Radiological Science, Johns Hopkins University, School of Medicine, Baltimore, MD, United States, 2Department of Biomedical Engineering, Johns Hopkins University, Baltimore, MD, United States, 3F.M. Kirby Research Center for Functional Brain Imaging, Kennedy Krieger Institute, Baltimore, MD, United States, 4Department of Nuclear Medicine, Peking University First Hospital, Beijing, China
Synopsis
To further explore the ability
Purpose
T2-exchange (T2ex) NMR phenomena have been known for decades, yet recently there is a resurgence of interest to develop T2ex MRI contrast agents1,2.The purpose of current study is to characterize the T2ex contrast of phenols. To optimize the T2ex contrast through chemical modification, we designed and screened a library of phenol-based compounds, which can be used as a guide for developing endogenous and exogenous phenol-based T2ex MRI contrast agents.Methods
Aqueous solutions of each compound were prepared prior to each MRI measurements either in water or phosphate buffered saline. Unless otherwise noted, all MRI measurements were performed at 37 oC using a Bruker 9.4 T vertical MR scanner with a 20-mm birdcage transmit/receive coil. T2 relaxation times were acquired using a Carr-Purcell-Meiboom-Gill (CPMG) method as previously described3. Briefly, a T2 preparation module, with 16 echo times ranging from 20 ms to 10.24 s, was added in the front of a Rapid Acquisition with Relaxation Enhancement (RARE) pulse sequence. The imaging parameters were: TR/TE = 25000/4.3 ms, RARE factor = 16, a 64x64 acquisition matrix with a spatial resolution of c.a. 250x250 µm2, and a slice thickness of 1 mm. The acquisition time for each T2-weighted image was 1 min 40 s. The ∆ω values for the compounds were obtained from conventional NMR spectra (DMSO-d6 as solvent) or CEST spectra (water as solvent) at a pH value suitable to show the resonance signal in the slow exchange regime on the NMR time scale.Results
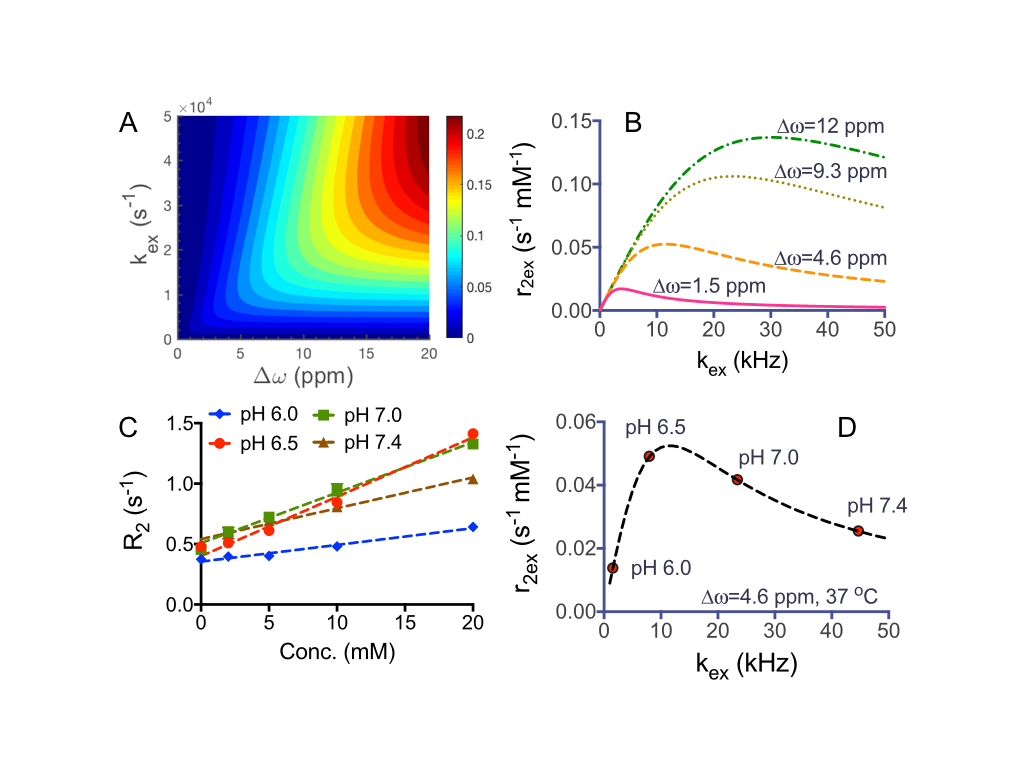
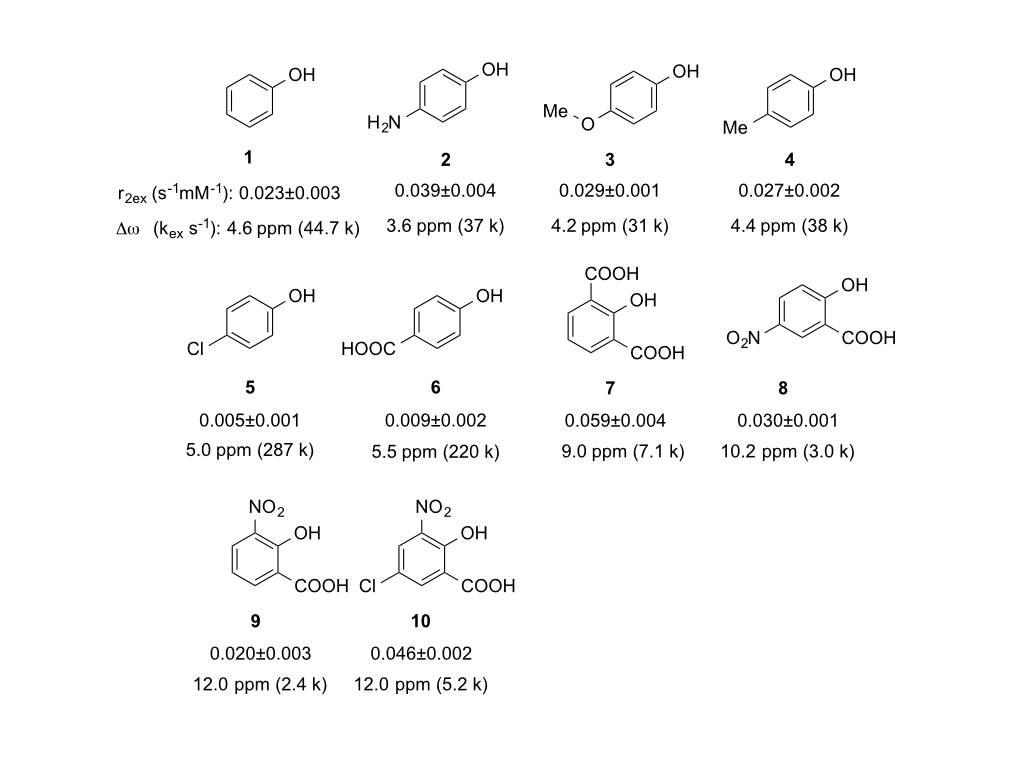
We first carried out simulations to study the dependence of T2ex contrast on ∆ω and kex using the Swift-Connick equation4. Figure 1A indicates that a large ∆ω is always favorable for generating strong T2ex contrast, while there is an optimal kex for each ∆ω (Figure 1B). Phenol clearly exhibits pH-dependent T2ex effects, with the maximum transverse exchange relativity (r2ex) of 0.049 s-1 mM-1 obtained at pH 6.5 and 37 oC (Figures 1C, D). The kex values were then estimated by fitting r2ex at three temperatures to the Swift-Connick equation, assuming that kex increases at higher temperatures. Compared to kex of 8.0 kHz at pH 6.5, we found a significantly increased kex of 44.7 kHz at pH 7.4, where a r2ex of 0.023 s-1 mM-1 was obtained. Chemical modification can be used to modulate kex and ∆ω, affecting the magnitude of r2ex. As shown in Figure 2 (compounds 1-10), electron-donating substitution (NH2, OMe, Me) para- to the phenol OH (2-4) appreciably reduces kex, resulting in an overall increase of r2ex, while electron-withdrawing substitution (Cl, COOH) para- to the phenol OH (5, 6) dramatically increases kex, leading to reduced r2ex contrast. Intramolecular hydrogen bonding can be used to achieve large ∆ω values5, and attempts to increase kex by the introduction of ortho-/para- electron-withdrawn groups result in larger r2ex in 7-10.
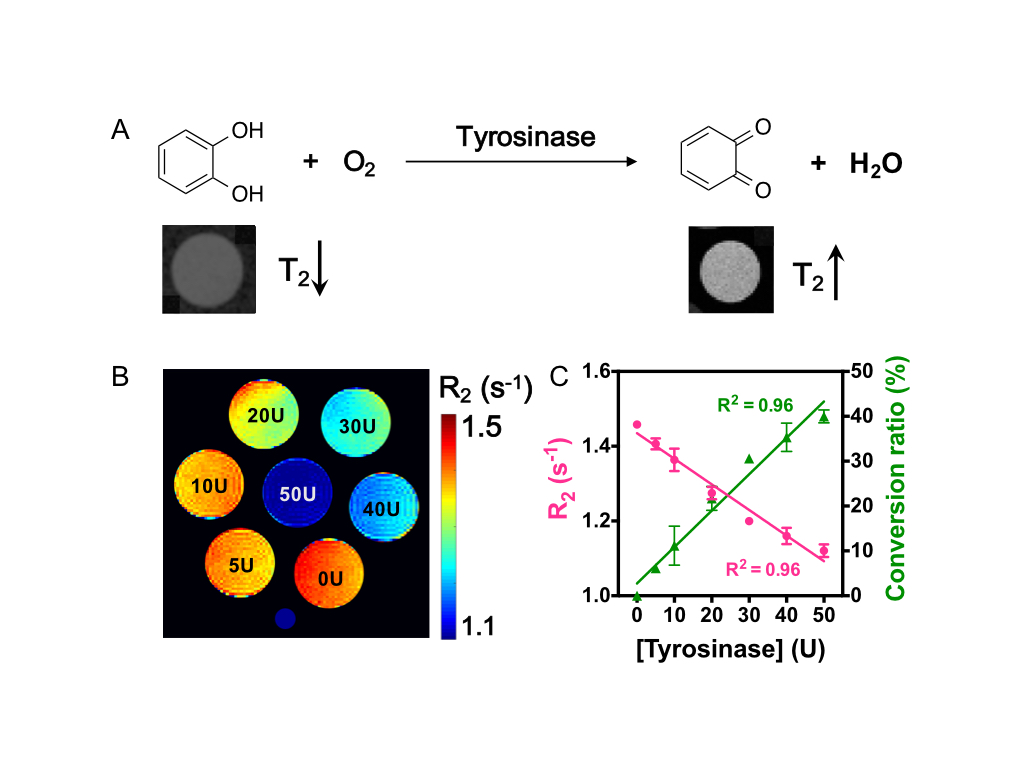
As a proof-of-principle application, we utilized r2ex MRI of catechol, the natural substrate of tyrosinase, to detect its enzyme activity. Tyrosinase catalyzes the hydroxylation of phenolic substrates to catechol derivatives, and further to ortho-quinone products, a key process in the biosynthetic pathway of some natural pigments6,7. As the reaction acts on the exchangeable hydroxyl protons, exchange-based relaxation contrast can be used for the direct detection of tyrosinase activity (Figure 3A). As shown in Figure 3B, the presence of tyrosinase significantly decreased the R2 rates of the samples. Moreover, we could obtain the conversion ratio of the enzymatic reaction at each specific concentration of tyrosinase (Figure 3C).
Conclusions
In this work, we characterized the T2ex effects of phenol and its derivatives. The T2ex contrast can be modulated by means of chemical modification through tuning exchange rate and chemical shift. Understanding the T2ex mechanism of phenolic protons can help the interpretation of endogenous T2 signal and the development of new exogenous T2ex agents. The T2ex MRI, coupled with CEST MRI, should greatly expand the availability of diamagnetic agents that can be detected directly by MRI for in vivo biomedical applications.Acknowledgements
Supported by NIH grants R03CA197470, R03EB021573, R01CA211087, R21CA215860, R01EB019934, and R01EB015032.References
(1) Soesbe, T. C., et al. T2 exchange agents: A new class of paramagnetic MRI contrast agent that shortens water T2 by chemical exchange rather than relaxation. Mag. Reson. Med. 2011, 66, 1697-1703.
(2) Aime, S., et al. Iopamidol: Exploring the potential use of a well-established x-ray contrast agent for MRI. Mag. Reson. Med. 2005, 53, 830-834.
(3) Yadav, N. N., et al. Natural D-glucose as a biodegradable MRI relaxation agent. Mag. Reson. Med. 2014, 72, 823-828.
(4) Swift, T. J. and Connick, R. E., NMR‐Relaxation Mechanisms of O17 in Aqueous Solutions of Paramagnetic Cations and the Lifetime of Water Molecules in the First Coordination Sphere. J. Chem. Phys. 1962, 37, 307-320.
(5) Yang, X., et al. Salicylic Acid and Analogues as diaCEST MRI Contrast Agents with Highly Shifted Exchangeable Proton Frequencies. Angew. Chem. Int. Ed. 2013, 52, 8116-8119.
(6) Sanchez-Ferrer, A., et al. Tyrosinase: a comprehensive review of its mechanism. Biochim. Biophys. Acta 1995, 1247, 1-11.
(7) Briganti, S., et al. Chemical and Instrumental Approaches to Treat Hyperpigmentation. Pigment Cell Res. 2003, 16, 101-110.
Figures