5019
Non-rigid atlas registration for improved quantitative assessment of rat brain regions with limited inherent anatomical contrastMatthew Tarasek1, Jeannette Roberts2, Deirdre Cassidy 3, Desmond Yeo1, Randall Carter2, and Brian Bales2
1MRI, GE Global Research, Niskayuna, NY, United States, 2Life Sciences, GE Global Research, Niskayuna, NY, United States, 3Life Sciences, GE Healthcare UK, United Kingdom, United Kingdom
Synopsis
We present a method for 3D non-rigid, feature-based atlas registration to images that contain limited inherent anatomical MR contrast. This method can be used to standardize ROI identification and may be applied to any multi-functional imaging technique to provide increased quantitative registration accuracy. Here quantitative T1 measurements were used to test the accuracy and reproducibility of the method. Overall, data analysis performed with atlas registration provides a 2-fold reduction in standard deviation and 4-fold increase in reproducibility versus data analysis performed without registration.
Purpose:
Contrast agents are used in clinical magnetic resonance imaging (MRI) examinations to enhance the visualization and diagnostic accuracy of many pathologies.1 After contrast agent washout, anatomical sub-structures (e.g. brain sub-structures) may become indistinguishable from surrounding tissues, and this greatly limits the precision/accuracy of quantitative assessment in these areas.2 Here we present a method for the registration of a rat brain atlas to images that contain limited inherent anatomical MR contrast. Quantitative in vivo T1 mapping results were used to test the accuracy and reproducibility of the registration method. Overall, data analysis performed with atlas registration provides a 2-fold reduction in region-of-interest (ROI) standard deviation and 4-fold increase in reproducibility in registered ROIs compared to data analysis performed without atlas registration.Methods:
Three Sprague Dawley rats were used for in vivo brain scans, which were performed on a clinical 3T GE MR750 scanner (GE Healthcare, Waukesha, WI) using a rat-sized transmit/receive quadrature Litz rat coil (Doty Scientific). Imaging data was acquired to cover the entire brain. Rats were anaesthetized using isoflurane and their core body temperature was monitored and maintained. Quantitative T1 data sets were acquired using a 2D inversion recovery (IR) sequence at the following TI values: 100, 250, 800, 1200, 2000 with all times in ms. Other parameters included flip-angle (FA) = 180°/90°, recovery time (TR) = 2500ms, echo time (TE) = 2ms, field-of-view (FoV) = 6cm2, matrix 256 x128, 0.8mm thick. Data analysis included (i) quantitative T1 mapping in whole-brain ROI, which involved T1-fitting per pixel according to a standard inversion recovery equation (S(t)=S0(1 - 2*e-TI/T1)), (ii) identification of anatomical structures in dataset with confirmation by a trained biologist, (iii) extraction of quantitative T1 values from the identified ROIs without atlas registration, and (iv) re-extraction of quantitative T1 values from the identified ROIs with atlas registration. Registration was performed as depicted in Fig. 1 and 2 with a feature-based selection of fixed points per image slice, and moving points in the corresponding atlas volume.3 Most data analysed required a combination of translation, rotation, and scaling, although in some instances shearing was also evident and an affine input was necessary for the computation of the transformation matrix. The transformation matrix corresponding to matching the point pairs, was completed in using the RANSAC algorithm4, and the inverse geometric transform was used to recover the atlas distortions for image overlay and display. All post-processing code was written in Matlab (Mathworks, Natick, MA).Results/Discussion:
The atlas registration was performed by specifying a fixed/moving point estimate based only on the outline of the brain region in a proton-density weighted (PDw) image (Fig. 1 and 2, shown for axial and coronal slice planes respectively); this method increased the registration speed and consistency by eliminating the need for accurate brain sub-structure identification. Slice placement was calculated by matching the atlas center with the central imaging slice, and then calculating atlas positions based on imaging parameters (slice thickness and spacing). Table 1 shows the data summary for critical brain structures identified and assessed with quantitative T1 mapping. Results indicate an average of 2.1 times reduction in measurement uncertainty (standard deviation) using atlas registration for these structures (based on the ROI standard deviations). Fig. 3a-d shows histogram results for a pituitary gland assessment of a single rat, where Fig. 3b is T1 value (average and standard deviation) without registration extracted from an average ROI location as depicted in Fig. 3a, and Fig. 3d is the T1 value computed with registration, extracted from an average ROI location as depicted in Fig. 3c. The number of pixels used in ROI for calculation was held constant. In addition to uncertainty reduction, we see a greater measurement repeatability between scan sessions for analysis done with registration. Table 1 indicates that T1 varies by <2% on subsequent scan days in ROIs analysed with registration, whereas variations up to 16% can be seen in these regions analyzed without atlas registration.Conclusion:
Results suggests that use of non-rigid registration, using a brain-outline feature-based selection of fixed/moving points can provide a more accurate and repeatable measure of quantitative T1 data in brain sub-structure ROIs. This is indicated by a 2.1-fold reduction in measurement ROI uncertainty and a 4-fold increase in measurement repeatability. Overall, this method can be used to standardize ROI identification and may be applied to any multi-functional imaging technique to provide increased quantitative registration accuracy. Future algorithm improvement may be achievable by automating point selection based on a Sobel approximation of image gradient at the brain/CSF interface, as this will eliminate the step of manual point selection.Acknowledgements
No acknowledgement found.References
[1] Caravan et al. Chem. Rev., 99:2293-2352(1999 [2] ) [2] Yamamoto et al. Radiol Phys Technol. 2(1):13-21. (2009) [3] Goshtasby, Ardeshir, Pattern Recognition, Vol. 19, 1986, pp. 459-466. [4] Goshtasby, Ardeshir, Image and Vision Computing, Vol. 6, 1988, pp. 255-261.Figures
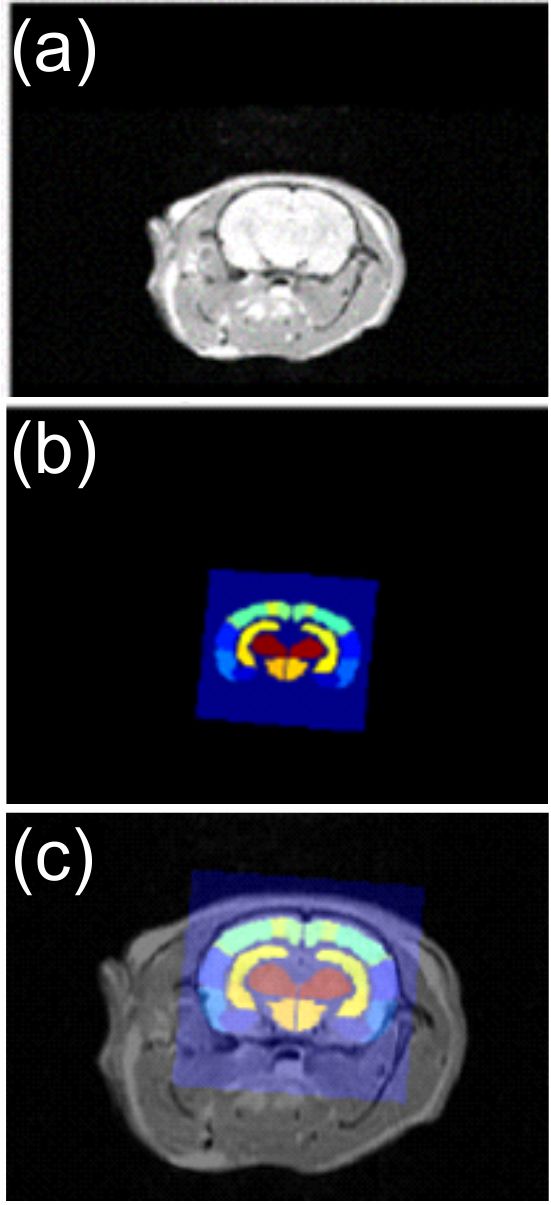
Fig. 1 Example of atlas registration
for an axial slice selection. (a) Shows background proton-density weighted mid-brain
image. (b) Shows atlas slice for slice position in (a), deformed by geometric transformation.
(c) Shows images overlaid for subsequent analysis as described in text and Fig.
3.
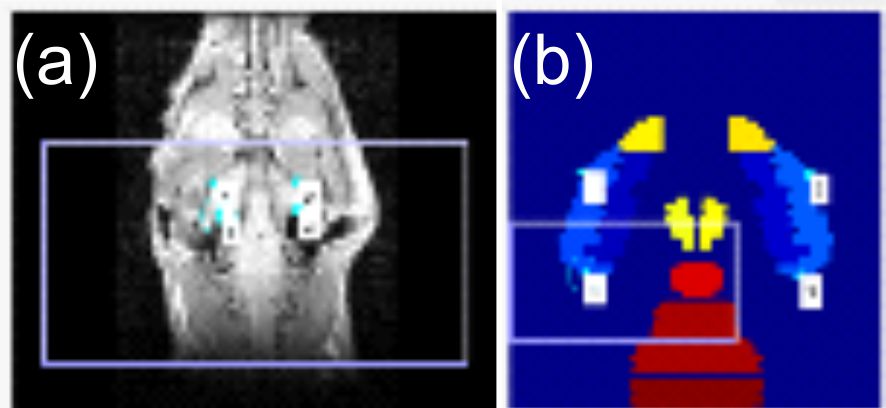
Fig. 2 (a) Shows an example of feature-based
selection of fixed points on a coronal image slice, and (b) moving points in
the corresponding atlas volume. Points are used as inputs to compute a
transformation matrix as described in text. Resulting example of registration
and display can be seen in Fig. 1 for an axial slice view or Fig. 3c for a
coronal slice view.
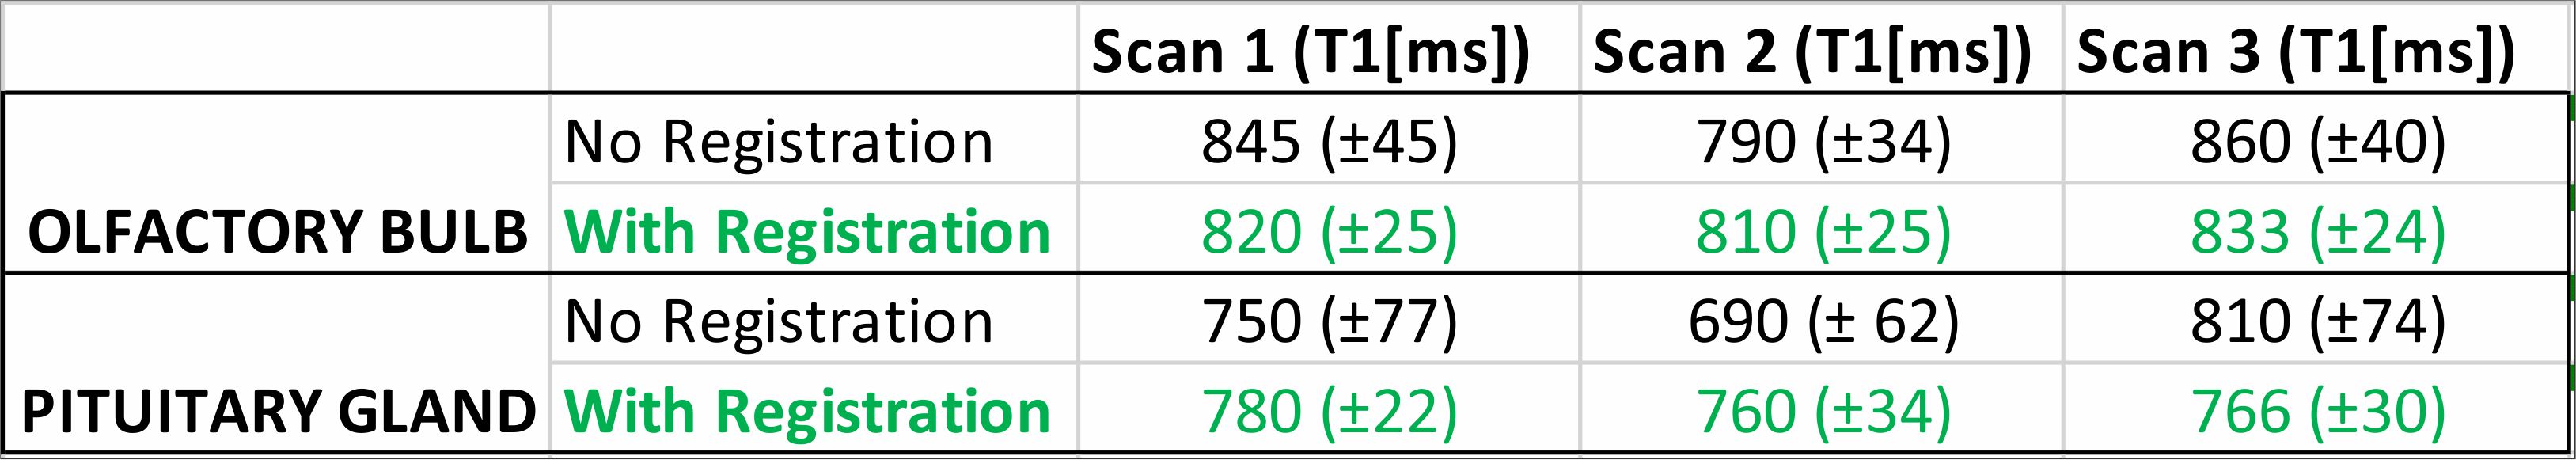
Table 1. Data summary for
olfactory bulb and pituitary gland brain structures identified and assessed
with quantitative T1 mapping, with and without registration. See text for
discussion of results.
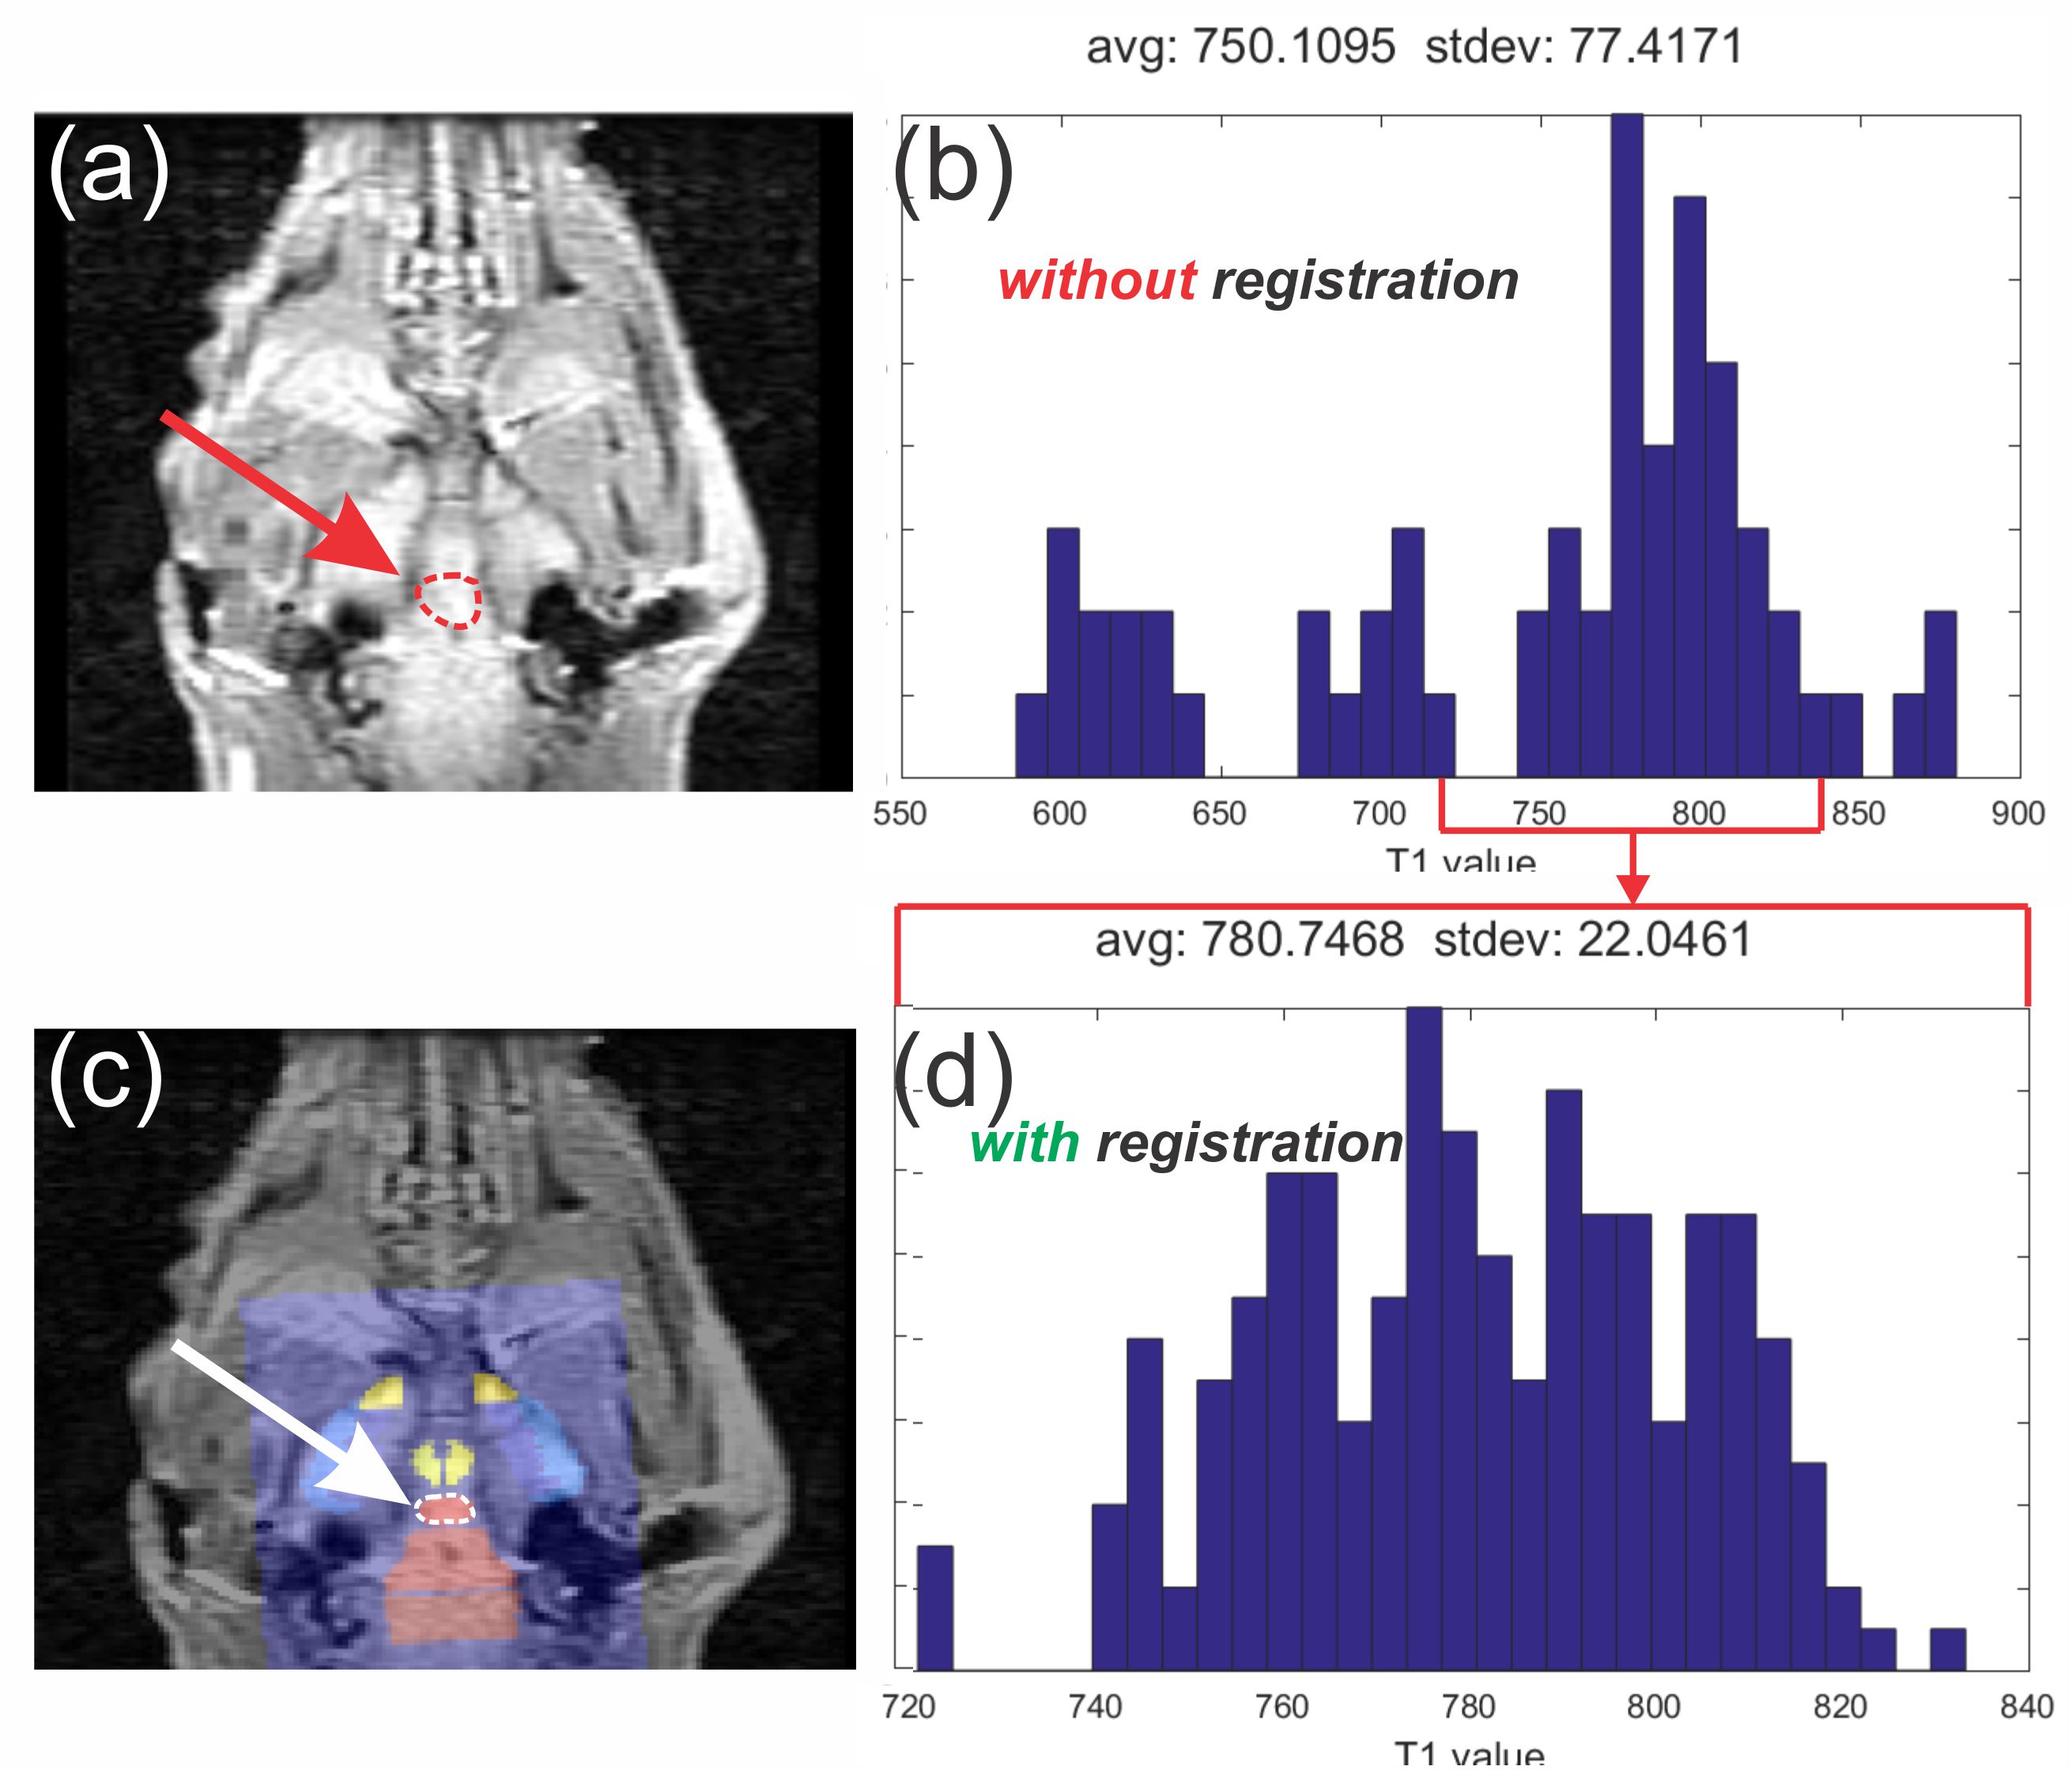
Fig. 3 (a) Shows average ROI
drawn for pituitary gland data analysis based on background image alone without registration. The red arrow
points to ROI used for data analysis (red outline). (b) Average T1 value
distribution from pituitary gland ROI in (a). (c) Shows average ROI drawn for
pituitary gland data analysis based on background image with atlas registration (white arrow points to the ROI used). (d)
Shows average T1 distribution extracted from pituitary gland ROI in (c).
Overall uncertainty is reduced for analysis done with registration by a factor
of 3. See text for more details.