5018
NOE contributions to the z-spectrum of human blood1Sir Peter Mansfield Imaging Centre, School of Physics and Astronomy, University of Nottingham, Nottingham, United Kingdom, 2Department of Radiology, University Medical Center Utrecht, Utrecht, Netherlands
Synopsis
This study investigates the properties of relayed NOE effects in the blood by fitting z-spectra acquired using continuous wave saturation to the analytical solutions of the Bloch-McConnel equations. We systematically model for an increasing number of NOE peaks based on previous reports, and find that adding in two NOE peaks at -3.5ppm and -1.7ppm significantly improves the fit, but adding further peaks does not. Furthermore, we fit for the exchange rates and T2s of these pools, and find that the peak at -3.5ppm has exchange rate=21.5Hz and T2=0.9ms and the peak at -1.7 ppm has exchange rate=8.6Hz and T2=3ms.
Purpose
Recent studies into the z-spectrum in human blood have revealed an NOE peak at -1.7ppm1. However studies in the brain have modelled NOE with up to 5 peaks2. When the z-spectrum is acquired using continuous wave (CW) saturation, the pool size, exchange rates and T2s of these peaks can be fitted through analytical solutions of the Bloch-McConnell equations. Knowledge of these NOE pools (exchange rates and T2s) will help identify the source of these peaks and develop specific pulse sequences to measure them. It is important to characterize the z-spectrum of blood since it contributes to signals from all organs, but blood also provides an excellent model to test the origin of contributions to the z-spectrum.Aim
To characterise the NOE signal contribution to the Z-spectra from blood.Methods
A 4ml sample of blood was obtained from one subject (M, age=23, sO2=89%, Hct=43%), and stored in a vacutainer. The tube was placed in a 37°C water bath which could be rotated in-situ to prevent the red blood cells settling, and scanned using a Philips 7T Achieva system with multi-transmit capability. Semi-CW saturation was performed by alternating square pulses on odd and even channels3,4. Z-spectra were acquired at 5 saturation powers and 63 frequencies between ±667ppm (B1=0.17,0.34,0.67,1.34,2μT, saturation duration=3s,). Acquisition of one spectrum took ~10mins. A B1 map was also acquired and T1 was measured using saturation recovery.
The Z-spectra were fitted to analytical solutions of the Bloch-McConnell equations under CW saturation5 using a particle swarm algorithm6. The B1 and observed T1 used in the fit were taken from the measured values. As well as the free water and MT pool, three CEST pools were included: amides (+3.5ppm), creatine (+1.9ppm), and phosphocreatine (+2.5ppm). Pool size, exchange rate between CEST/MT and free water, and T2 of all pools were allowed to vary in the fit within bounds based on literature2 and observations.
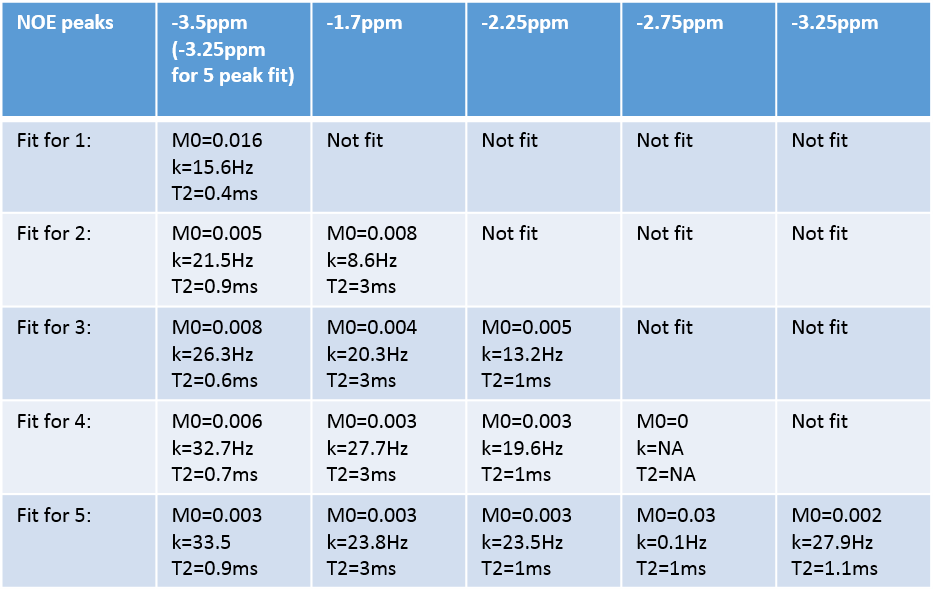
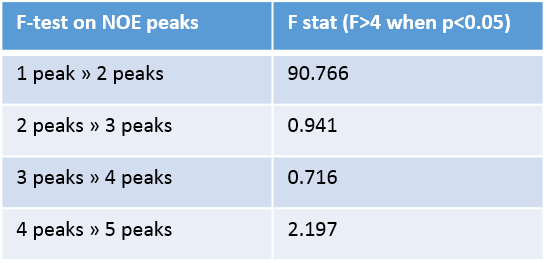
NOE pools were then added into the fit one by one, at positions based on previously reported signals at -3.5ppm7, -1.7ppm8, and at -2.25ppm and -2.75ppm2. For the fit with 5 NOE pools, the -3.5ppm peak was replaced with pools at -3.25ppm and -3.75ppm. The order the peaks were added was determined by previous reports and apparent gaps in the fit. The resulting pool size, exchange rate, and T2 of each pool were recorded. An f-test was used to determine whether adding subsequent pools significantly improved the fit. To test the precision of the fit, Monte-Carlo simulations were performed where both noise and errors in B1 estimates were added to a simulated spectrum containing MT and one CEST peak of varying exchange rates and T2s. The spectra were fitted and error on measured exchange rates were used to determine the error in the fit. This was repeated for the full spectrum with two NOE peaks.
Results
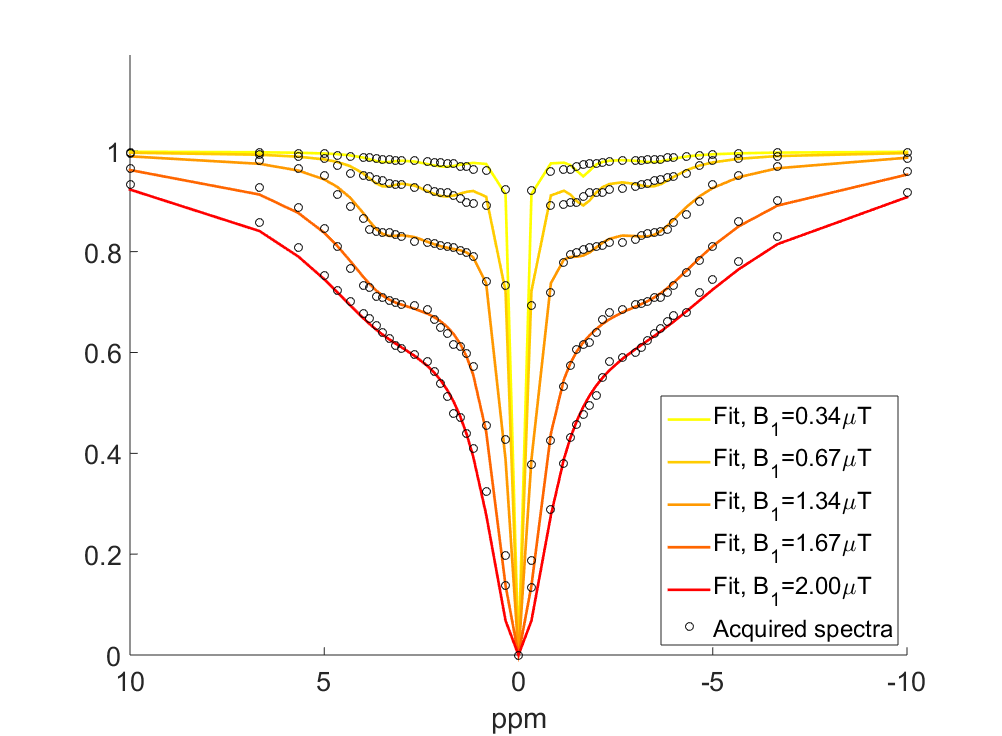
Table 1 shows the results of fitting acquired spectra to an increasing number of NOE pools. Table 2 shows results of the f-test. Only moving from one to two peaks yielded a significant improvement in the fit. Fig.1 shows the optimum fit using two NOE peaks.
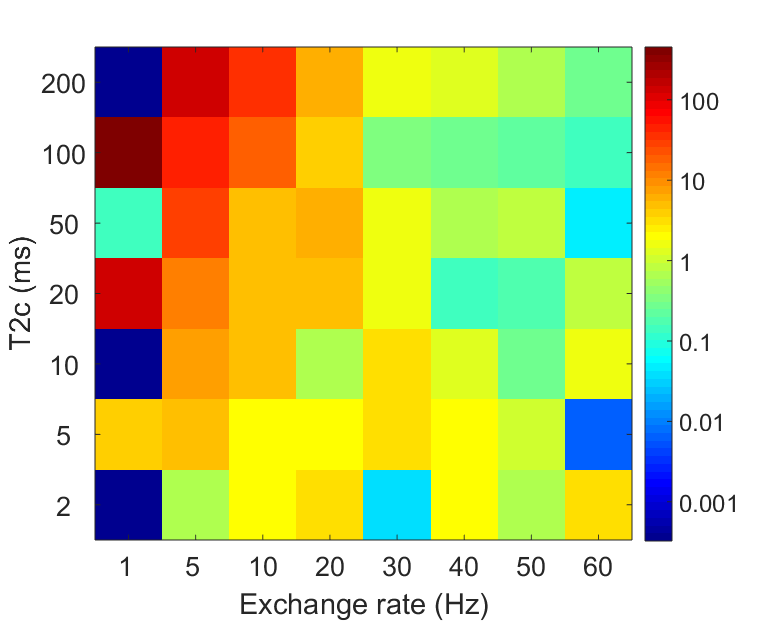
Fig.2 shows results of simulations to determine the precision of the fit. The method fits precisely apart from T2s>20ms and lower exchange rates<10Hz. A test on the full model produced virtually identical results, as fitting to NOE is not particularly affected by CEST peaks.
Discussion
The f-test confirms the previous finding of two NOE peaks in blood at -3.5ppm and -1.7ppm, suggesting that additional NOE peaks sometimes identified in other tissues2,9 do not originate from NOE in blood. The fitted exchange rates of 21.5Hz for the NOE pool at -3.5ppm and 8.3Hz at -1.7ppm are in line with previous estimates (11Hz has been estimated for NOE effects in the brain9). Some discrepancy between the data and model close to the water line is still visible at low B1 power and is being investigated.
The error analysis indicates that fitting to this model can robustly determine the exchange rates of exchanging pools, providing the position of the peak is known beforehand. The error increases when the exchange rates are short and the T2s of the exchanging pools are long, however this experiment was not designed to investigate pools with such physical properties. These results imply that exchange rates can be quantified in various tissues using CW saturation.
Conclusion
We have shown that the z-spectrum from blood contains two NOE peaks at -3.5 ppm with exchange rate=21.5Hz and T2=0.9ms and at -1.7 ppm with exchange rate=8.6Hz and T2=3ms.Acknowledgements
Andrew Carradus holds a studentship with the Haydn Green Foundation.References
1. Shah, Simon M., et al. "The z-spectrum from human blood at 7T." NeuroImage (2017).
2. van Zijl, Peter, et al. "Magnetization Transfer Contrast and Chemical Exchange Saturation Transfer MRI. Features and analysis of the field-dependent saturation spectrum." NeuroImage (2017).
3. Hoogduin H, Khlebnikov V, Keupp J, et al (2017) Semi continuous wave CEST with alternating sets of 4 transmit channels at 7T. MAGMA 30:S1–S152
4. Keupp J, Baltes C, Harvey PR, Brink J van den (2011) Parallel RF Transmission based MRI Technique for Highly Sensitive Detection of Amide Proton Transfer in the Human Brain at 3T. Proc Intl Soc Mag Reson Med 19:710.
5. Zaiss, Moritz, et al. "A combined analytical solution for chemical exchange saturation transfer and semi‐solid magnetization transfer." NMR in biomedicine 28.2 (2015): 217-230.
6. MATLAB and Statistics Toolbox Release 2012b, The MathWorks, Inc., Natick, Massachusetts, United States.
7. Zhou, Jinyuan, et al. "APT‐weighted and NOE‐weighted image contrasts in glioma with different RF saturation powers based on magnetization transfer ratio asymmetry analyses." Magnetic resonance in medicine 70.2 (2013): 320-327.
8. Zhang, Xiao-Yong, et al. "A new NOE-mediated MT signal at around− 1.6 ppm for detecting ischemic stroke in rat brain." Magnetic resonance imaging 34.8 (2016): 1100-1106. 9. Jones, Craig K., et al. "Nuclear Overhauser enhancement (NOE) imaging in the human brain at 7T." Neuroimage 77 (2013): 114-124.
9. Jones, Craig K., et al. "Nuclear Overhauser enhancement (NOE) imaging in the human brain at 7T." Neuroimage 77 (2013): 114-124.
Figures