5016
Comparison of cardiac output calculated from low dose Ultra-fast DCE MRI to the values measured from cardiac MRI1Radiology, University of Chicago, Chicago, IL, United States, 2Pathology, University of Chicago, Chicago, IL, United States
Synopsis
Accurately measuring arterial input function (AIF) is essential for quantitative dynamic contrast enhanced (DCE) MRI. The indicator dilution principle was used to verify the accuracy of AIF measured at iliac arties following injection of low dose (0.015 mmol/kg) gadolinium contrast media. The cardiac output from cardiac MRI (COCMRI) were compared with the cardiac output from Ultra-fast DCE-MRI (CODCE). Results demonstrated that the CODCE were consistent with the ‘gold standard’ COCMRI. This demonstrates that the low dose ultra-fast DCE-MRI can be used to accurately measure the AIF.
INTRODUCTION
A pharmacokinetic model of dynamic contrast enhanced (DCE) MRI is usually applied to obtain physiological parameters for cancer detection and diagnosis. An arterial input function (AIF) must be measured for each patient to account for variations in cardiac output, systemic vascular function, and injection protocol. Accuracy measured AIFs from the artery are prone to partial volume effects, mis-registration, inflow artifacts, etc. High blood concentrations of contrast media cause an underestimation of AIF peak magnitude measured from the artery due to T2* and water exchange effects1-2. The indicator dilution or Stewart–Hamilton principle3 is valid for the AIF sampled anywhere in the body and states that D=CO×AUC, where D is the mass of the injected tracer, CO is the cardiac output, defined as the volume of blood being pumped by the heart per minute, and AUC is the area under the “first pass” concentration curve. Here, this principle was used to verify the accuracy of AIF measured by MRI. To minimize T2* and water-exchange effects, we injected a very low dose gadolinium of contrast media (15% of the standard dose). We determined whether the AIF measured directly from an artery following the low contrast media dose is consistent with cardiac output directly measured with cardiac MRI (CMRI).METHODS
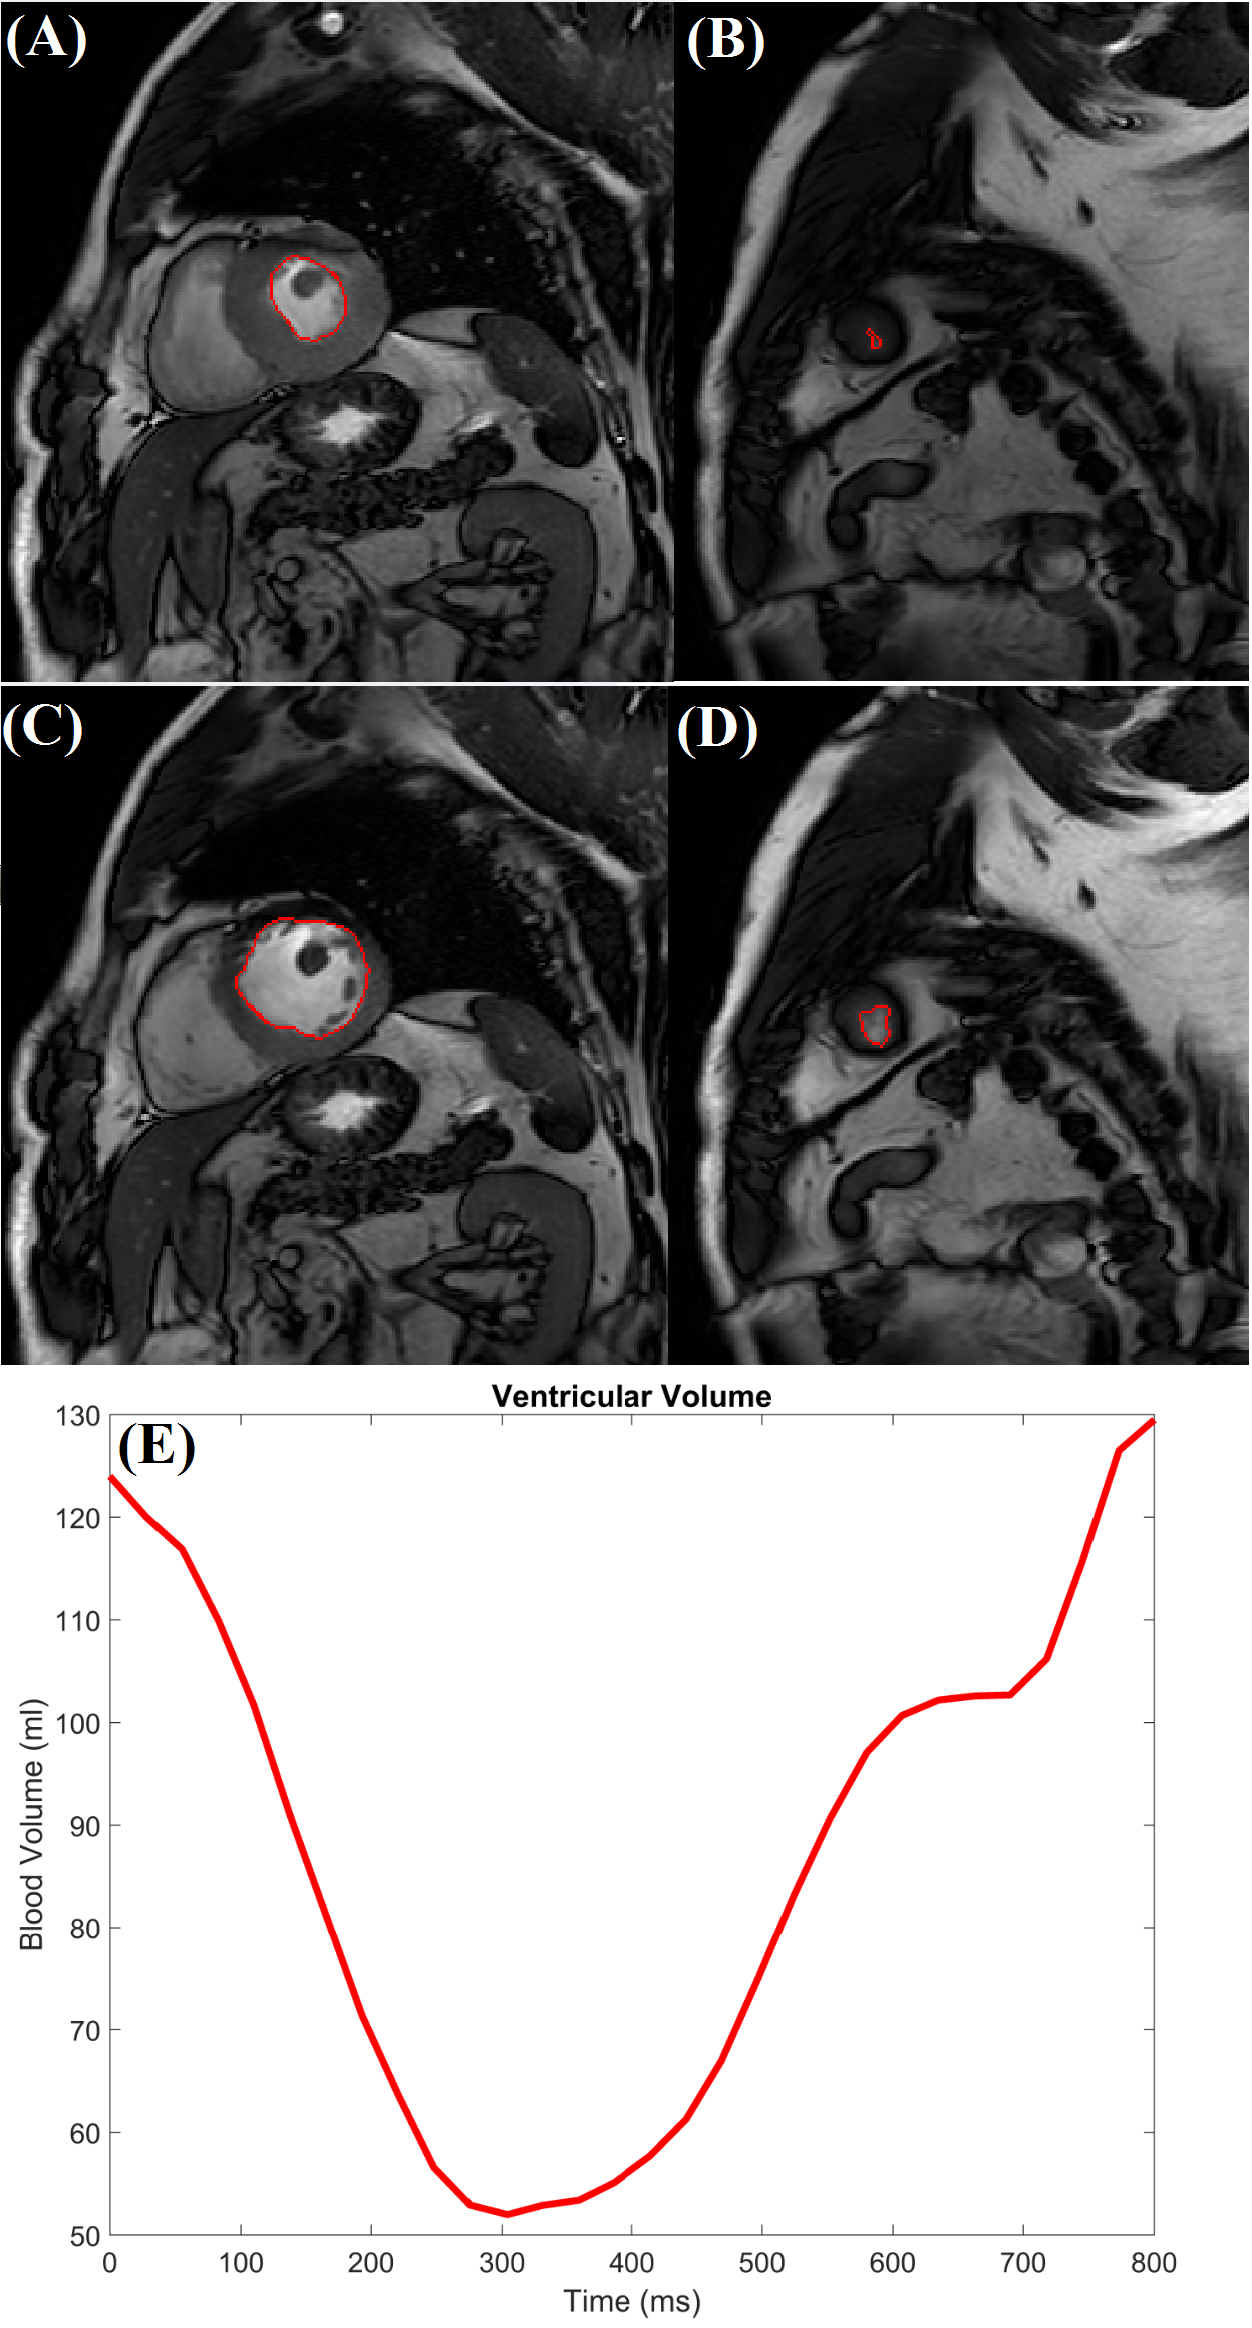
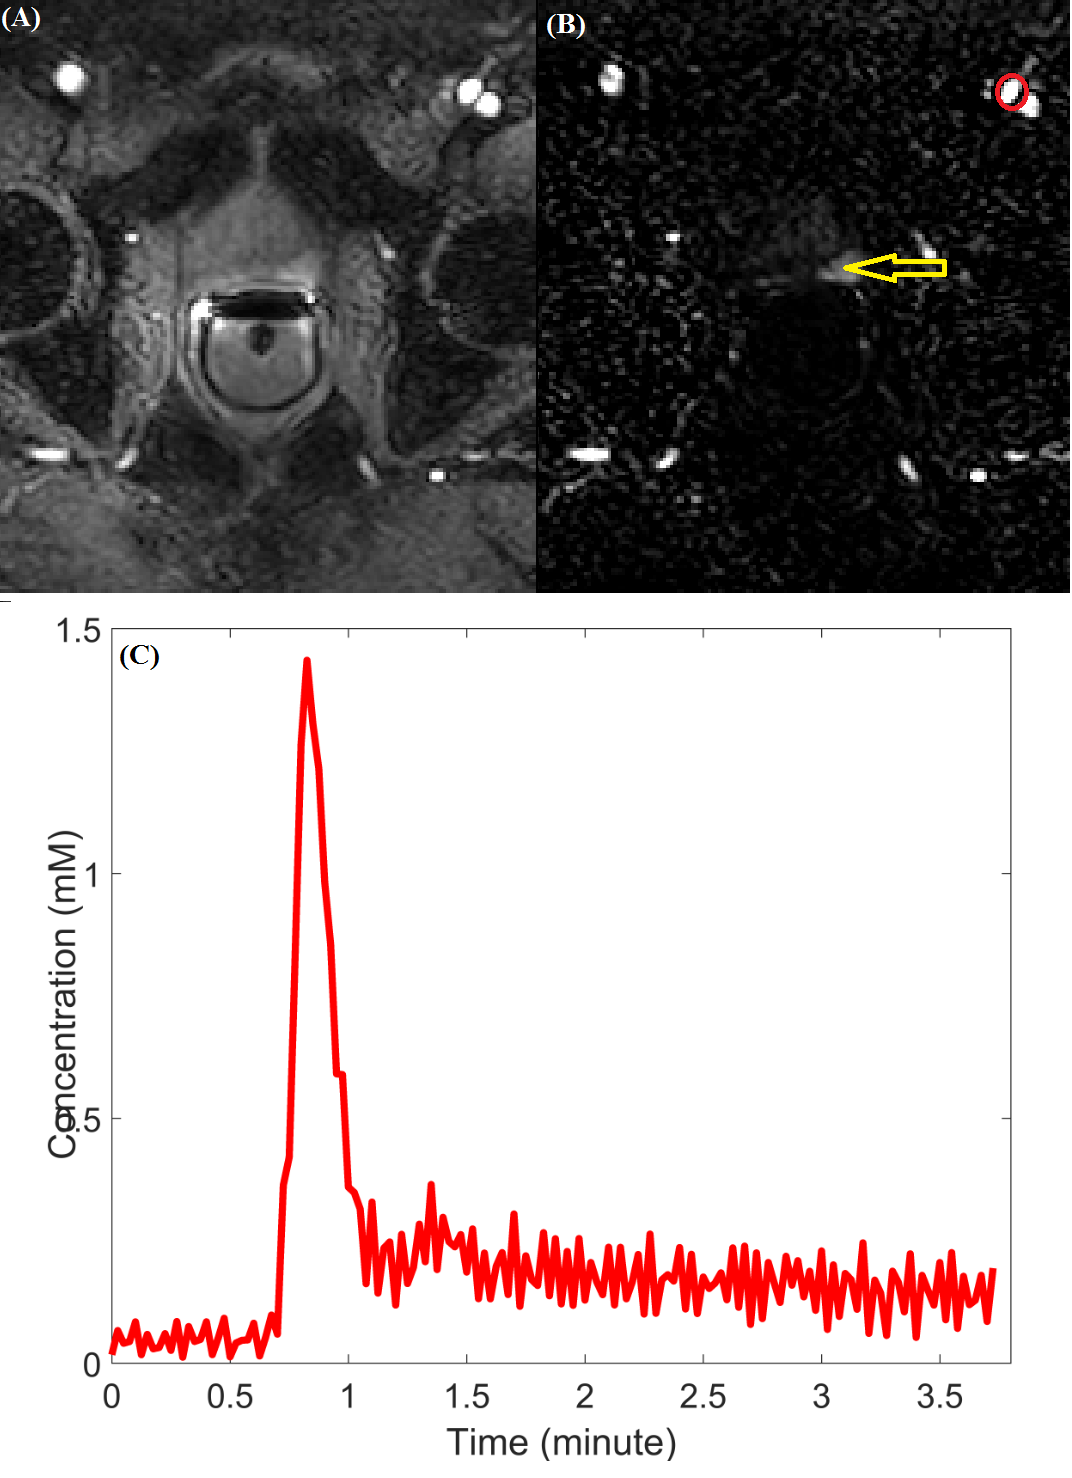
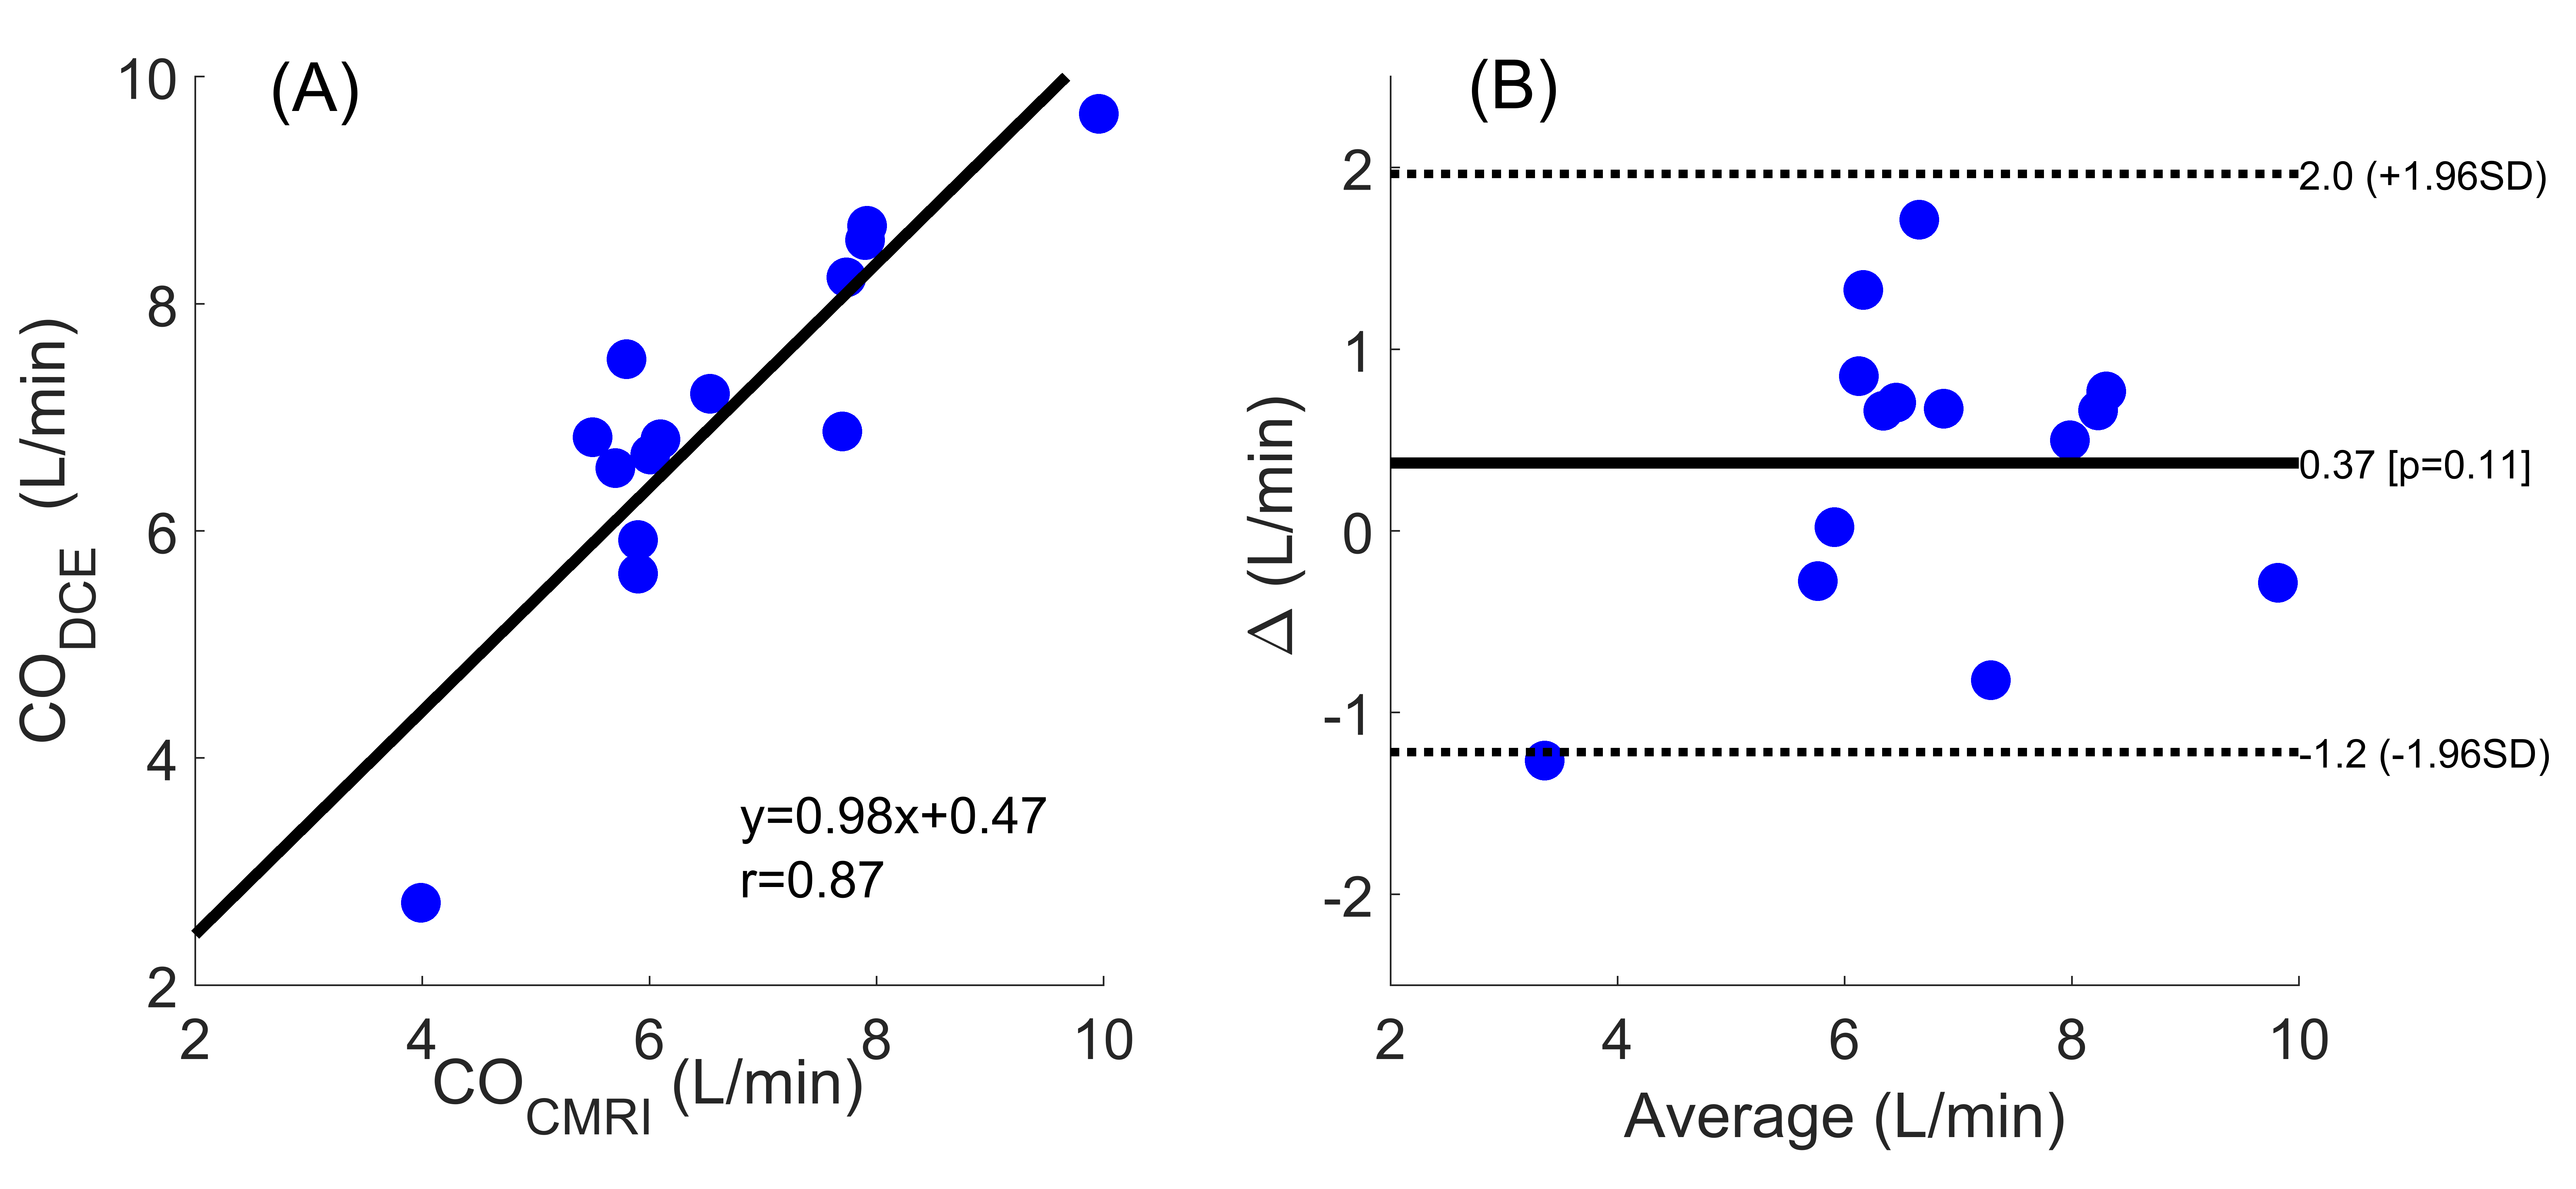
This IRB-approved study included fifteen prostate cancer patients (average age 59 yo, range 47-73 yo; average weight 96.7 kg, range 79-132 kg)with the whole mount pathology reports. Both cardiac-MRI and low dose (0.015 mmol/kg of gadobenate dimeglumine) ultra-fast (Ufast) DCE-MRI were acquired on a Philips 3T Ingenia scanner. A gradient echo sequence (B-TFE) was used for imaging the cardiac short axis (SA) (TR=3.1 ms, ΔTE=21-30 ms, FA=45°, FOV=30×30 cm2, 14 slices with 30-40 phases, gap=0, in-plane resolution=1.0×1.0×8 mm3, maximum dynamic time=800-1025ms). Variable flip angle (VFA) 3D-FFE-T1 scans (TE/TR=2.3/12 ms, FA=3°, 5°, 10°, 15°, 20°, 30°, FOV=25×39 cm2, in-plane resolution=1.2×1.8×3.5 mm3) were used for calculation of native T1. DCE-MRI scans were acquired using an mDixon sequence (TE1/TE2/TR=1.5/2.8/4.2 ms, FA=10°, FOV=18×37 cm2, in-plane resolution=1.5×2.8×3.5 mm3, temporal resolution=1.5 s, number of dynamic scans =150). The contrast media concentration was calculated from native T1 and DCE-MRI signal in the iliac arties. The cardiac output from CMRI (COCMRI) was calculated from the difference between ventricular volume at diastole and systole measured on a short axis cardiac from: COCMRI = HR× (VED–VES), where VED is the end of diastolic, VES is the end of systolic, and HR is the patient’s heart rate measured from the short axis CMRI. The cardiac output from DCE-MRI (CODCE) was calculated from the AIF and the dose of contrast media: $$$CO_{DCE}=Q/\int{C_b(t)}dt $$$, where Q is the amount of the contrast media injected, and is the contrast concentration in the blood. The area under the “first pass” of contrast media circulation was used for integration. The CODCE was compared to the COCMRI. Percent difference of less than 15% between the two methods was considered to be ‘good agreement’. A Correlation test and Bland Altman plot were used to compare the two methods for measuring cardiac output.RESULTS
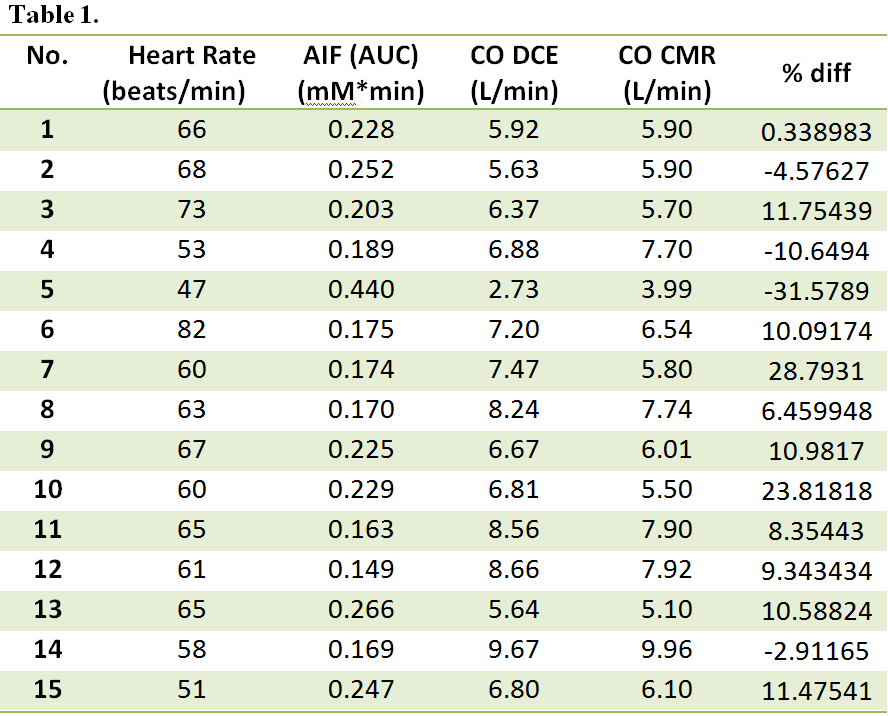
Figure 1 shows the COCMRI calculations: (A) and (B ) show the minimum cross-section area during the end of systolic period, (C) and (D) show the maximum cross-section area duringthe end of diastolic period, and (E) is the ventricular volume measured from SA CMRI.Figure 2 shows (A) the ultra-fast DCE image (at the 40th dynamic scan) from the same patient shown in Fig. 1, (B) the subtracted dynamic image from baseline shows early enhancement in prostatic carcinoma (red arrow), and (C)the AIF generated from iliac artery (red circle). Table 1 lists the patients’ heart rate, the amount of contrast agent injected, the calculated CODCE (6.88±1.64 L/min) and COCMRI (6.52±1.47 L/min) as the reference standard. The average AUC value measured directly from local AIF using ultra-fast DCE-MRI is 0.219±0.07 mM·min. The averaged percent differences between the two CO measurements was 10.2% (n=11) and -12.5% (n=4). There are strong positive correlations (r=0.87, p < 0.01) between the COCMRI and CODCE (Figure 3A). The corresponding Bland-Altman plot shows excellent agreement between the two CO measurements (Figure 3B).DISCUSSION
The indicator dilution principle was used to verify the accuracy of AIF measured at iliac arties after injection of low dose gadolinium contrast media. The results demonstrate that the CODCE measured from ultra-fast DCE-MRI were consistent with the ‘gold standard’ CO measured from the short axis cardiac MRI. This indicates that the AIF can be measured accurately directly from an artery with ultra-fast DCE-MRI following a low dose of contrast media.Acknowledgements
This research is supported by NIH R01 CA172801-01 and NIH 1S10OD018448-01.References
1. Parker, G. J., Roberts, C., Macdonald, A., Buonaccorsi, G. A., Cheung, S., Buckley, D. L., Jackson, A., Watson, Y., Davies, K. & Jayson, G. C. 2006. Experimentally-derived functional form for a population-averaged high-temporal-resolution arterial input function for dynamic contrast-enhanced MRI. Magn Reson Med, 56, 993-1000.
2. Yankeelov, T. E. & Gore, J. C. 2009. Dynamic Contrast Enhanced Magnetic Resonance Imaging in Oncology: Theory, Data Acquisition, Analysis, and Examples. Curr Med Imaging Rev, 3, 91-107.
3. Stewart GN. Researches on the Circulation Time and on the Influences which affect it. J Physiol. 1897 Nov 20;22(3):159-83.
Figures