5013
Comparison of B0 versus B0 and B1 field inhomogeneity correction for glycosaminoglycan chemical exchange saturation transfer imaging1Department of Diagnostic and Interventional Radiology, University Dusseldorf, Medical Faculty, Dusseldorf, Germany
Synopsis
Glycosaminoglycan CEST (gagCEST) has been shown to be a useful tool for assessing changes in glycosaminoglycan concentrations in cartilage. However, accurate B0 referencing is necessary for observing reliable gagCEST. Here we investigate whether the quality of in vivo gagCEST images can be further improved by correction of both B0 and B1 inhomogeneity by using a novel water shift and B1 (WASABI) mapping method. We present results from 20 healthy volunteers acquired at 3T. A comparison with the outcome of WASSR B0 mapping shows that the application of the WASABI maps to inhomogeneity artefact correction is advantageous to gagCEST imaging.
Introduction
Magnetic resonance (MR) glycosaminoglycan chemical saturation transfer (gagCEST) has been shown to be a useful tool for assessing changes in glycosaminoglycan (GAG) concentrations in cartilage1. Recent studies have reported a relation between gagCEST and intervertebral disc (IVD) degeneration, decreased IVD hydration and decreased height of the discs2, 3. Nevertheless, quantification of in vivo gagCEST effect at a clinical MRI system is challenging due to its high sensitivity to magnetic field inhomogeneity4. Therefore, careful B0 referencing is necessary in order to improve the accuracy of CEST analysis in cartilage. Up to now, several methods have been applied to correct B0 field inhomogeneity including water saturation shift referencing (WASSR) algorithm and gradient echo technique5, 6. Lately, a novel water shift and B1 (WASABI) mapping method and its successful application for the field inhomogeneity correction of CEST data from human brain was presented7.
In this abstract, we assess whether the quality of in vivo gagCEST images could be improved by correction of both B0 and B1 inhomogeneity using the WASABI method compared to the B0 only WASSR-corrected images. To evaluate field inhomogeneity corrected gagCEST imaging, we chose IVDs due to their thickness and discoid shape. IVDs can be divided into two parts: the nucleus pulposus (NP) representing the core of the disc and the annulus fibrosus (AF) which is the outer ring of the disc8. Previous studies demonstrated considerably higher GAG content in NP compared with AF8. Therefore, we sought to investigate whether NP can be differentiated from AF due to their gagCEST effects corrected with the field inhomogeneity maps estimated from WASSR and WASABI acquisitions.
Methods
All MR measurements of lumbar IVDs were performed on a 3T MRI system (Magnetom Trio A TIM System, Siemens, Erlangen, Germany) using a spine matrix coil. The sequence protocol consisted of sagittal and transversal T2-weighted imaging, T2 mapping, T1 mapping, WASSR and WASABI and pulsed CEST sequences. For WASSR, the saturation module consisted of a single Gaussian-shaped RF pulse with B1=0.1μT and a pulse duration PD=58ms. The WASSR-Z-spectrum was acquired at 41 offsets (±1ppm), whereas the WASABI-Z-spectrum was obtained at 49 offsets (±2.4ppm) with one rectangular-shaped RF pulse (B1=4μT, PD=5ms). CEST saturation module consisted of 10 spin-lock pulses (PD=100ms, duty cycle=50%) at three different B1=0.5μT, 1.0μT and 1.5μT. CEST Z-spectra were acquired with 33 frequency offsets in a range from -4.8 to 4.8 ppm. The imaging parameter were: a single-shot gradient echo acquisition, FOV=30 cmx30 cm, matrix size 128x128, flip angle=10°, TR/TE=10ms/3.64ms. Total acquisition time was 34 minutes.
Twenty volunteers without any history of lower back pain or previous spine surgery (12 females, 8 males, 29±9 years, 21-57 years) were investigated.
Results and Discussion
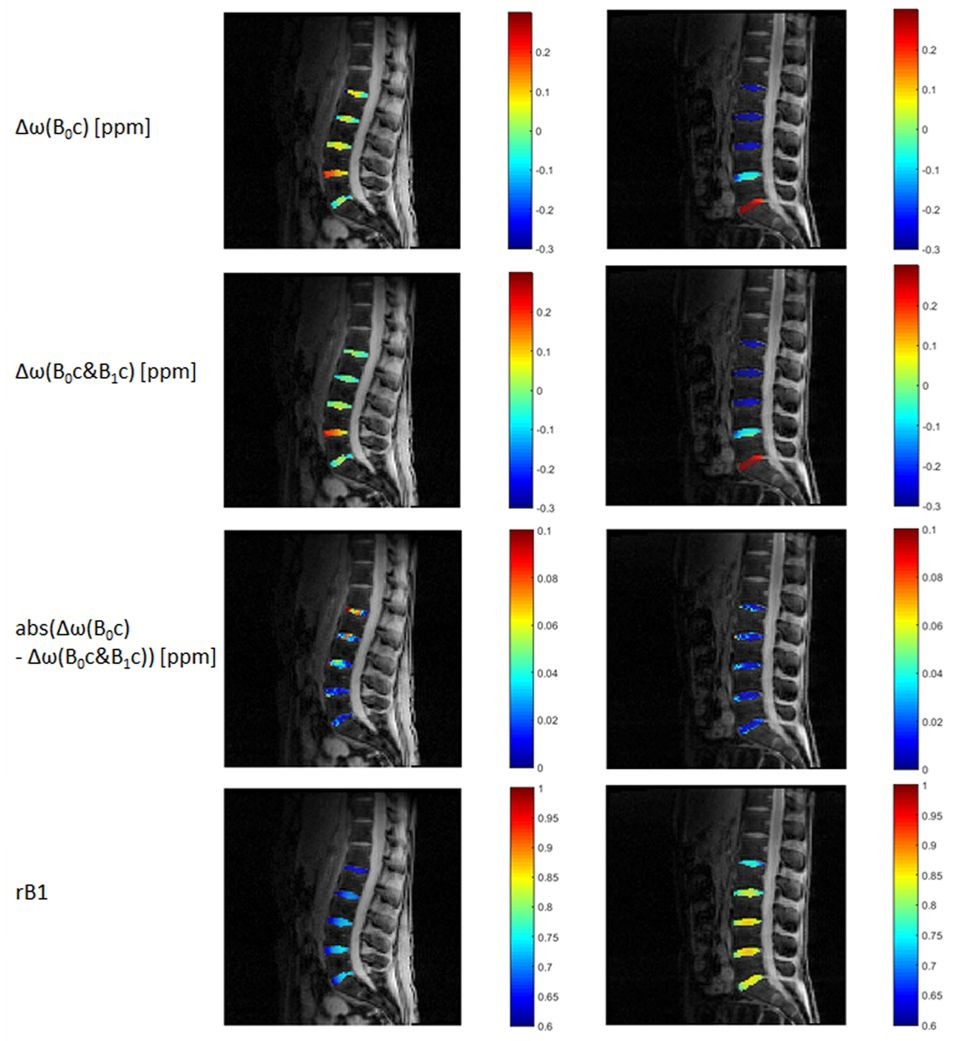
Fig. 1 shows water frequency shift (Δω) and relative B1 (rB1) maps as well as the difference of Δω maps estimated using WASSR (B0c) and WASABI (B0c&B1c) approaches for two exemplary volunteers. Both methods provided similar Δω maps (absolute difference of Δω with WASSR and WASABI: 0.03 ppm±0.03 ppm). The mean relative B1 value in the IVDs was below one (IVD: rB1=0.78±0.07), indicating reduced radiofrequency reception in this region.
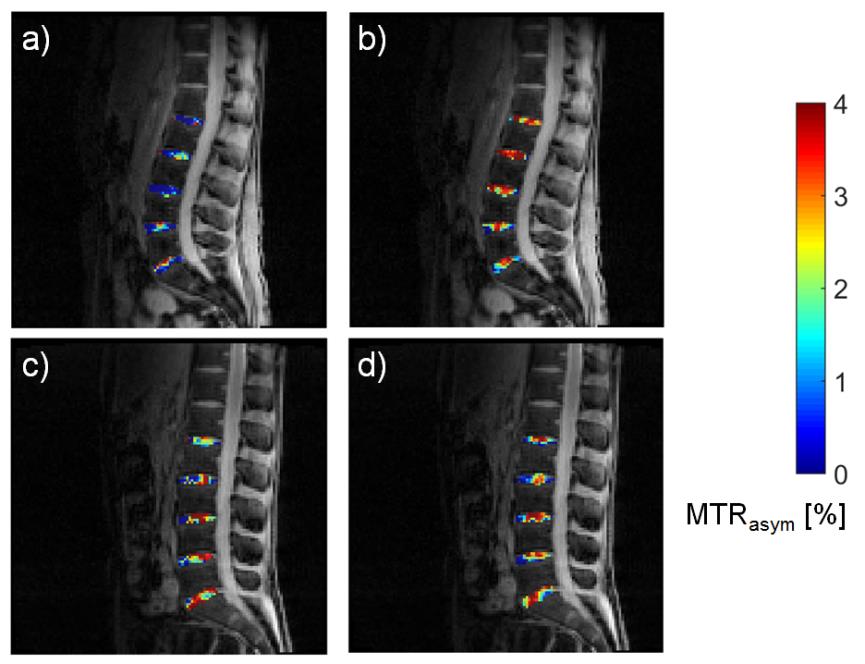
Fig. 2 shows MTR asymmetry maps (MTRasym) calculated for the corrected gagCEST data measured in two healthy volunteers, using WASSR (a, c) and WASABI maps (b, d) for field inhomogeneity correction. Correction of both B0 and B1 inhomogeneity led to significantly higher MTRasym values (p=0.020) and significantly higher SNR of the MTRasym maps in NP (p=0.011). We used the SNR as quality feature since similar GAG content can be expected for regions with similar composition. Due to alterations as consequence of cartilage degeneration or destruction, this assumption might be queried. Therefore, our study population was restricted to healthy volunteers without previously known cartilage diseases. Significantly higher MTRasym (B0c&B1c: p=0.002; B0c: p=0.044) and SNR (B0c&B1c: p<0.001; B0c: p<0.001) values in NP compared to AF were obtained with either method of correction. It is consistent with the previous literature findings2, 4.
Conclusion
We have successfully demonstrated that improved quality of gagCEST imaging in IVDs, in terms of increased SNR and higher correlation with the T2 values, can be achieved by applying the WASABI maps for inhomogeneity artefact correction of CEST data. Future studies in patients have to be performed to verify whether both B0 and B1 correction leads to improved diagnostic informations with biochemical cartilage imaging.
Acknowledgements
We thank M. Zaiss (German Cancer Research Center, Heidelberg, Germany) for providing CEST MRI pulse sequence used in this study.References
[1] Ling, W. et. al. Proc Natl Acad Sci U S A 2008;105(7):2266-70. [2] Müller-Lutz, A. et. al. J Magn Reson Imaging 2015;42(6):1517-23. [3] Haneder, S. et. al. Eur Radiol 2013;23(3):861-8. [4] Kim, M. et. al. NMR Biomed 2011;24(9):1137-44. [5] Kim, M. et. al. Magn Reson Med 2009;61(6):1441-50. [6] Wei, W. et. al. Magn Reson Imaging 2014;32(1):41-7. [7] Schuenke, P. et. al. Magn Reson Med 2017;77(2):571-580 [8] Saar, G. et. al. NMR Biomed 2012;25(2):255-61.Figures