5012
Towards Quantification of Manganese Deposition in the Human Brain in the Presence of Iron: A Calibration Study1School of Health Sciences, Purdue University, West lafayette, IN, United States, 2Radiology and Imaging Sciences, Indiana University School of Medicine, Indianapolis, IN, United States
Synopsis
Welders are exposed to high levels of manganese (Mn) and iron (Fe). Since Mn is neurotoxic, being able to quantify brain Mn deposition by MRI is of high interest. This phantom calibration study is a first step towards understanding the combined effect of Mn and Fe on R1. Our results show that the presence of serum in the solution requires a Mn-Fe interaction term to improve the fit, likely due to the competing binding to the protein. The presence of Fe reduces the R1 effect of pure Mn, which would lead to an underestimation of brain Mn if Fe was neglected.
Introduction
Chronic high exposure to manganese (Mn) in occupational settings such as welding is known to cause neurotoxic effects1. Since Mn is a contrast agent in MRI, Mn deposition in the brain can be detected and measured by R1 mapping. To assess a dose-response relationship, it is of high interest to quantify brain Mn deposition. However, Mn-exposed welders are typically also exposed to considerable concentrations of iron (Fe). Fe competes for the same metal transporter with Mn and likely presents a confounding variable when assessing brain Mn accumulation by MRI2. Therefore, a model that can describe the interaction of Mn and Fe in a tissue-like environment is needed to better understand the combined effect of the two metals on R1. In this study, we imaged phantoms with various Mn and Fe concentrations, with and without fetal bovine serum (FBS), to validate an empirical model which considers an interaction term of Fe and Mn.
Methods
Phantom preparation
Three groups of phantoms were prepared mimicking in vivo-like Mn and Fe concentrations. Series A contained only MnCl2 (range: 0.0045-0.9 mM) solved in 1.5 mL FBS; series B contained only FeCl2 (range: 0.01-4.5 mM) solved in 1.5 mL FBS; and series C, containing various combinations of Mn and Fe solved in same amount of FBS. All solutions were prepared in the 1.5 mL microcentrifuge tube. Control series without serum were created with the same concentrations of Mn or Fe as series A-C in deionized water.
MRI measurement
An R1 map was acquired on a 3T Siemens Prisma scanner with a 64-channel head coil at 18°C by using two 3D volume interpolated GRE sequences (TR/TE: 7.1/2.5ms, flip angles: 2°, 9°, resolution: 1x1x1mm3, 5 averages, acquisition matrix: 192×192) and a B1 map, used to correct RF inhomogeneity. T1 maps were calculated in Matlab (Mathworks, MA).
Modeling of Relaxivity
The following empirical equation was used to describe the relationship between Mn, Fe and the R1 relaxation rates:
R1=R0solution+ rMnsolution [Mn] + rFesolution [Fe] + rMn-Fesolution ([Mn][Fe])
This equation contains linear and independent contributions of each metal, as well as a cross term. R1 is the measured relaxation rate (1/s) from the data. R0 is the measured relaxation rate in the absence of metals. [Mn] and [Fe] are the concentrations of Mn or Fe in mM, respectively. The respective relaxivities for Mn and Fe alone are rMn and rFe. The relaxivity value reflecting a potential interaction between Mn and Fe is rMnFe. Considering different relaxation properties of bound and free Mn and Fe, the relaxivities depend on the solution (with/without serum). The data from series A and series B was fit to series C to find the interaction term.
Results
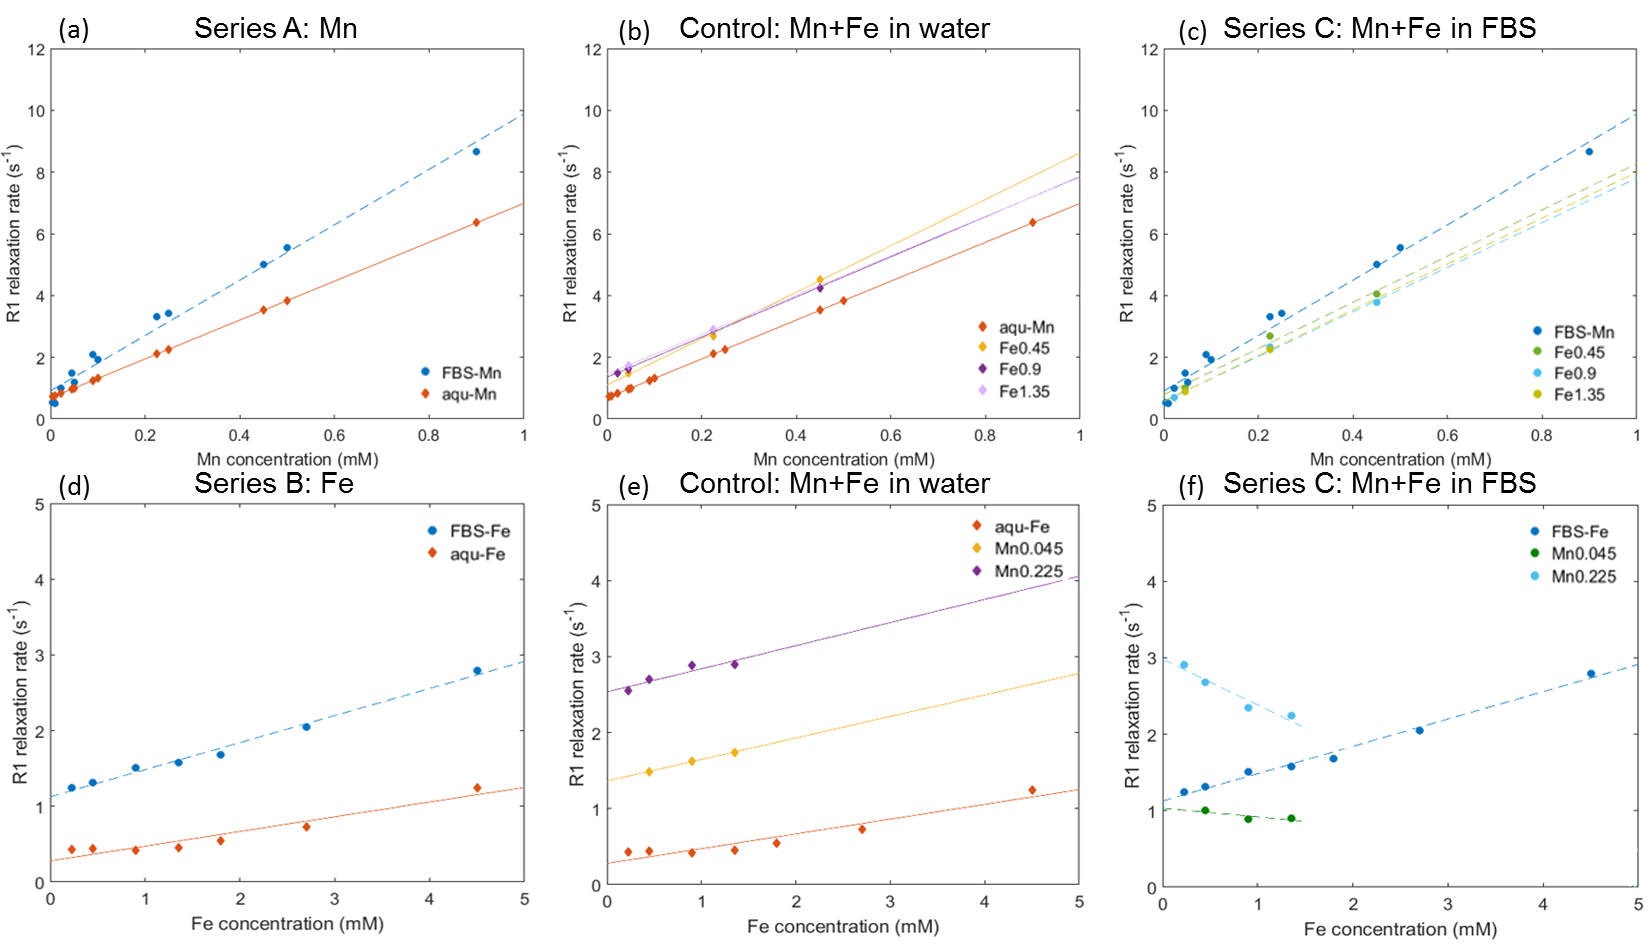
The measured relaxation rates for all the mixtures of Mn and Fe are shown in Figure 1. In the Mn-only solutions (Series A), R0water is found to be 0.72 s-1 and R0FBS is 0.84 s-1. R1 increases linearly with Mn concentration, with slopes of rMnFBS = 9.1 s-1mM-1 and rMnwater = 6.2 s-1mM-1. Equally, fitting the slopes of Series B data (Fe only) yields rFeFBS = 0.19 s-1mM-1 and rFewater = 0.46 s-1mM-1. In the water solution, the relaxivities of Mn and Fe are simply additive, as shown in Fig.1b and Fig.1d. However, if Fe is added to Series A in FBS solution (Series C), R1 of the mixture (green and cyan) decreases with increasing Fe concentration compared to pure Mn solution (dark blue), but maintains nearly the same positive slope. When adding Mn to the Fe-series in FBS, the same effect is visible: The increase of R1 due to Mn gets reduced with increasing Fe concentration in the mixture. The regression model gives a relaxivity cross term of rMnFe = -2.0 s-1mM-1 in FBS solution, which shows a considerable contribution of a Mn-Fe interaction to the R1 relaxation rate in serum.Discussion and Conclusion
Our results show that Mn solved in FBS (allowing for potential binding of metal ions to proteins) has a higher relaxivity3 than in aqueous solution4, which can be explained by more of the Mn ions being bound to complex protein structures5. As fig.1c and 1f suggest, competition for the binding sites with Fe will decrease the high relaxivity of Mn and thus the effect of Fe on the quantification of Mn through R1 mapping should not be fully ignored. Repeating the same study for a second contrast measurement, e.g. R2*, will allow us to estimate both brain [Mn] and [Fe], which is important since welding fumes contain both high amounts of Mn and Fe. Finally, future experiments will need mass spectrometry to measure actual binding affinity in the solutions that better resemble the interstitial brain milieu.Acknowledgements
Supported by NIEHS R01ES020529.References
1. Chang Y, Woo S-TT, Kim Y, et al. Pallidal index measured with three-dimensional T1-weighted gradient echo sequence is a good predictor of manganese exposure in welders. J Magn Reson Imaging. 2010;31(4):1020-1026. doi:10.1002/jmri.22104.
2. Bjørklund G, Aaseth J, Skalny A V., Suliburska J, Skalnaya MG, Nikonorov AA, et al. Interactions of iron with manganese, zinc, chromium, and selenium as related to prophylaxis and treatment of iron deficiency. J Trace Elem Med Biol. 2017;41(8610):41–53.
3. Kang YS, Gore JC, Armitage IM. Studies of factors affecting the design of NMR contrast agents: manganese in blood as a model system. Magn Reson Med. 1984;1(3):396–409.
4. Yilmaz A, Koylu MZ, Uysal E. Proton NMR relaxation in albumin solutions doped with Mn(II). Appl Magn Reson [Internet]. 2009 May 15;35(4):601–12.
5. Yushmanov VE, Tominaga TT, Borissevitch IE. Binding of manganese and iron tetraphenylporphine sulfonates to albumin is relevant to their contrast properties. Orig Contrib Magn Reson Imaging. 1996;14(3):255–61.
Figures