5011
Exploring the Origin of Asymmetries in the Balanced SSFP Profile at 9.4 Tesla: Microstructure Anisotropy or Chemical Exchange?1High Field Magnetic Resonance, Max Planck Institute for Biological Cybernetics, Tübingen, Germany, 2German Center for Neurodegenerative Diseases, Bonn, Germany, 3Department of Biomedical Magnetic Resonance, University of Tübingen, Tübingen, Germany
Synopsis
The balanced steady-state free precession (bSSFP) profile is known to carry information about the tissue-dependent frequency content in a voxel. There has been strong evidence that the observed asymmetries in the bSSFP profile of white matter depend on the tract orientation with the largest asymmetries occurring in tracts perpendicular to B0. Recently, it was demonstrated that the bSSFP sequence can be used for chemical exchange detection based on profile asymmetries arising in isotropic probes of two exchanging pools. In this work, we explore the question whether exchanging species might contribute to the bSSFP profile asymmetry observed in white matter.
Introduction
The pronounced asymmetries found in the balanced steady-state free precession (bSSFP) frequency profile of white matter (WM) 1 exhibit a strong sensitivity to the orientation of the fiber tracts with respect to B0 2,3. These results suggest a relation to anisotropies in the tissue microenvironment 4. On the other hand, bSSFP imaging was reported to be intrinsically sensitive to chemical exchange processes leading to asymmetric profiles in isotropic probes of exchanging moieties 5. Here, we investigate the bSSFP profile as well as chemical exchange saturation transfer (CEST) experiments in homogenized pig brain tissue to eliminate structural effects.
Methods
Pig brain tissue preparation.
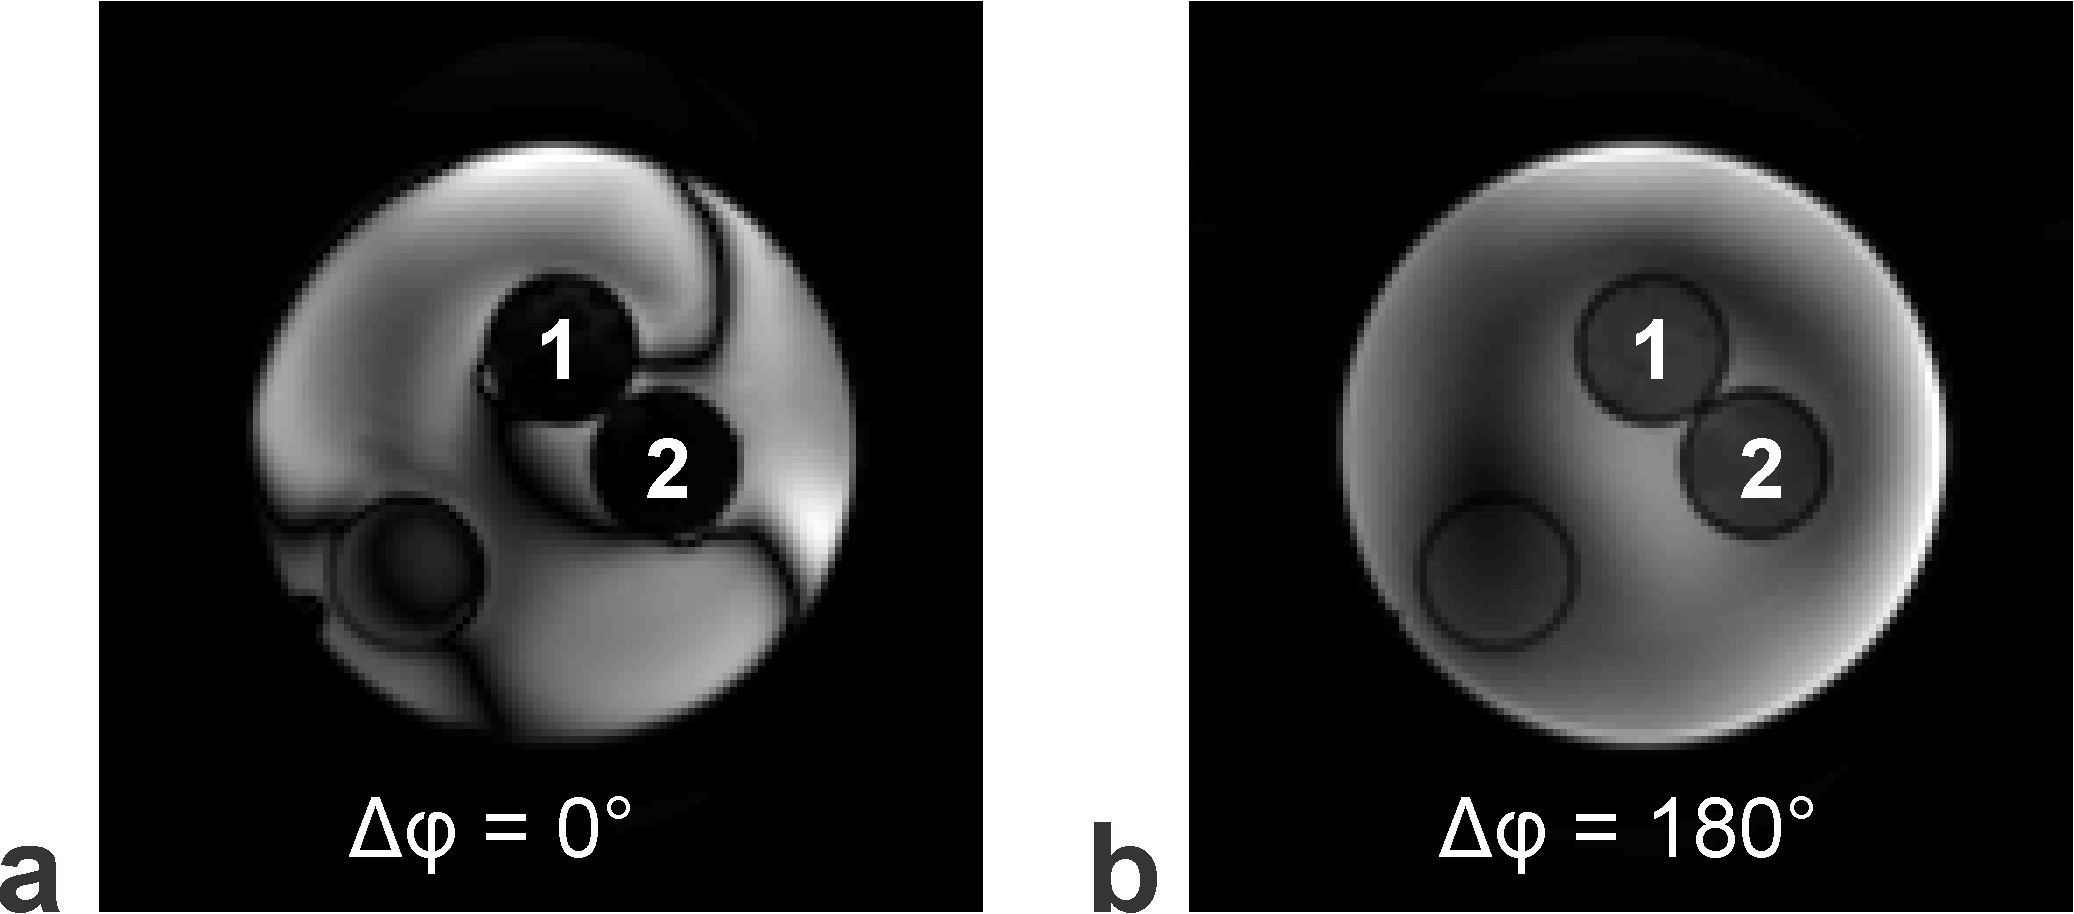
A homogenate (probe 1, cf. Fig. 1) was prepared from the brainstem of pig brains using a tissue grinder (capacity: 40ml, tube length: 215mm, pestle clearance: ~45µm). The obtained homogenized tissue was filled into a 25ml tube. For comparison, a second 25ml tube (probe 2, cf. Fig. 1) was filled with intact brainstem (i.e., intact white matter tracts). It was not ensured to maintain a predominant WM tract orientation in probe 2.
MR acquisition protocol.
The measurements were performed at 9.4T using a custom-built head coil (16 transmit/31 receive channels) 6. 3D bSSFP data were acquired with an in-plane resolution of 1.2x1.2mm2 and a slice thickness of 2mm (TR=3.80ms, matrix size: 130x126x24). The frequency profile was sampled at 60 measurement points using RF phase-cycles which covered a range of 400° in steps of 6.66°, thus ensuring to acquire the entire bandwidth in the presence of frequency drifts. Each phase-cycle acquisition was preceded by 256 dummy pulses. A set of three flip angles (αnom=[7, 9, 11]°) were acquired (scan time/αnom: 16min 11s). The αnom=11°-scan was repeated with negative frequency sweep to exclude transient effects that were seen to cause profile asymmetries 1. CEST imaging was performed with a spectrally but not spatially selective saturation period of 5s (B1,mean=[0.6, 0.9, 1.2]µT) and a subsequent single-shot centric-spiral reordered 3D gradient-echo readout (TR=3.82ms, αnom=5°, in-plane resolution: 1.4x1.4mm2, slice thickness: 2mm, matrix size: 112x112x18, scan time/B1,mean: 5min 32s) 7. B0 and B1 field maps were acquired using the WASABI method 8 and used for B0-/B1-correction 9; T1 maps were derived from adiabatic saturation recovery images.
Assessment of asymmetries.
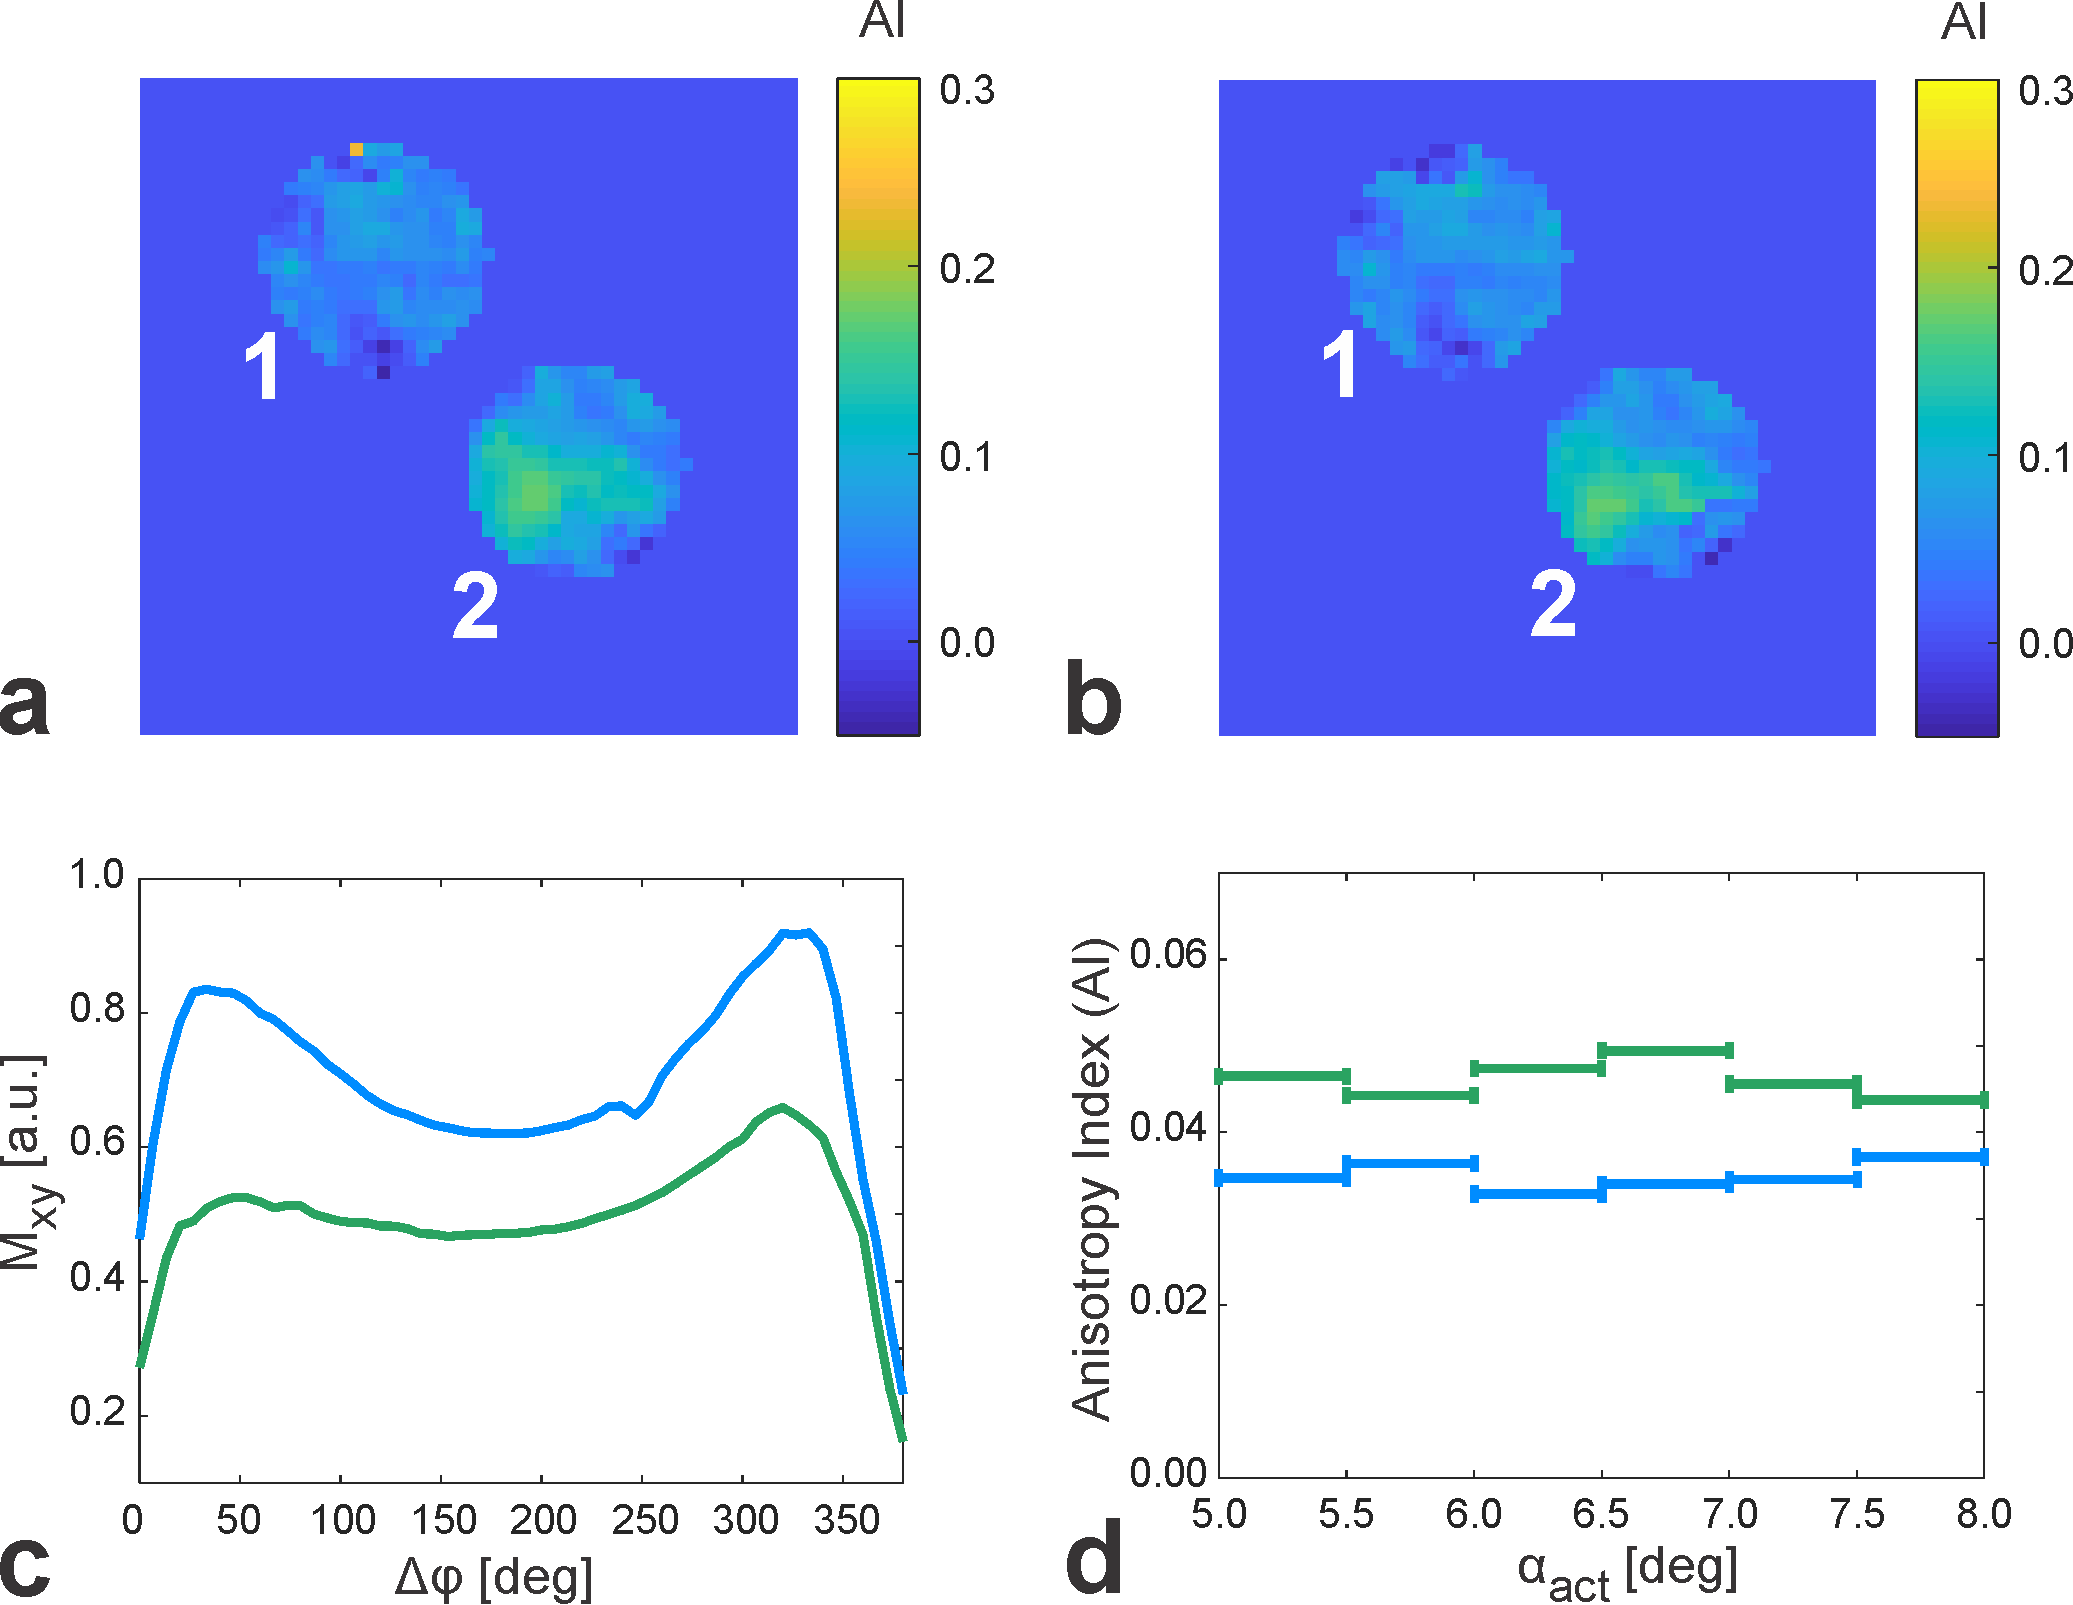
The acquired raw bSSFP profiles were centered (B0-corrected) on a voxel-wise basis 2. Profile asymmetry was defined by the anisotropy index (AI):
$$AI = \frac{h_{p}-h_{n}}{h_{p}+h_{n}}$$
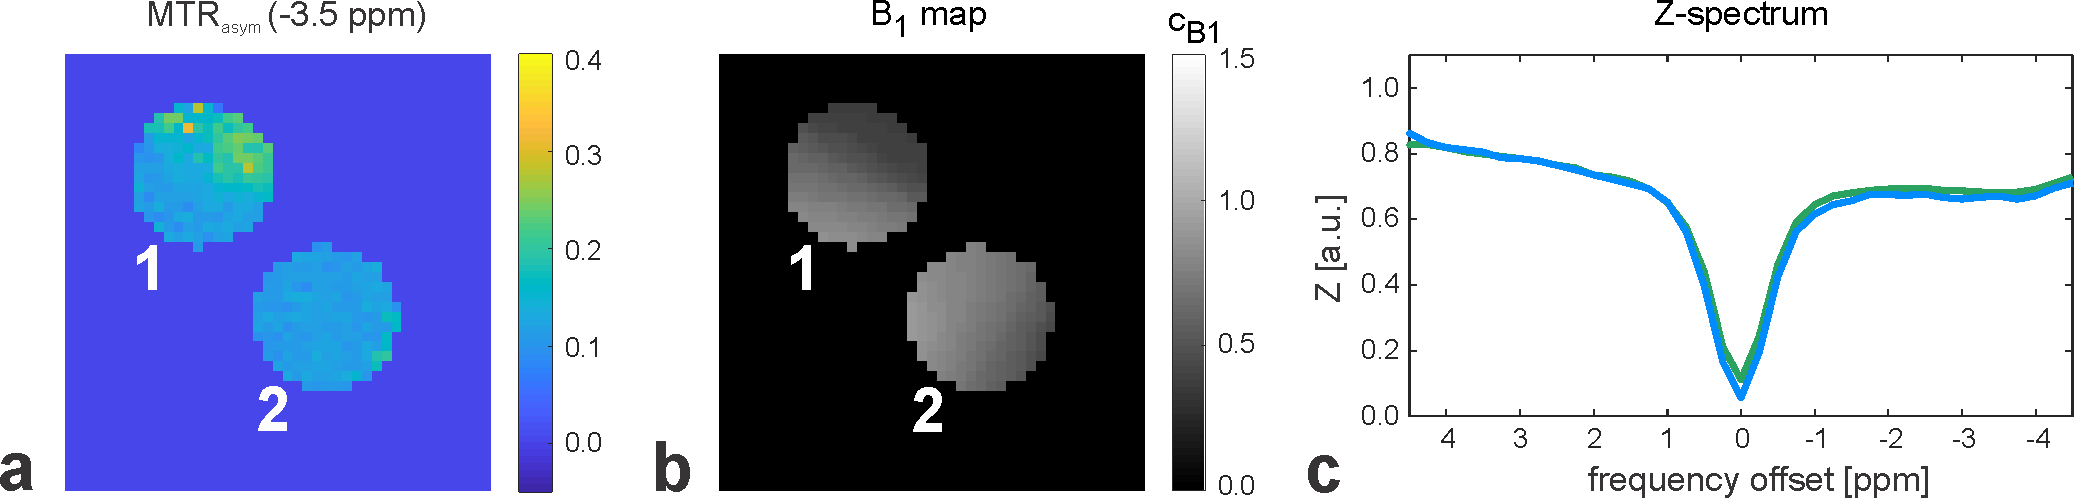
(hp,n: signal peaks at positive (p) and negative (n) frequency offsets relative to the banding 2). To investigate the effect of B1 variations on profile asymmetries, the AI values derived from three scans with varying flip angles were binned according to their actual flip angle αact=cB1·αnom (cB1: B1 scaling factor) and averaged. CEST asymmetry maps (MTRasym) were calculated at -3.5ppm since the Z-spectra are dominated by nuclear Overhauser enhancement (NOE) effects at the used low power (B1,mean=0.6µT).
Results
Figure 1 shows representative phase-cycled bSSFP data acquired in the transition band exhibiting banding (Fig. 1a) and in the pass band (Fig. 1b). Maps of the anisotropy index display regions of increased values in probe 2 (intact brainstem), possibly pointing to a perpendicular WM tract orientation with respect to B0 (Fig. 2a). AI maps derived from bSSFP acquisitions with negative frequency sweep (Fig. 2b) demonstrate high similarity with the corresponding data acquired with positive frequency sweep (Fig. 2a), thus proving consistency in the AI determination and excluding transient effects. The derived bSSFP profiles exhibit an asymmetry in both probes (Fig. 2c). Averaged binned AI values reveal consistently lower mean asymmetries in probe 1 compared to probe 2 (Fig. 2d) with an overall mean across the investigated actual flip angle range of 0.035 (probe 1) and 0.046 (probe 2). Representative MTRasym maps calculated from CEST acquisitions are shown in Figure 3a. The MTRasym-inhomogeneity observed in probe 1 is likely to be caused by a residual B1-bias as there is a drop in B1 in this area (Fig. 3b). The Z-spectra obtained in the two probes agree well (Fig. 3c).Discussion and Conclusion
A small but consistent
bSSFP profile asymmetry is observed in the homogenized probe where fibers are
expected to be randomly distributed and microstructural anisotropy should be
eliminated (AImean=0.035 ≈ 0.2∙AImax, AImax:
maximal anisotropy index in WM obtained from bSSFP data of a pig brain hemisphere / data
not shown here). These preliminary results suggest that chemical exchange
processes might contribute to a small degree to the bSSFP profile asymmetries
observed in white matter in the human brain 2. In conclusion, these
experiments have the potential to deliver more insights into the underlying
mechanisms driving asymmetries in the bSSFP profile.Acknowledgements
No acknowledgement found.References
1. Miller KL. Asymmetries of the balanced SSFP profile. Part I: theory and observation. Magn Reson Med 2010;63:385–395.
2. Miller KL. Asymmetries of the balanced SSFP profile. Part II: white matter. Magn Reson Med 2010;63:385–395.
3. Ehses P, Báez-Yánez MG, Erb M, Scheffler K. Asymmetries of the balanced SSFP profile allow to probe microstructure anisotropy at 9.4 Tesla. Proceedings ISMRM 2017. p 993.
4. Xu T, Foxley S, Kleinnijenhuis M, Chen WC, Miller KL. The effect of realistic geometries on the susceptibility-weighted MR signal in white matter. Magn Reson Med 2017. doi:10.1002/mrm.26689.
5. Zhang S, Liu Z, Grant A, Keupp J, Lenkinski RE, Vinogradov E. Balanced Steady-State Free Precession (bSSFP) from an effective field perspective: Application to the detection of chemical exchange (bSSFPX). J Magn Reson 2017;275:55-67.
6. Shajan G, Kozlov M, Hoffmann J, Turner R, Scheffler K, Pohmann R. A 16-channel dual-row transmit array in combination with a 31-element receive array for human brain imaging at 9.4 T. Magn Reson Med 2014;71:870-879.
7. Zaiss M, Ehses P, Scheffler K. snapCEST – A single-shot 3D CEST sequence for motion corrected CEST MRI. Proceedings ISMRM 2017. p 3768.
8. Schuenke P, Windschuh J, Roeloffs V, Ladd ME, Bachert P, Zaiss M. Simultaneous mapping of water shift and B1 (WASABI) - Application to field-Inhomogeneity correction of CEST MRI data. Magn Reson Med 2017;77:571–580.
9. Windschuh J, Zaiss M, Meissner J-E, Paech D, Radbruch A, Ladd ME, Bachert P. Correction of B1-inhomogeneities for relaxation-compensated CEST imaging at 7 T. NMR Biomed 2015;28(5):529–37.
Figures