5010
Gadoxetate relaxivities increase significantly after hepatic uptake at clinical field strength impacting kinetic modelling for liver function analysis1MR & CT Contrast Media Research, Bayer AG, Berlin, Germany
Synopsis
Schuhmann-Giampieri1 reported r1 of gadoxetate to be significantly higher in liver tissue compared to blood at 0.47T. Gadoxetate relaxivities at 1.5T, 3T and 4.7T have since then been reported for water and plasma2, but not hepatocytes. We here present r1 values for gadoxetate in hepatocytes at 1.5T and 3T to complement existing data. r1 values of gadoxetate after uptake into hepatocytes are about 2x higher compared to blood. There is no relevant field strength dependency over a wide range (0.47T - 3T). This has implications on kinetic modelling of dynamic gadoxetate enhanced MRI data for determination of liver transporter activity.
Purpose
In 1992 Schuhmann-Giampieri1 reported relaxivity r1 of gadoxetate, a GBCA clinically approved for detection and characterization of focal liver lesions, to be significantly higher in liver tissue compared to blood at 0.47T. Gadoxetate relaxivities at 1.5T, 3T and 4.7T have since then been reported for water and plasma2, but not for hepatocytes. We here present r1 relaxivities for gadoxetate in liver tissue at various field strengths to complement existing data. Gadoxetate MR imaging data can be used to determine the activity of liver transporters involved in gadoxetate excretion by applying an appropriate pharmacokinetic model. In that respect accurate knowledge of the tissue relaxivity is important to get hands on the contrast agent tissue concentration needed for kinetic modelling of dynamic MRI data to avoid a systematic error.Methods
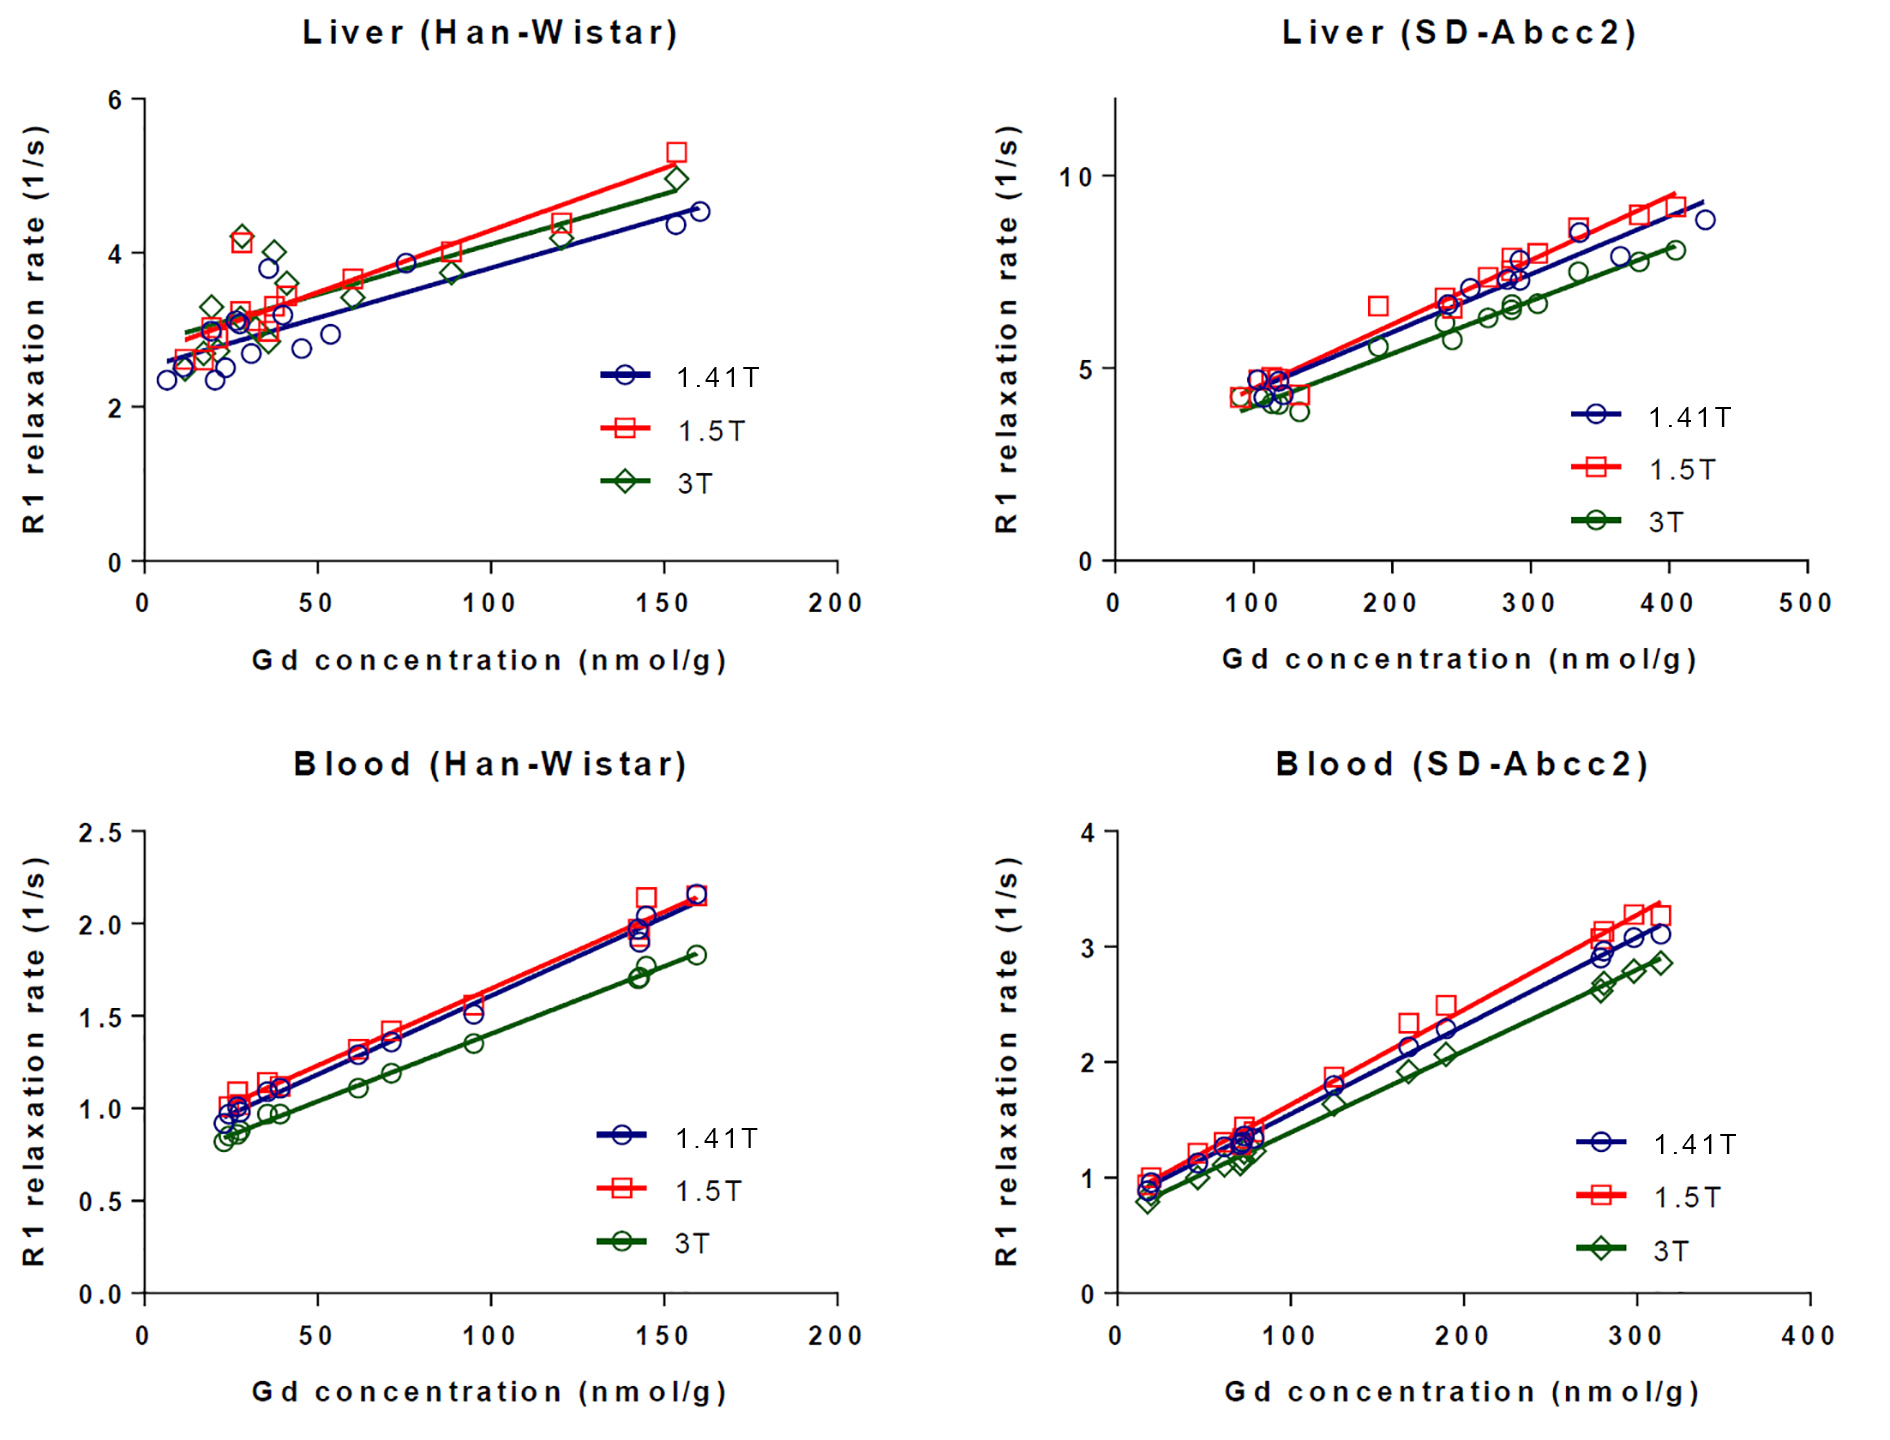
SD- Abcc2 tm1sage (Mrp2 deficient) and Crl:WI(Han) rats were injected with either saline, 10 µmol/kg, 25 µmol/kg or 40 µmol/kg gadoxetate. Bile was collected from cannulated bile duct and urine was collected by a bladder catheter over 30 min before and after gadoxetate injection. Blood was sampled 1 min prior to and 1 min after gadoxetate injection. At 30 min p.i. animals were sacrificed and samples of blood, liver tissue, bile and urine were taken. 3 liver samples were analyzed at 1.41T (60 MHz MiniSpec), 3 different liver samples were analyzed at 1.5T (64 MHz Siemens Avanto MRI) and 3T (128 MHz Philips Intera MRI) immediately after sampling. Blood, bile and urine samples were analyzed at all 3 field strength as well. T1 was determined by the inversion recovery method2 on all 3 devices. After T1 measurements the Gadolinium content of all samples was determined by ICP-AES. Relaxivity r1 was determined from R1 (1/T1) and the Gadolinium concentrations by linear regression.Results
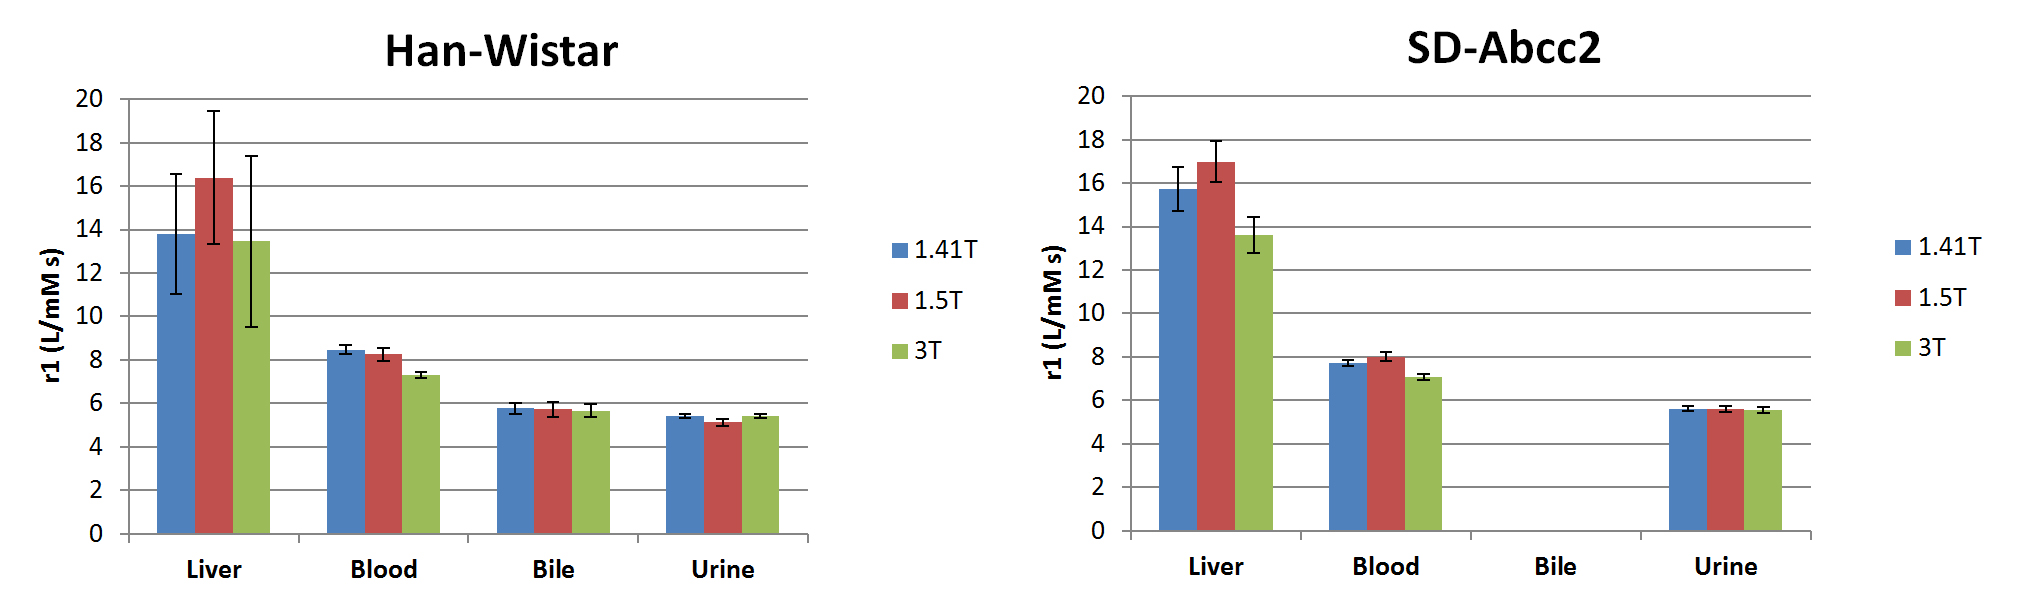
The r1 values of gadoxetate, determined from plots depicted in Fig. 1, after uptake into hepatocytes, are about 2x higher as compared to blood. The values determined for bile and urine are lower than for blood. There was no relevant field strength dependency (see Fig. 2). At 30 min post injection blood levels of Gadolinium decreased to <10% of liver levels in both SD- Abcc2 tm1sage and Crl:WI(Han) rats. Gadolinium liver levels of SD- Abcc2 tm1sage and Crl:WI(Han) rats were similar showing that bile Gadolinium does not significantly contribute to the measured signal intensity.Discussion
Gadoxetate has been clinically approved for detection and characterization of focal liver lesions by CE-MRI. It exhibits moderate protein binding (~10%) and is excreted from the body through the kidneys and by a hepatobiliary pathway at about equal portions (~50%). Hepatocytes take up gadoxetate mainly via OAPT and NTCP transporters and excrete it into the bile mainly utilizing Mrp2. By means of dynamic acquisition of gadoxetate signal intensity (SI) during liver uptake and excretion followed by application of a suitable kinetic model, the activity of the aforementioned liver transporters can be estimated. For kinetic modelling the gadoxetate concentration for each time point is required which can be calculated from the signal intensity if r1 in tissue is known.
Our finding of similar r1 values from SD- Abcc2 tm1sage rats, not excreting gadoxetate into the bile, and Crl:WI(Han) rats together with the low gadoxetate blood levels at time of liver tissue analysis indicate that the determined SI (and thus T1 and r1) originates from hepatocytes only. Our results show that the r1 relaxivity of gadoxetate in hepatocytes is about 2 times higher compared to blood. The gadoxetate liver r1 determined by Schuhmann-Giampieri at 0.47T is in the same range of ~16 L/mM s1. There is no relevant field strength dependency in the r1 values. The data presented indicate that the high r1 relaxivity of gadoxetate in hepatocytes compared to blood are to be taken into account for kinetic modelling approaches with the goal to determine OATP/NTCP and Mrp2 transporter activity. This has so far not been done3, 4.
Acknowledgements
We thank Claudia Heyer and David Hallmann for their excellent technical support and Wolfgang Ebert for his comments on the manuscript.References
1. Schuhmann-Giampieri, G. et al. Preclinical evaluation of Gd-EOB-DTPA as a contrast agent in MR imaging of the hepatobiliary system. Radiology 183, 59-64 (1992).
2. Rohrer, M., Bauer, H., Mintorovitch, J., Requardt, M. & Weinmann, H.J. Comparison of magnetic properties of MRI contrast media solutions at different magnetic field strengths. Invest Radiol 40, 715-724 (2005).
3. Georgiou, L. et al. Quantitative Assessment of Liver Function Using Gadoxetate-Enhanced Magnetic Resonance Imaging: Monitoring Transporter-Mediated Processes in Healthy Volunteers. Invest Radiol 52, 111-119 (2017).
4. Ulloa, J.L. et al. Assessment of gadoxetate DCE-MRI as a biomarker of hepatobiliary transporter inhibition. NMR Biomed 26, 1258-1270 (2013).
Figures