5009
Multi-site reproducibility of quantitative susceptibility mapping at 1.5, 3 and 7T1Radiology, Weill Cornell Medicine, New York, NY, United States, 2University Of Chicago Medicine, Chicago, IL, United States, 3Department of Medical Physics, University of Wisconsin–Madison, Madison, WI, United States, 4Leiden University Medical Center, Leiden, Netherlands, 5Radioogy, Weill Cornell Medicine, New York, NY, United States, 6Weill Cornell Medicine, New York, NY, United States
Synopsis
Quantitative susceptibility mapping (QSM) is increasingly being applied to quantitative research on disease conditions including intracerebral hemorrhage, liver iron overload and bone mineral quantification. These applications require knowledge of the reproducibility of QSM of sources with high susceptibility, which has not been previously reported. Here, we investigate the agreement between QSM maps generated from gradient-echo scans acquired at multiple sites using multiple platforms.
Purpose
Quantitative susceptibility mapping (QSM) is increasingly being applied to quantitative research on disease conditions including intracerebral hemorrhage, liver iron overload and bone mineral quantification [1]. These new applications require knowledge of the reproducibility of QSM of sources with high susceptibility. Here, we investigate the agreement between QSM maps generated from gradient-echo scans acquired at multiple sites using multiple platforms.
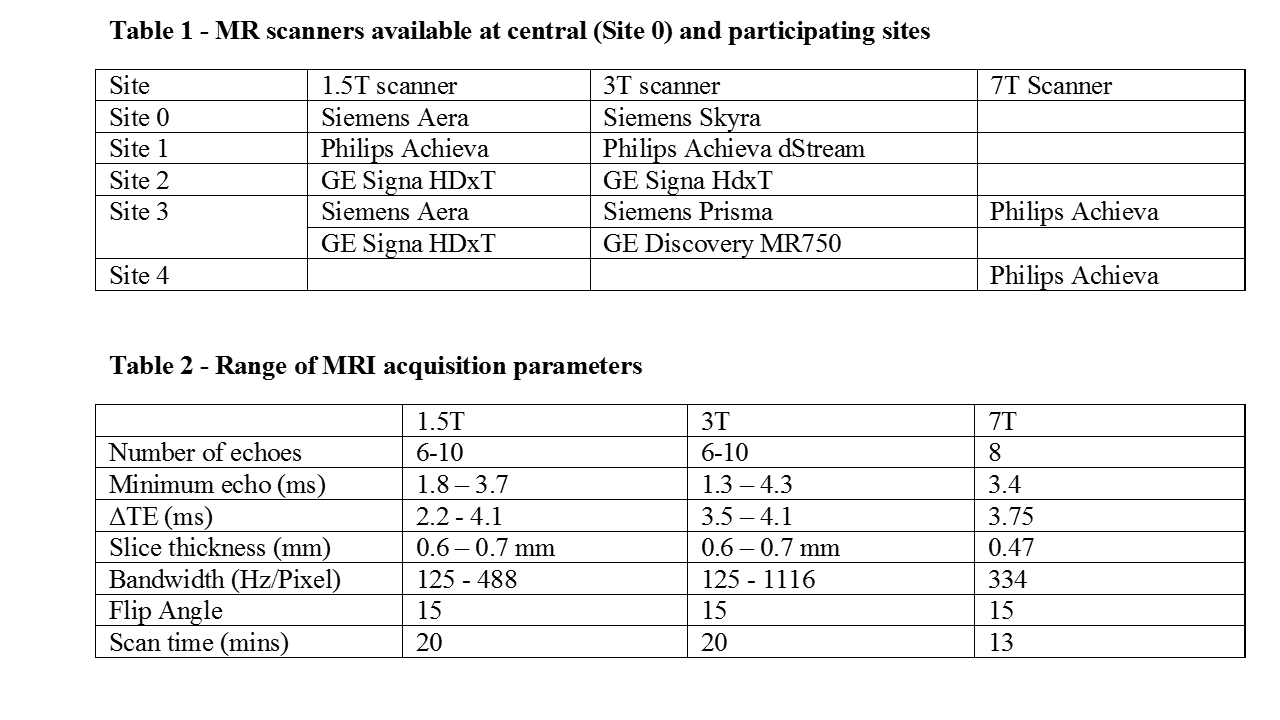
Methods
Five identical phantoms were constructed and imaged at the primary study site, and four were shipped to four collaborating sites. Each phantom contained five balloons, each completely filled with a solution of gadolinium (Magnevist, Berlex Laboratories, Wayne, NJ) of varying concentrations (10, 5, 2.5, 1.25 or 0.625 mmol/L), and immersed in 1% agarose gel in a 16-ounce cylindrical plastic container. The gadolinium concentrations were selected to be representative of high susceptibility sources encountered in QSM applications, which can be as high as 3.2 ppm [2,3]. T2*-weighted acquisitions of the phantom, placed in a head coil, were performed on the scanners available at each site (Table 1) using the 3D multi-echo spoiled gradient-echo (SPGR) sequence available on the scanner and a range of imaging parameters specified in Table 2. The complex DICOM data was electronically transmitted to the coordination site for QSM reconstruction. A field map was obtained from the DICOM data using a non-linear voxel-wise fit with a correction to remove residual echo-to-echo phase inconsistencies in the readout direction when present. Quality guided field unwrapping and Laplacian Boundary Value (LBV) background field removal [1] were applied to obtain the local field map from which the QSM map was reconstructed using the MEDI+0 method [3], which minimized variation in the agarose gel medium of the phantom according to the expression:
$$\chi^\ast\ \ = argmin_\chi\ \ 1/2\ ‖w(e^{-if}-e^{-i(d*χ) } )‖_2^2+λ_1 ‖M_G ∇χ‖_1+λ_2 ‖M_{AGAROSE} (χ-\overline{χ_{AGAROSE}} )‖_2^2$$
where $$$\chi$$$ is the susceptibility map, * is the convolution operation, w is noise weighting, f the measured local field, $$$\nabla$$$ the gradient operator, and $$$M_G$$$ a binary edge mask. The term, $$$\overline{χ_{AGAROSE}}$$$, penalizes susceptibility variation within the agarose gel medium, which can be isolated using a mask, $$$M_G$$$ , derived from the magnitude image, in a search for a solution with homogenous agarose susceptibility. The regularization values and were determined using L-curve plot analysis. The susceptibility in each balloon was estimated as the mean voxel value in a 60 $$$mm^3$$$ spherical region of interest (ROI) referenced to the mean voxel value in a large ROI drawn in the 1% agarose gel. The agreement between susceptibility estimates from different sites was evaluated using linear regression of QSM measurements against prepared gadolinium concentrations and Bland-Altman analysis to determine the 95% limits of agreement (average difference ± 2 × standard deviation of difference) for each pair of scans.
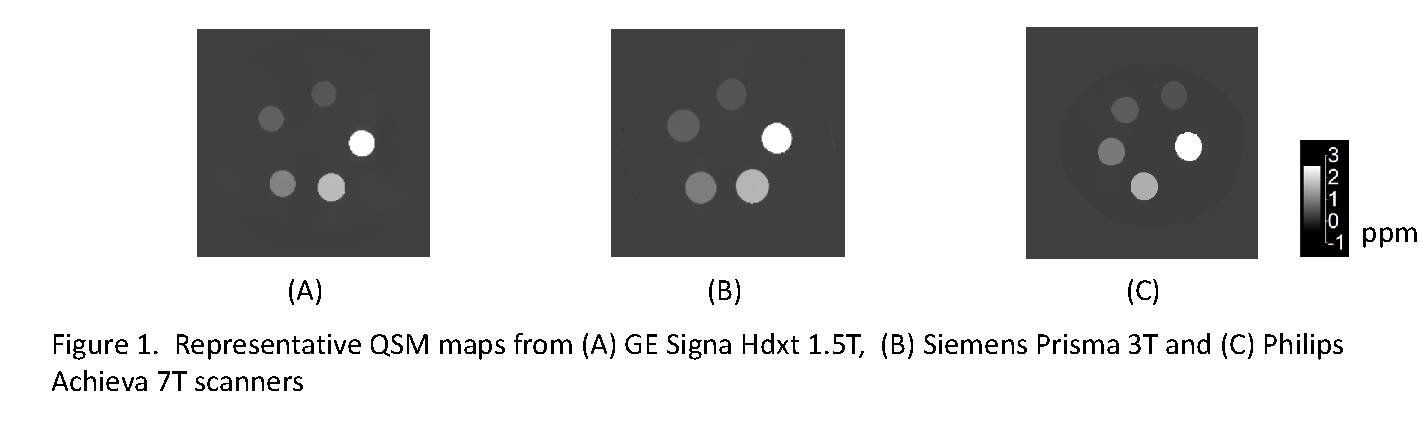
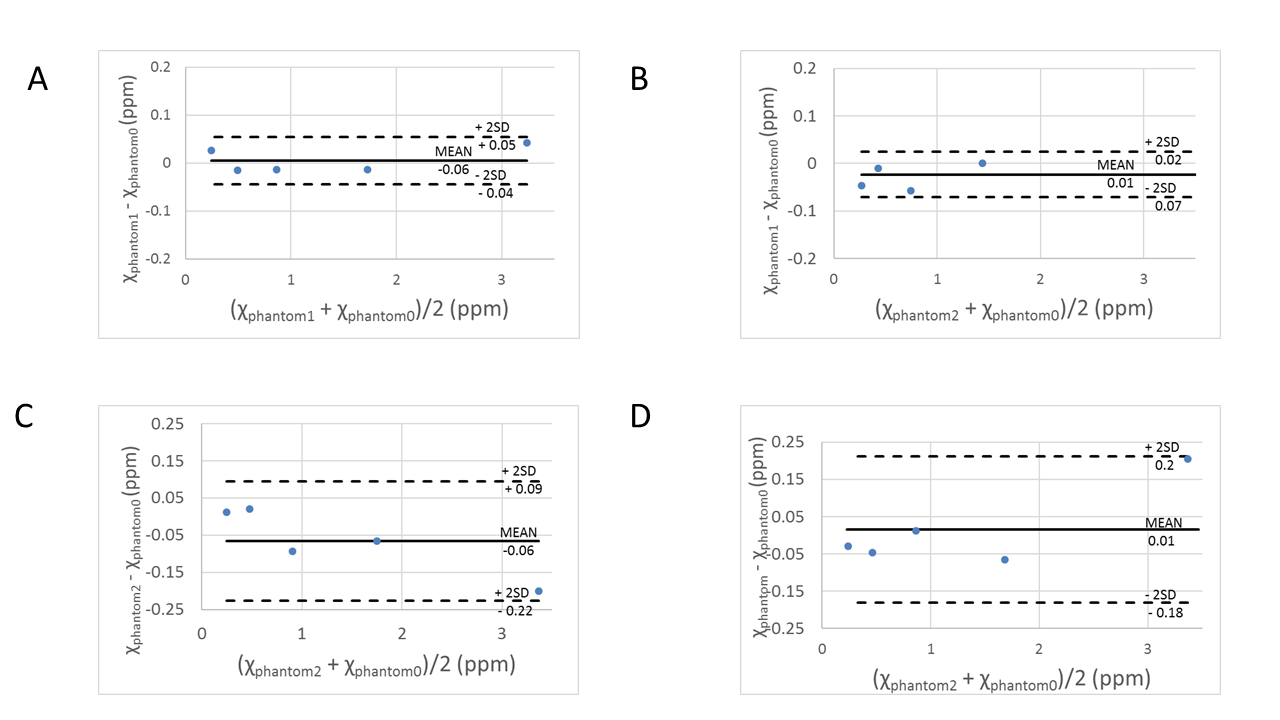
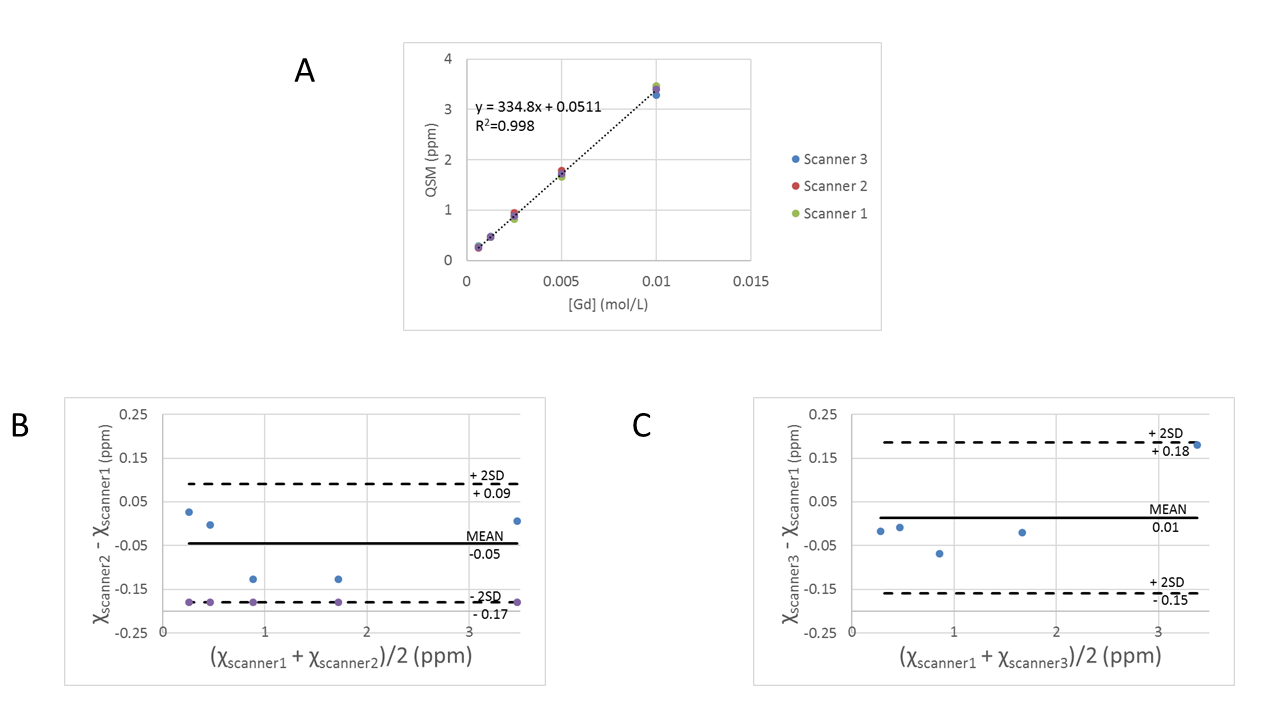
Results
High quality QSM maps with similar visual appearance were reconstructed for all sites (Fig. 1). The pooled standard deviation for all QSM performed at Site 0 was 102 ppb. This was equal to the pooled standard deviation for data from all sites. BA analysis for 3T scanners gave minimum and maximum limits of agreement of 47 and 212 ppb respectively. The QSM estimates showed a linear increase with Gd concentration for all scanners. Slopes for plots of gadolinium concentrations gave slopes of 329 ± 3 ppm L/mol (Phantom 1), 324 ± 4 ppm L/mol (Phantom 2), 325 ± 4 ppm L/mol (Phantom 3), 334 ± 5 ppm L/mol (Phantom 4), all with correlation coefficients (r2 ) > 0.99 (Fig.. These values agree well with previous measurements of gadolinium susceptibility measurement using QSM [1].Discussion
Good reproducibility was obtained for QSM measurements of gadolinium concentrations in agarose gel phantoms scanned at 1.5, 3 and 7T. The maximum limits of agreement from Bland-Altman analysis (~200 ppb) was much smaller that the differences reported between normal and disease conditions, such as for iron overload [3], suggesting QSM can be used to reliably compare diagnoses at different sites. In this study, gadolinium was used instead of a ferumoxide such as ferumoxytol, because the magnetization of ferumoxides is saturated at 1 Tesla [4], unlike that of ferritin and hemosiderin. Therefore, QSM of gadolinium phantoms is the same at 1.5, 3 and 7 T, and more closely mimics iron overload in vivo.Conclusion
QSM in Gd phantoms was performed using the MEDI+0 algorithm with high reproducibility over a large range of susceptibility values. Similar multi-center studies in humans can be performed to further confirm reproducibility in vivo.Acknowledgements
No acknowledgement found.References
[1]Wang, MRM, 73: 82, 2014, [2] Liu, MRM, 78, 303, 2017 [3] Sharma, MRM,74, 673, 2015, [4] Barick, JMC, 19,7023, 2009Figures