5008
Clinical Implementation of Quantitative Susceptibility Mapping: Experience Across Multiple Sites and Scanner Platforms.1Radiology, Weill Cornell Medical College, New York, NY, United States, 2Meinig School of Biomedical Engineering, Cornell University, Ithaca, NY, United States, 3Radiology, Tongji Hospital, Wuhan, China, 4Radiology, Charité Universitätsmedizin Berlin, Berlin, Germany, 5Radiology, Larner College of Medicine, The University of Vermont, Burlington, VT, United States, 6Center for Magnetic Resonance in Biology and Medicine, Aix Marseille Université, Marseille, France, 7Radiology, University of Melbourne, Melbourne, Australia, 8Division of Movement Disorders, Department of Neurology, Icahn School of Medicine at Mount Sinai, New York, NY, United States, 9Department of Neurosurgery, Icahn School of Medicine at Mount Sinai, New York, NY, United States, 10Department of Psychiatry, Icahn School of Medicine at Mount Sinai, New York, NY, United States, 11Department of Neuroscience, Icahn School of Medicine at Mount Sinai, New York, NY, United States, 12Toulouse NeuroImaging Center, Université de Toulouse, Toulouse, France
Synopsis
In recent years, quantitative susceptibility mapping (QSM) has undergone a series of technical improvements and found applications in an expanding array of diseases. To support this ongoing process of development and validation, it is important to automate the computationally intensive susceptibility reconstruction on the scanner after the acquisition of gradient echo data. In this work, an online QSM reconstruction system for a variety of scanner platforms with low cross-site ROI standard deviation is demonstrated.
Introduction
Quantitative susceptibility mapping (QSM) allows the quantitative measurement of spatial susceptibility bio-distribution (1). Especially in the brain, QSM technology is at the stage where it can be disseminated widely for clinical applications, which predominantly involve either iron or calcium (2). To facilitate this clinical translation of QSM, this work proposes a robust automated high accuracy QSM reconstruction method suitable for inclusion in routine clinical MRI protocols that is scanner platform independent.Methods
Software
The nonlinear Morphology Enable Dipole Inversion (MEDI) method (3) was implemented in C++ using the Intel Math Kernel Library (MKL) (4) for linear algebra operations and FFT, and the DCMTK toolkit library (5) for DICOM input and output. It performed the following steps:
1. The complex GRE signal was read from DICOM images. Siemens (Erlangen, Germany), General Electric (Waukesha, WI), Philips (Eindhoven, The Netherlands) and Bruker (Billerica, MA) scanners are supported.
2. A nonlinear fit of the field was performed using the Levenberg-Marquardt algorithm (6).
3. Image quality guided unwrapping (7) was performed.
4. Brain masking was performed using BET in the FSL toolkit (8,9).
5. The R2* map was computed using ARLO (10).
6. The ventricular cerebral spinal fluid (CSF) mask was computed from R2* (11).
7. The background field was removed using PDF (12).
8. The nonlinear MEDI (3) with CSF zero referencing (11) was used to obtain the susceptibility map (in ppm).
9. The average CSF susceptibility was subtracted from this map.
10.The map was exported to DICOM.
The QSM reconstruction server consisted of a DICOM server (5), which started a new sub process for each connection to allow the receiving images from multiple origins simultaneously. The DICOM protocol was chosen since this is implemented on all scanners and requires nothing more than the setting up of DICOM destination (node) on the scanner. The technologist was then able to send the GRE images immediately after the scan to the QSM reconstruction server. The server then checked whether the data set was complete and contained complex GRE images, after which the C++ program above was invoked on this data. The resulting QSM images were then sent back to the originating scanner. The QSM reconstruction server has been tested on Linux (Ubuntu 16.04, Redhat 7.0) and Mac OSX.
Data acquisition
The QSM reconstruction server was installed at 8 sites (see Table 1). Between June 2017 and October 2017, a single healthy subject (male, 52 years old) visited each site and was scanned using both a medium (MeRes) and high resolution (HiRes) GRE protocol at 3T (Table 2).
Image analysis
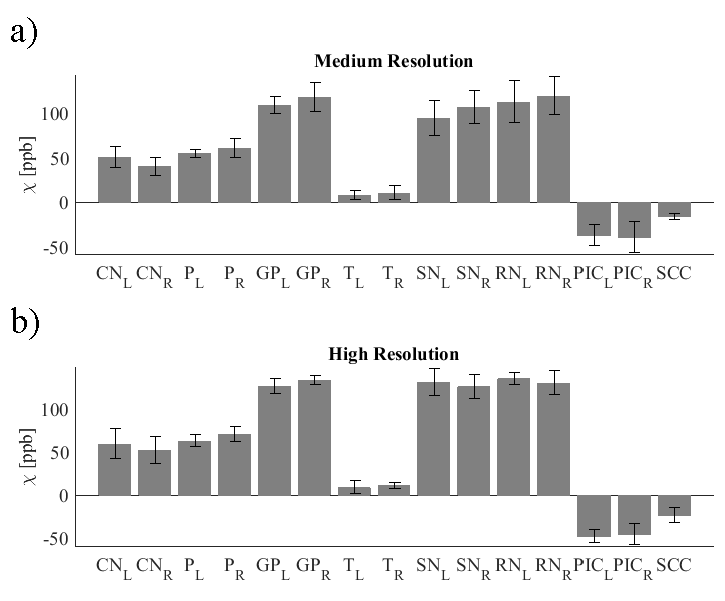
For each acquisition, the magnitude images were registered to a reference magnitude image taken from the high resolution protocol at site #3 (see Table 1) using the FLIRT tool (9). On the susceptibility map obtained with the high resolution protocol at site #3, a neuroradiologist (SZ, 6 years of experience) segmented the following regions of interest (ROI): Caudate Nucleus (CN), Putamen (P), Globus Pallidus (GP), Thalamus (T), Substantia Nigra (SN), Red Nucleus (RN), Posterior limb of the Internal Capsule (PIC), and Splenium of Corpus Callosum (SCC). These ROIs were then registered back to each of the susceptibility reconstructions. For each susceptibility map, the mean over each ROI was recorded and their average and standard deviation across scans were to assess reproducibility.
Results
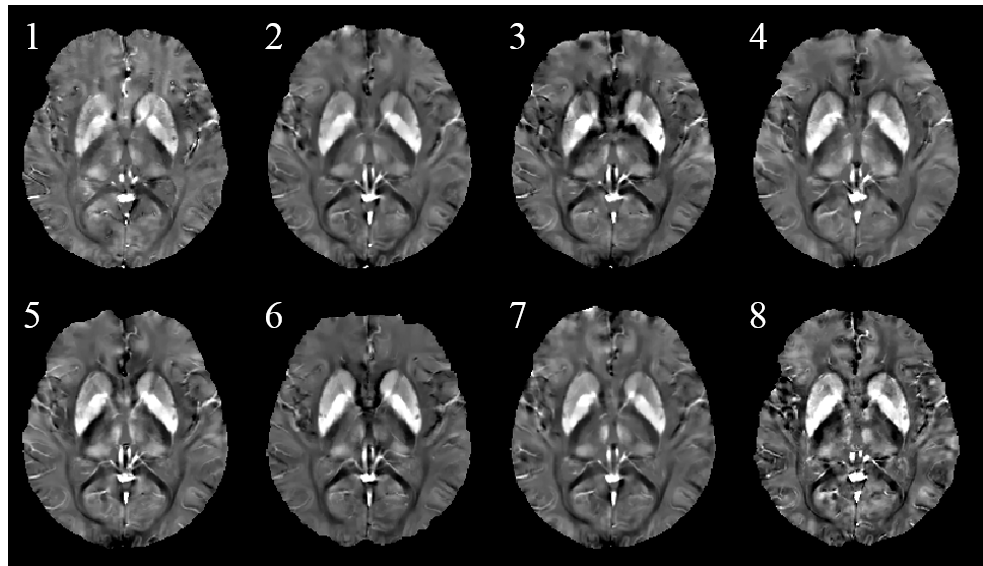
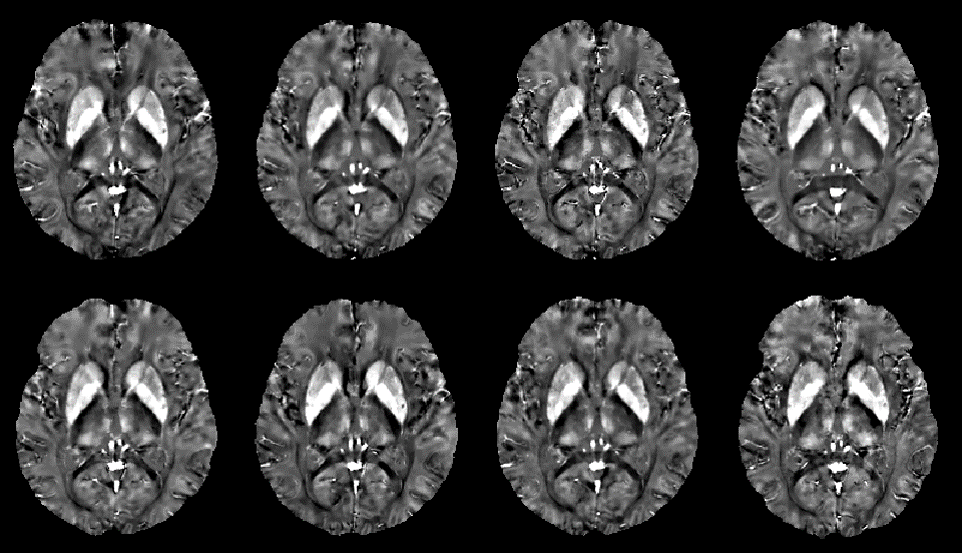
Susceptibility maps were obtained in all cases. Reconstruction times were 5min (MeRes) and 10min (HiRes). Figure 1 shows an MeRes axial slice of susceptibility maps through the midbrain of the subject. A good visual correspondence across the brain between the 8 sites is observed. The corresponding HiRes images are shown in Figure 2. ROI based reproducibility across scanners in the same subject is shown in Figure 3. ROI standard deviation across the 8 scans ranged between 3.4ppb and 23.3ppb (MeRes) and between 3.5ppb and 17.3ppb (HiRes), consistent with previously reported QSM reproducibility (13)Discussion
The results presented demonstrate the feasibility of a clinically practical implementation of the quantitative susceptibility mapping of the brain. The same subject was scanned on three different platforms at seven different sites. Region of interest analysis revealed good reproducibility across the different scanners and sites. The computational cost of the presented QSM reconstruction is driven by the desire to achieve high accuracy, leading to the use of an iterative reconstruction. Approximations to the data fidelity or regularization terms that allow significant speed-ups (14,15) can lead to smoothing artifacts and underestimation (16,17).Conclusion
This work demonstrates a clinically practical online QSM reconstruction method for a variety of scanner platforms with low cross-site ROI standard deviation.Acknowledgements
This work was supported by NIH R01CA181566, R01NS090464, R01NS095562, and R01NS072370.References
1. Wang Y, Liu T. Quantitative susceptibility mapping (QSM): Decoding MRI data for a tissue magnetic biomarker. Magnetic resonance in medicine 2015;73(1):82-101, PMCID: 4297605
2. Wang Y, Spincemaille P, Liu Z, Dimov A, Deh K, Li J, Zhang Y, Yao Y, Gillen KM, Wilman AH, Gupta A, Tsiouris AJ, Kovanlikaya I, Chiang GC, Weinsaft JW, Tanenbaum L, Chen W, Zhu W, Chang S, Lou M, Kopell BH, Kaplitt MG, Devos D, Hirai T, Huang X, Korogi Y, Shtilbans A, Jahng GH, Pelletier D, Gauthier SA, Pitt D, Bush AI, Brittenham GM, Prince MR. Clinical quantitative susceptibility mapping (QSM): Biometal imaging and its emerging roles in patient care. Journal of magnetic resonance imaging : JMRI 2017;46(4):951-971, PMCID: 5592126
3. Liu T, Wisnieff C, Lou M, Chen W, Spincemaille P, Wang Y. Nonlinear formulation of the magnetic field to source relationship for robust quantitative susceptibility mapping. Magnetic resonance in medicine 2013;69(2):467-476,
4. Intel Math Kernel Library. https://software.intel.com/en-us/mkl.
5. DCMTK - DICOM Toolkit. http://dicom.offis.de/dcmtk.php.en.
6. Nocedal J, Wright SJ. Numerical optimization. New York: Springer; 2006. xxii, 664 p. p.
7. Cusack R, Papadakis N. New robust 3-D phase unwrapping algorithms: application to magnetic field mapping and undistorting echoplanar images. NeuroImage 2002;16(3 Pt 1):754-764,
8. Smith SM. Fast robust automated brain extraction. Human brain mapping 2002;17(3):143-155,
9. Jenkinson M, Beckmann CF, Behrens TE, Woolrich MW, Smith SM. Fsl. NeuroImage 2012;62(2):782-790,
10. Pei M, Nguyen TD, Thimmappa ND, Salustri C, Dong F, Cooper MA, Li J, Prince MR, Wang Y. Algorithm for fast monoexponential fitting based on Auto-Regression on Linear Operations (ARLO) of data. Magnetic resonance in medicine 2015;73(2):843-850, PMCID: 4175304
11. Liu Z, Spincemaille P, Yao Y, Zhang Y, Wang Y. MEDI+0: Morphology enabled dipole inversion with automatic uniform cerebrospinal fluid zero reference for quantitative susceptibility mapping. Magnetic resonance in medicine 2017,
12. Liu T, Khalidov I, de Rochefort L, Spincemaille P, Liu J, Tsiouris AJ, Wang Y. A novel background field removal method for MRI using projection onto dipole fields (PDF). NMR in biomedicine 2011;24(9):1129-1136, PMCID: 3628923
13. Deh K, Nguyen TD, Eskreis-Winkler S, Prince MR, Spincemaille P, Gauthier S, Kovanlikaya I, Zhang Y, Wang Y. Reproducibility of quantitative susceptibility mapping in the brain at two field strengths from two vendors. Journal of magnetic resonance imaging : JMRI 2015;42(6):1592-1600, PMCID: 4661140
14. Bilgic B, Chatnuntawech I, Fan AP, Setsompop K, Cauley SF, Wald LL, Adalsteinsson E. Fast image reconstruction with L2-regularization. Journal of magnetic resonance imaging : JMRI 2014;40(1):181-191, PMCID: 4106040
15. Bilgic B, Fan AP, Polimeni JR, Cauley SF, Bianciardi M, Adalsteinsson E, Wald LL, Setsompop K. Fast quantitative susceptibility mapping with L1-regularization and automatic parameter selection. Magnetic resonance in medicine 2014;72(5):1444-1459, PMCID: 4111791
16. Wang S, Liu T, Chen W, Spincemaille P, Wisnieff C, Tsiouris AJ, Zhu W, Pan C, Zhao L, Wang Y. Noise Effects in Various Quantitative Susceptibility Mapping Methods. IEEE transactions on bio-medical engineering 2013;60(12):3441-3448, PMCID: 5553691
17. Wang S, Chen W, Wang C, Liu T, Wang Y, Pan C, Mu K, Zhu C, Zhang X, Cheng J. Structure Prior Effects in Bayesian Approaches of Quantitative Susceptibility Mapping. BioMed research international 2016;2016:2738231, PMCID: 5206478 publication of this paper.
Figures