5007
Quantitative assessment of melanoma metastases at 7T: Susceptibility and T1 mapping1Medical Physics in Radiology, German Cancer Research Center (DKFZ), Heidelberg, Germany, 2Radiology, University Hospital Erlangen, Erlangen, Germany, 3Radiology, German Cancer Research Center (DKFZ), Heidelberg, Germany, 4Neuroradiology, University of Heidelberg, Heidelberg, Germany
Synopsis
Susceptibility values and T1 values of melanoma metastases measured at 7T are shown. There is an ongoing discussion about whether melanin or hemorrhage dominate the contrast mechanisms observed in melanoma metastases. Susceptibility maps as well as T1 maps benefit from the high contrast and high resolution available at 7T, though we observed paramagnetic susceptibility in areas corresponding to vessels or hemorrhagic events, but no general relation between susceptibility values and T1 values of individual metastases
Introduction
According to their appearance in magnetic resonance imaging (MRI), melanoma metastases have been categorized as showing a melanotic pattern, an amelanotic pattern or other patterns; for the melanotic pattern, high signal intensity in T1-weighted (T1w) images is characteristic1, 2. The T1-shortening effect of melanin is thought to be based on binding of paramagnetic metal ions3. Hemorrhagic metastases and hemorrhages can, however, show similar hyperintensities in the T1w signal depending on the time evolution of the hemorrhage. Moreover, melanin content has been histopathologically correlated to hyperintensity in T1w images4. Nevertheless, it is still unclear and scare quantified which MR signal changes are accounted for by blood and which by melanin.Methods
The study was conducted in accordance with the Declaration of Helsinki. Institutional review board approval was obtained and all subjects provided written informed consent. Four stage IV melanoma patients (mean age 58 ± 15 years) with 37 metastases were evaluated quantitatively.
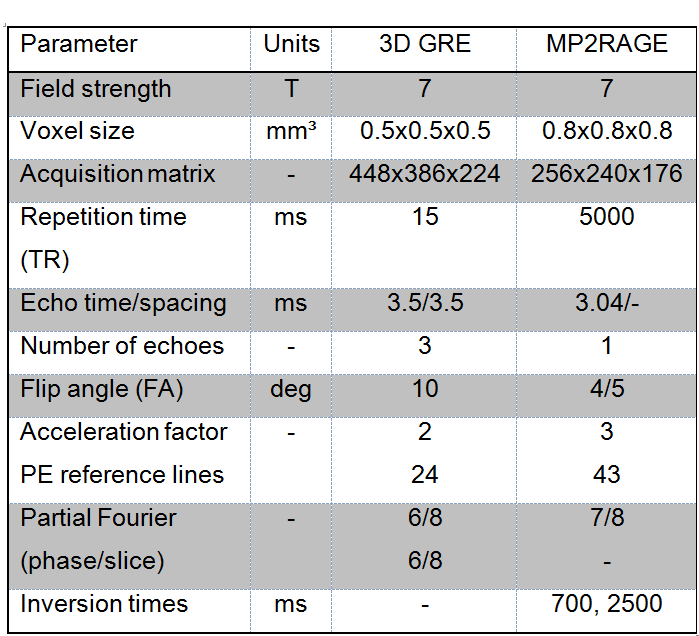
The patients were scanned on a 7 T whole-body MR system (Magnetom 7 T, Siemens Healthcare, Germany) with a 24-channel head-matrix coil. A 3D gradient-echo (GRE) sequence (pre-contrast) and a MP2RAGE (pre- and post-contrast) were acquired in three patients. The first patient terminated the examination after only the gradient echo sequence has been acquired. Sequence parameters are shown in Table 1. Brain masks were generated from the magnitude images using FSL-BET5. Phase images were unwrapped using Laplacian-based phase unwrapping6-8, and the background field was removed with V-SHARP7, 8 with kernel size up to 25 mm. Susceptibility maps were calculated in Matlab using the iLSQR method6, 9. Susceptibility maps were referenced with respect to cerebrospinal fluid from the atrium of the lateral ventricles. T1-weighted images and T1 maps (pre- and post-contrast) were co-registered to the first echo of the GRE magnitude images for each patient using affine registration in FSL-FLIRT10. Melanoma metastases were manually identified based on post-contrast T1-weighted images and T1 difference images (T1(precontrast)-T1(post-contrast)) in the Medical Imaging Interaction Toolkit (MITK)11, 12 for at most ten metastases per patient. For the patient for whom only GRE data were obtained, metastases were identified on GRE magnitude images.
Results
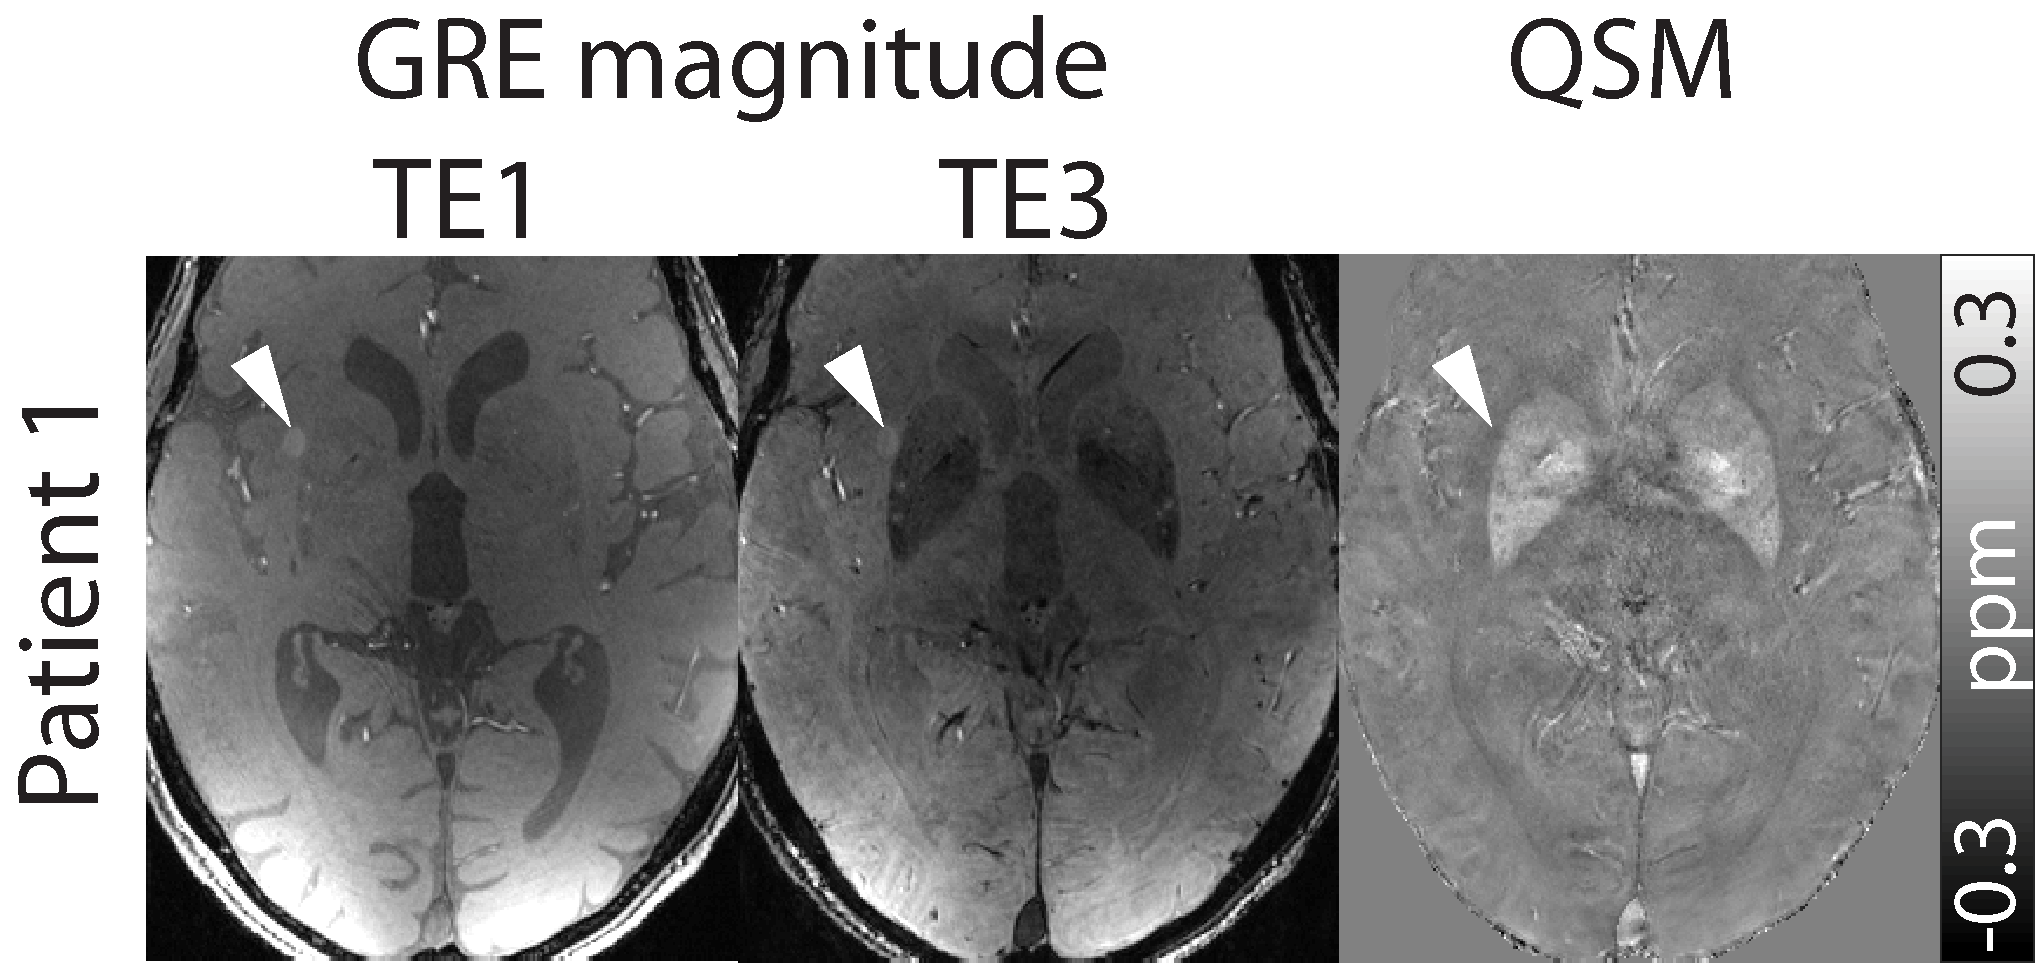
In Patients 1, 2, and 4, ten metastases were included in the evaluation, and in Patient 3, only seven metastases could be identified. In Patient 1, metastases could be identified on GRE magnitude data as they showed hyperintense contrast (Figure 1). This behavior was not observed for the metastases in the other patients.
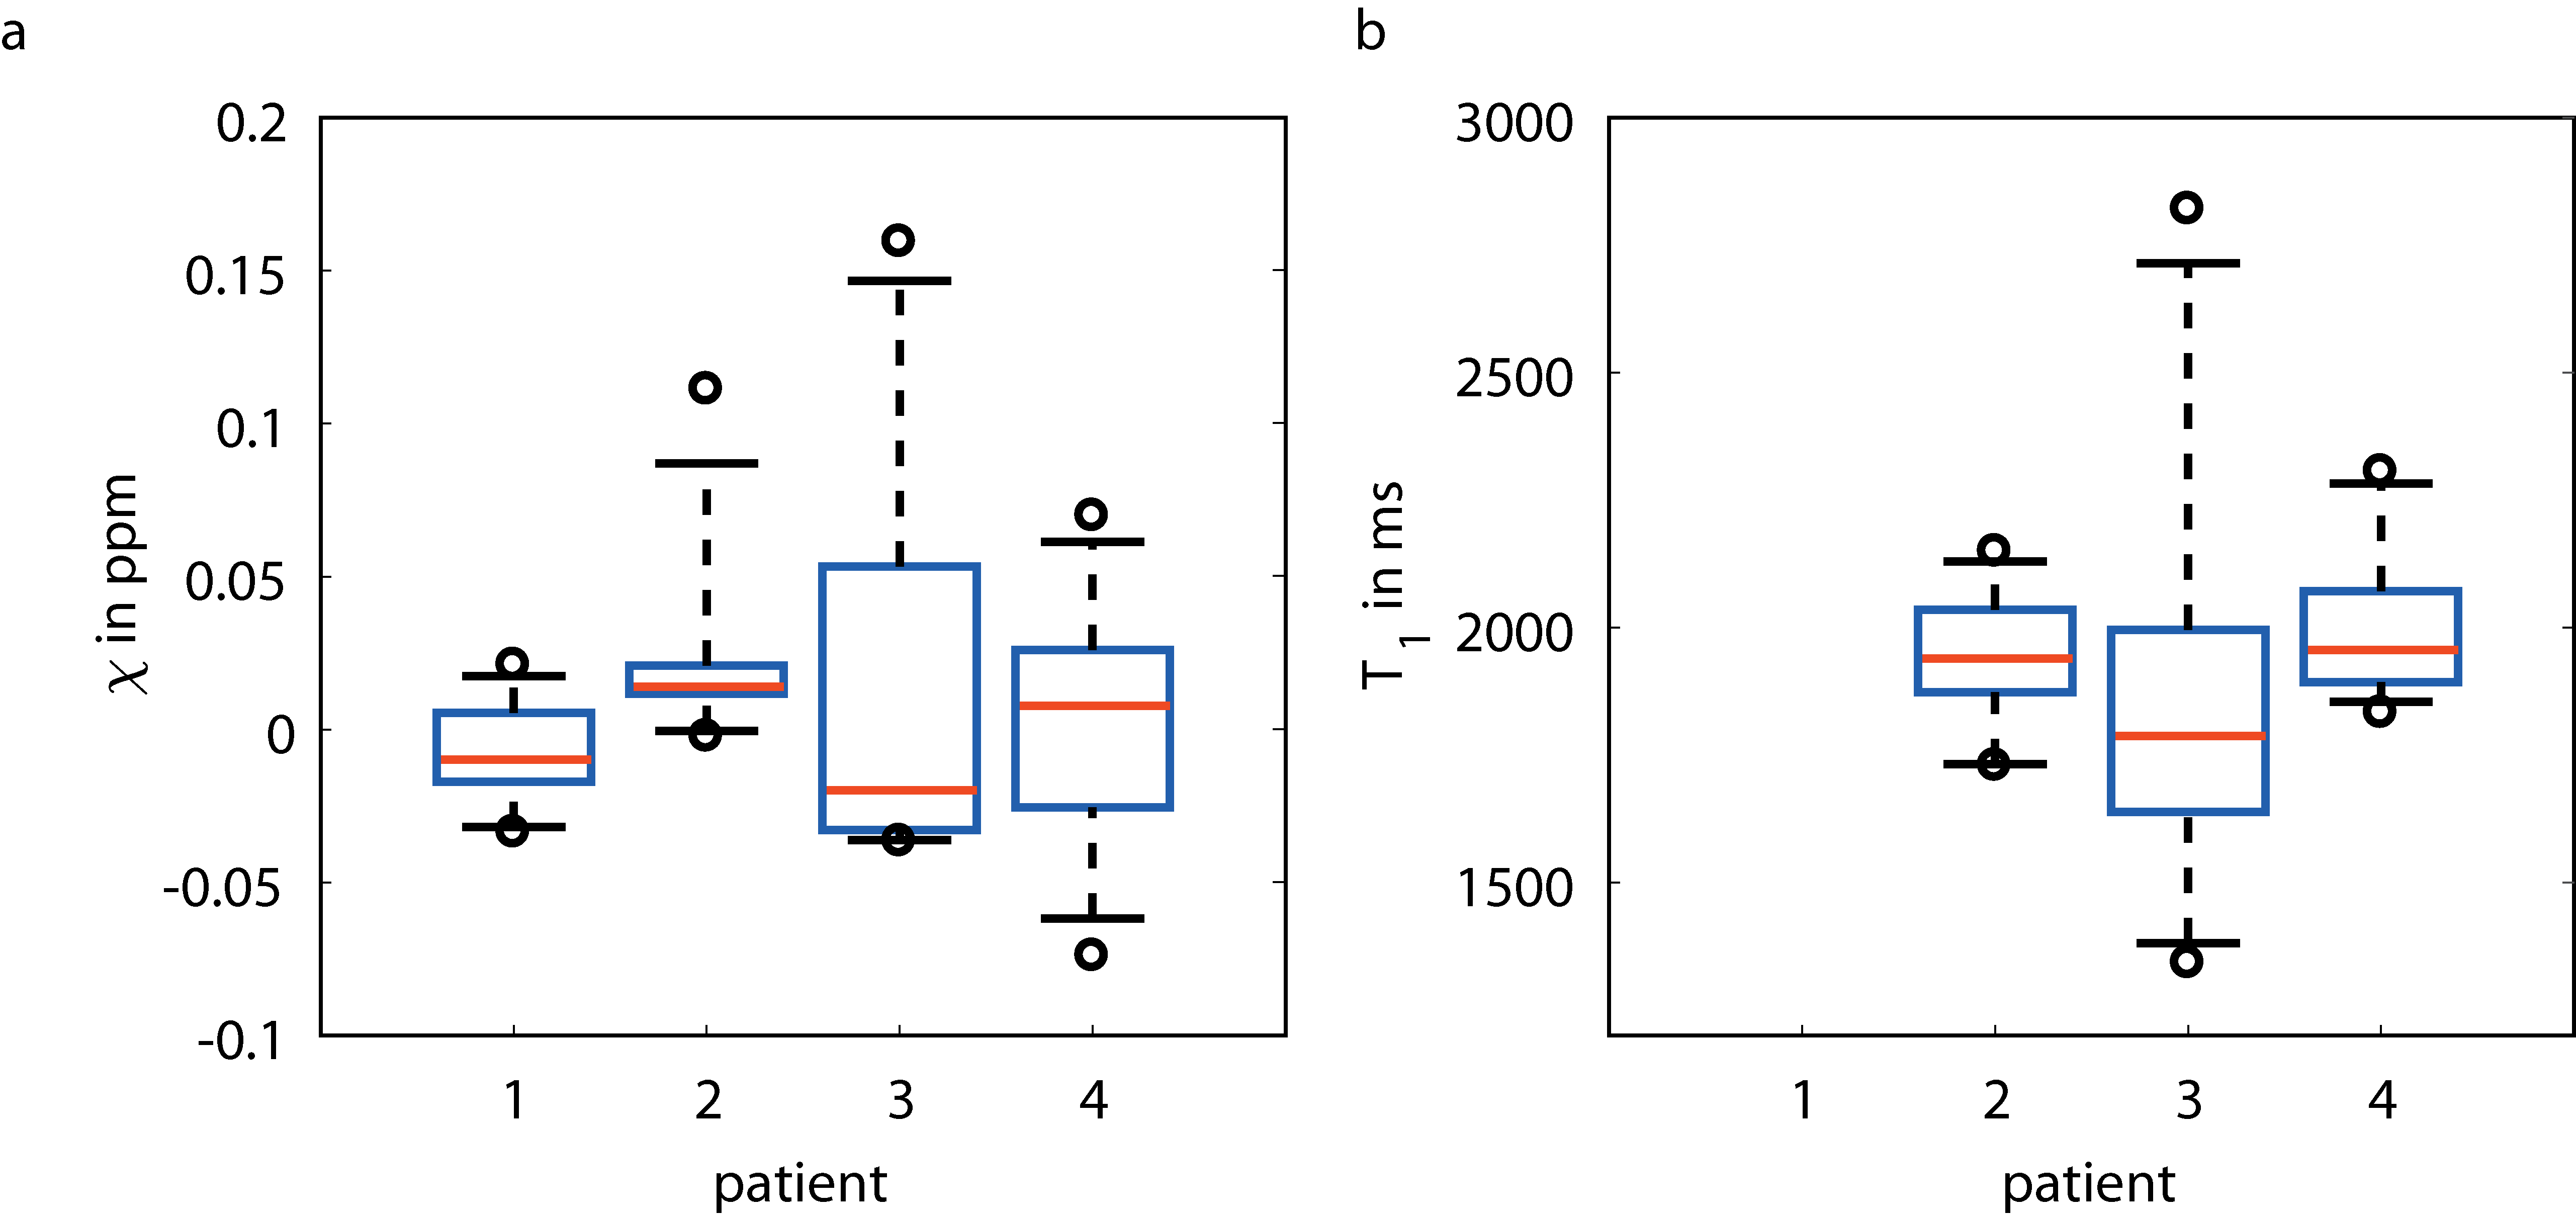
In Figure 2, boxplots of the mean susceptibility values (a) and the mean T1 values (b) are shown. For Patient 1, no T1 values were available as only GRE data were measured. Patient 3, who shows a wider range in susceptibility values, also shows a wide range in T1 values.
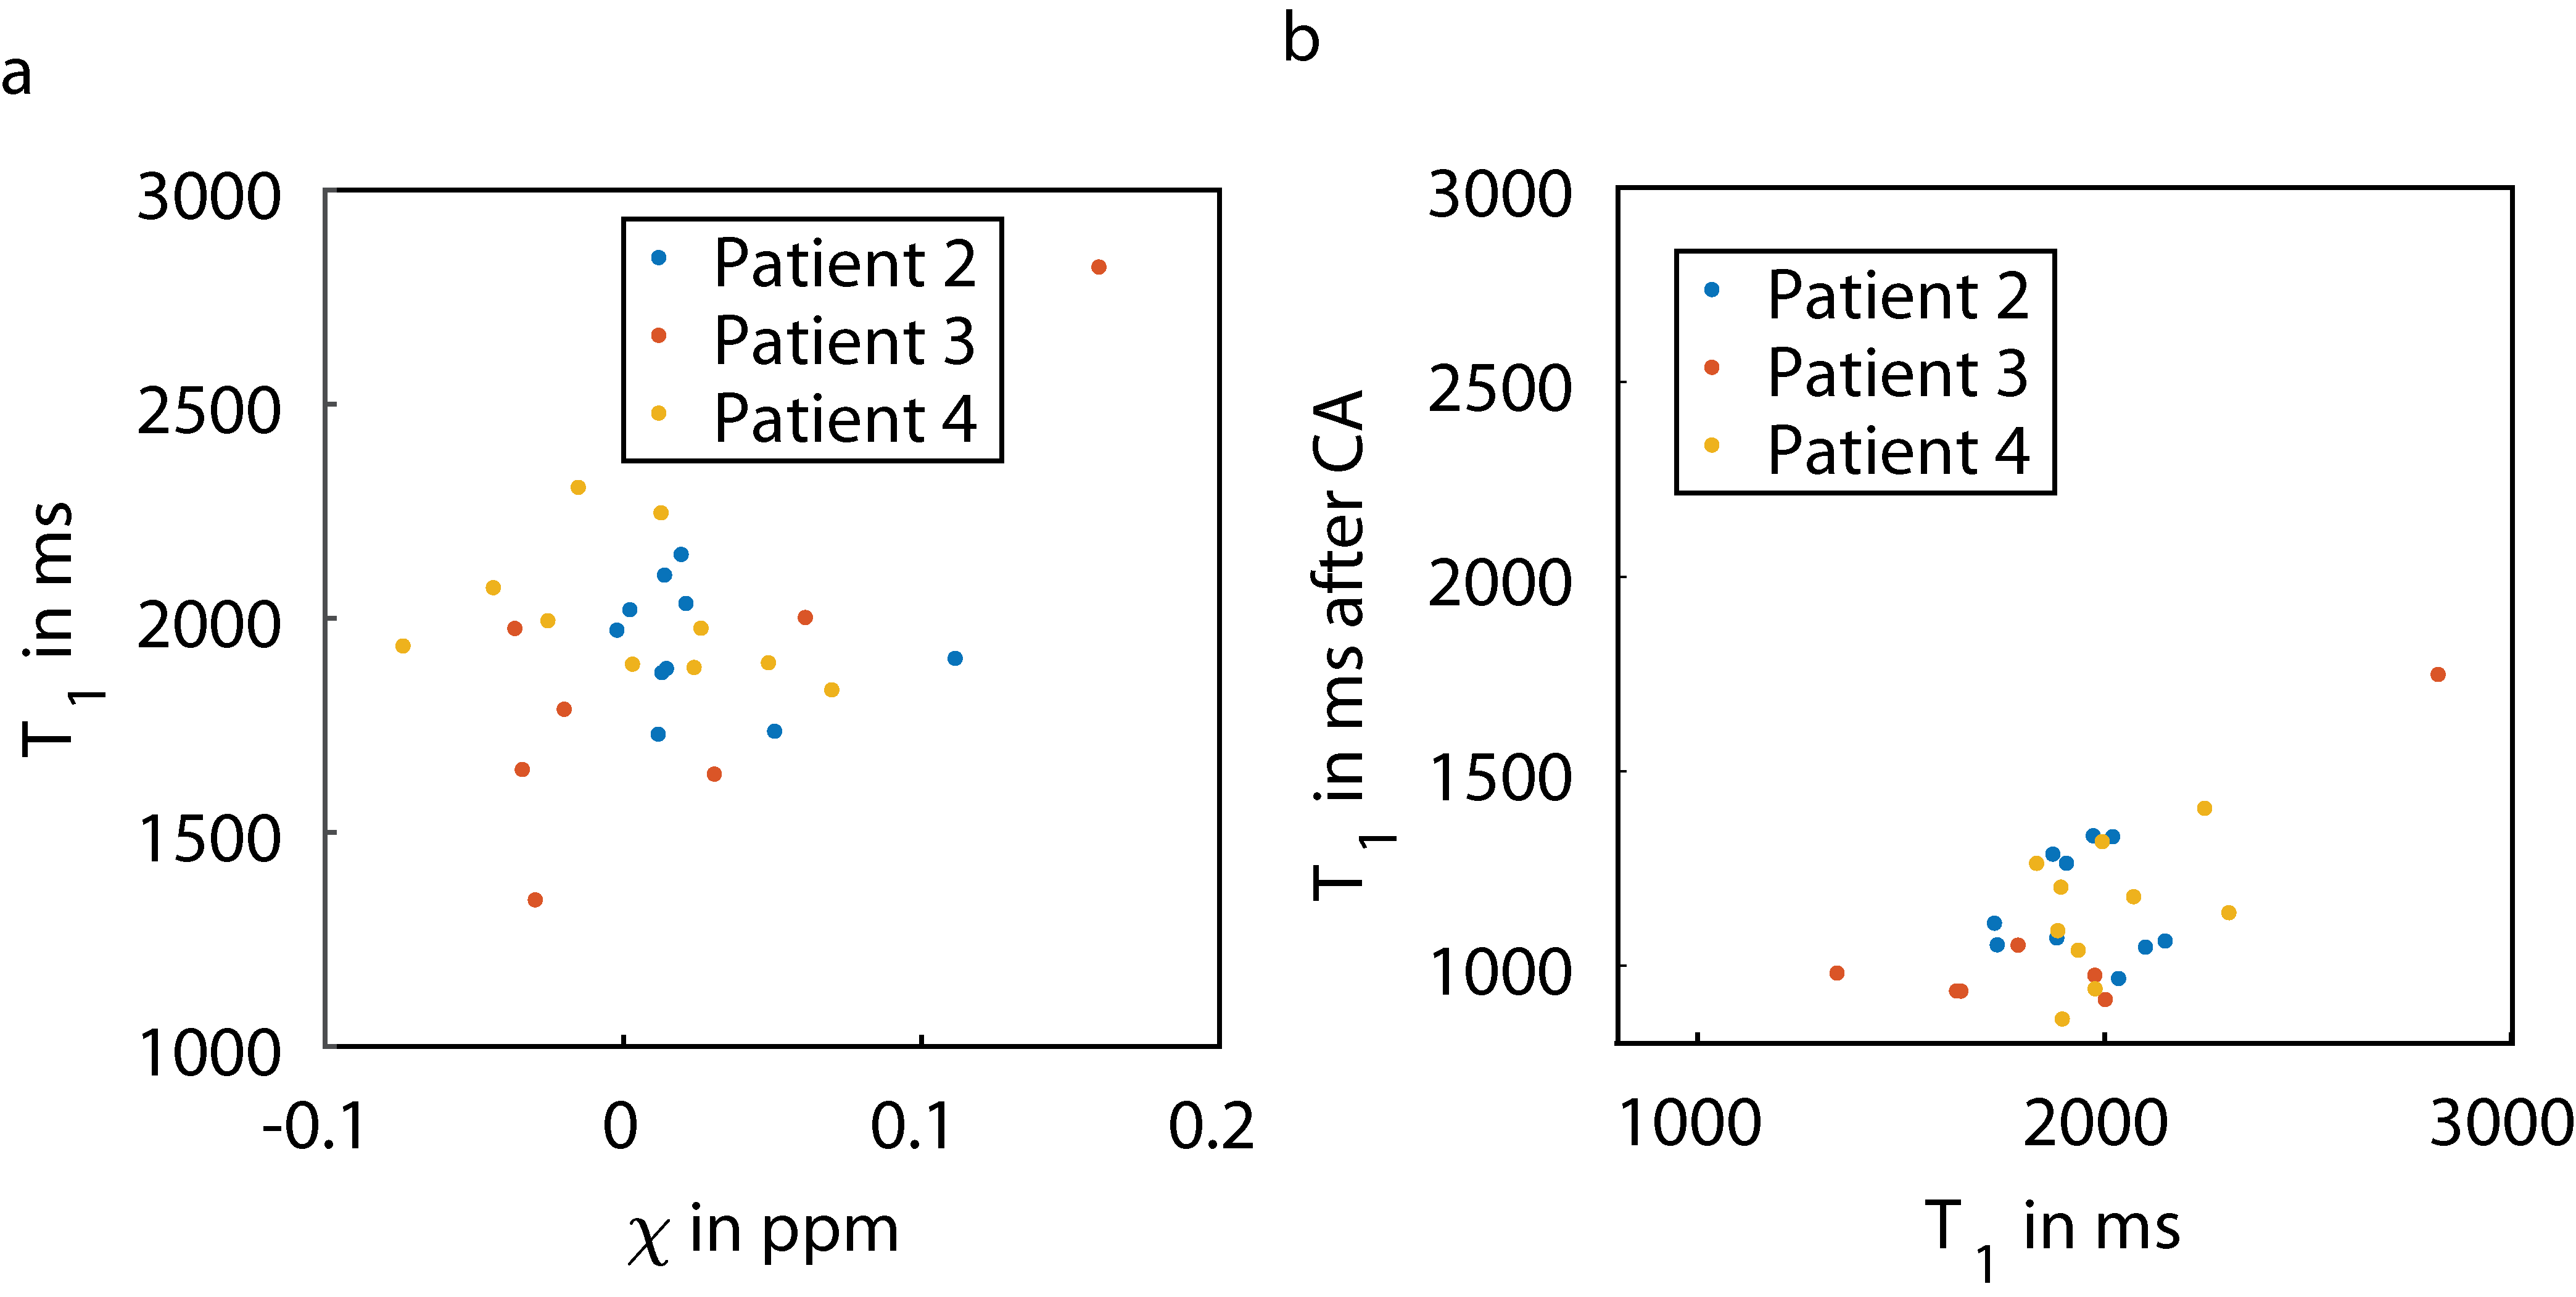
Figure 3 shows scatter plots of susceptibility values and T1 values (a) and of T1 values before and after contrast agent injection. Susceptibility values and T1 values of the individual metastases do not seem related. The minimum mean susceptibility observed for an individual metastasis was -0.074 ppm (with T1 value of 1935 ms), and the maximum mean susceptibility was 0.160 ppm with a T1 value of 2821 ms, which was also the maximum T1 value observed. The minimum mean T1 observed for an individual metastasis was 1342 ms (with susceptibility of -0.030 ppm). Contrast agent uptake in individual metastases also seemed to vary (b).
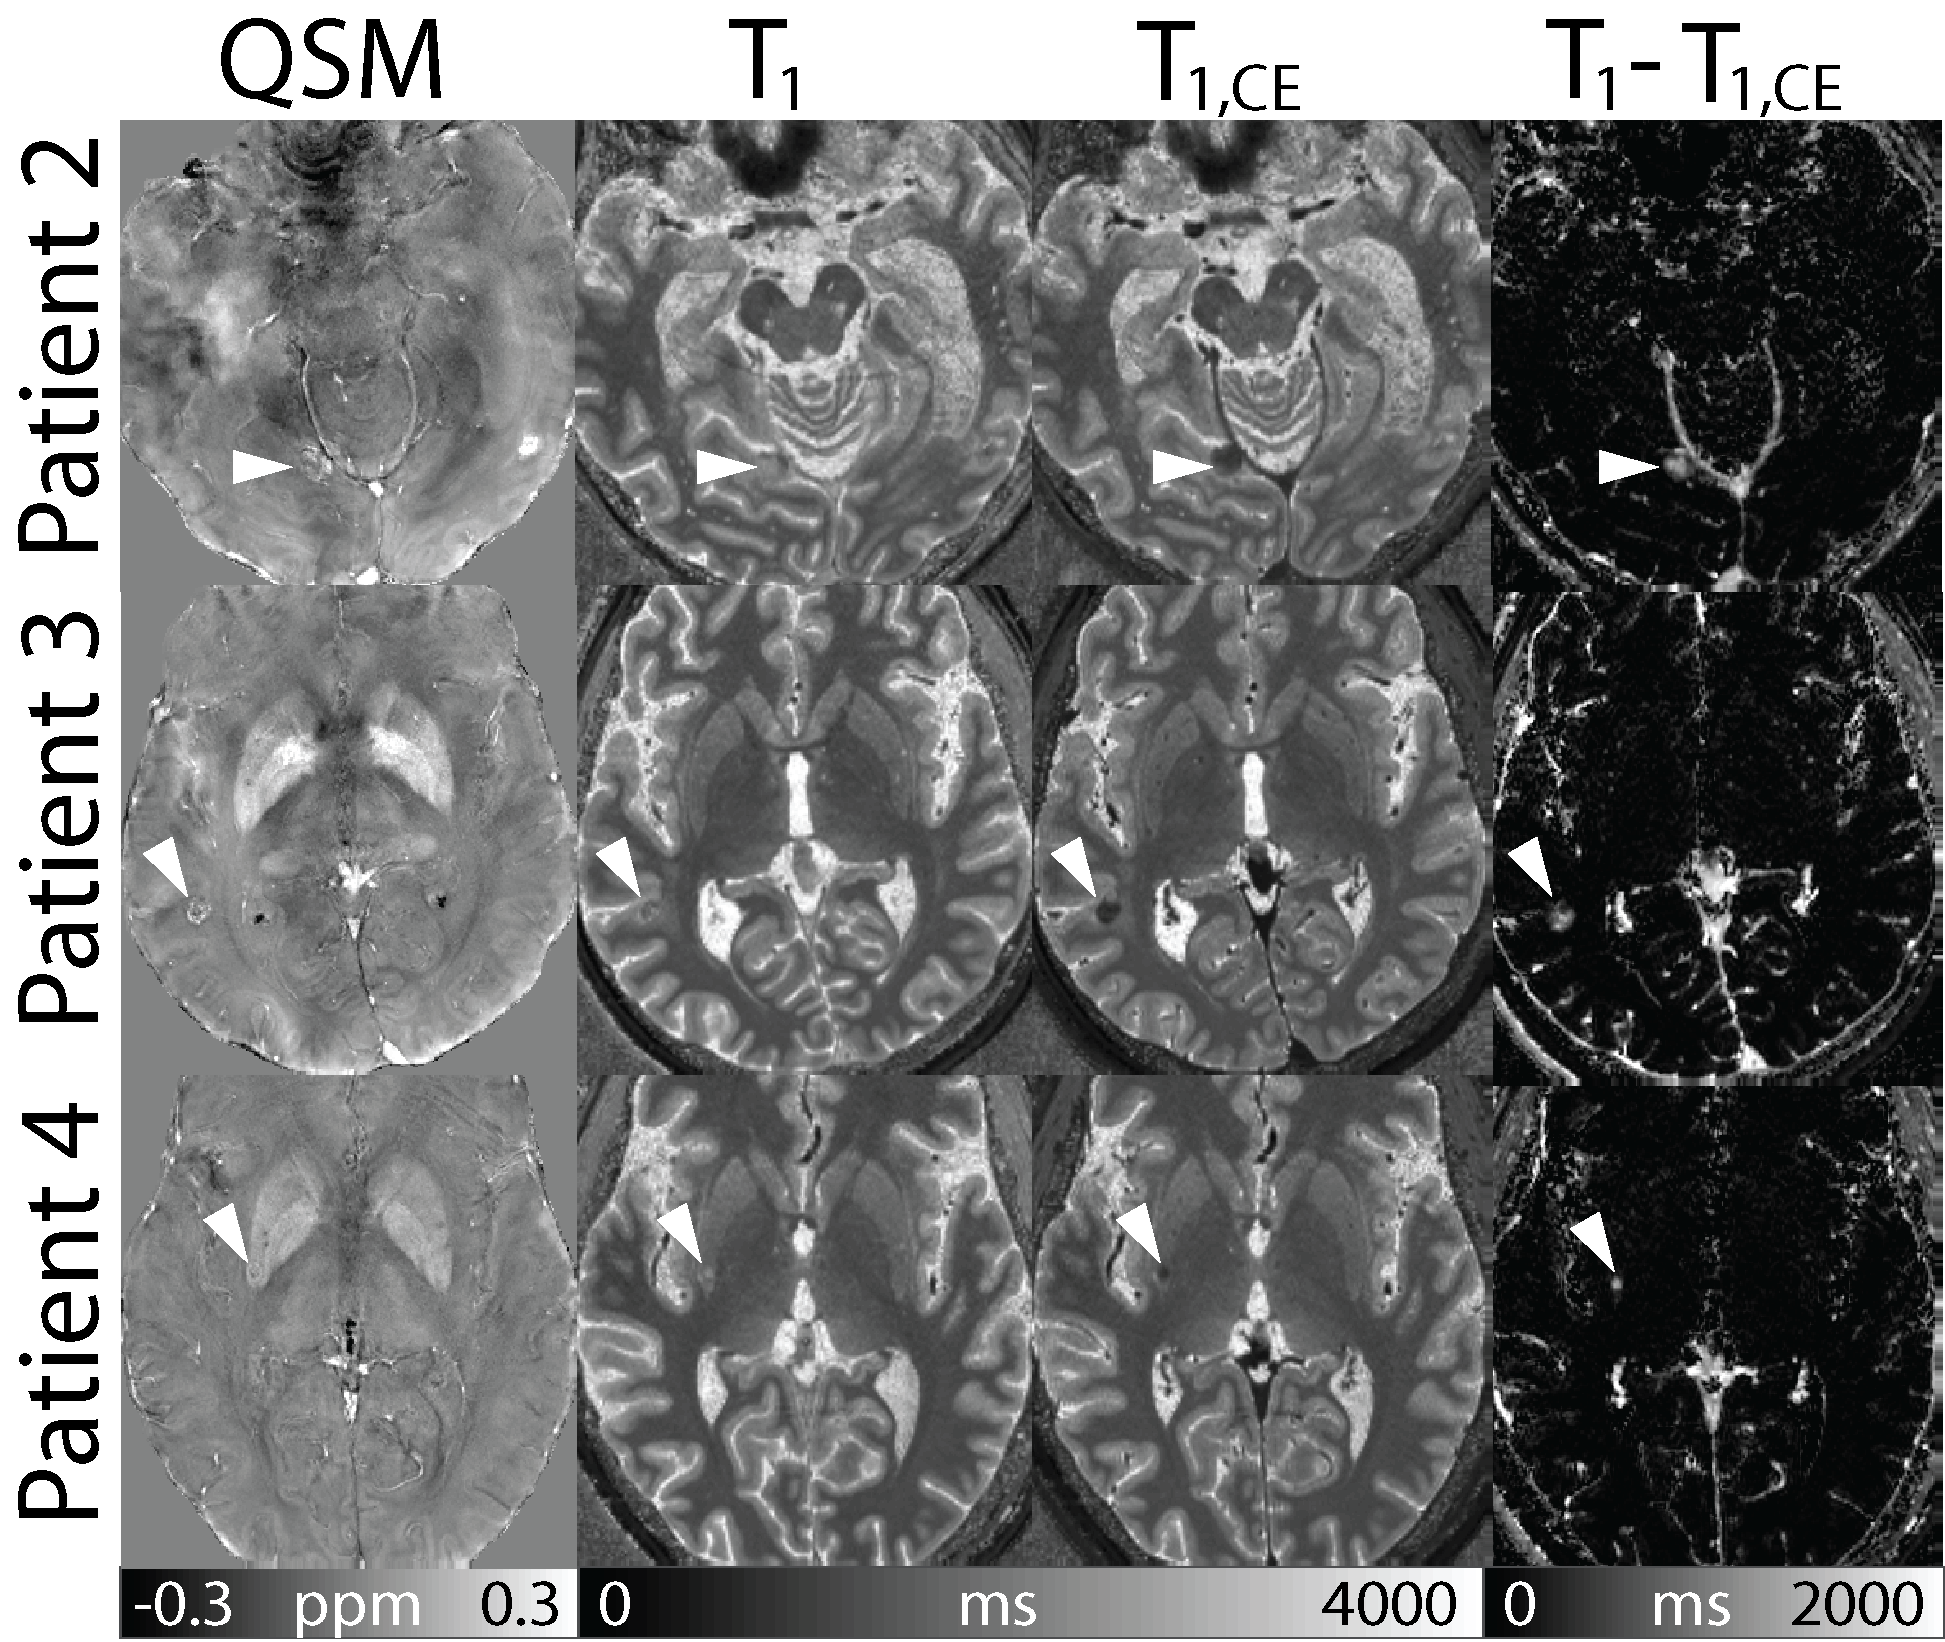
In Figure 4, susceptibility maps and T1 maps before and after contrast agent enhancement are shown as well as difference images of the T1 maps before and after contrast agent enhancement. Arrow heads point at the metastases, which can be delineated in all images. In susceptibility maps, metastases appear nearly isointense with fine paramagnetic (bright) structures. Due to the T1 shortening effect of contrast agent, metastases display low T1 values after contrast agent injection.
Discussion and Conclusion
Susceptibility values observed here were in agreement with results shown at lower field strength13. Melanoma metastases are known to show T1w hyperintense contrast1-3 associated with melanin. In this work, we observed this only in one patient, in whom the metastases were in accordance with the melanotic pattern, but showed no strongly paramagnetic susceptibility effects. Furthermore, we observed fine paramagnetic structures especially at the borders of the metastases that could be in agreement with small vessels or hemorrhagic events. Due to the high contrast and high resolution available at 7T, QSM and T1 mapping at 7T could help solve the question of which contrast mechanisms guide the appearance of melanoma metastases in larger studies, ideally with histology information available.Acknowledgements
No acknowledgement found.References
- Escott JE. A Variety of Appearances of Malignant Melanoma in the Head: A Review. RadioGraphics 2001; 21:625–639.
- Woodruff WWJr, Djang WT, McLendon RE, Heinz ER, Voorhees DR. Intracerebral malignant melanoma: high-field-strength MR imaging. Radiology 1987;165:209–213.
- Enochs WS, Hyslop WB, Bennett HF, Brown RD 3rd, Koenig SH, Swartz HM. Sources of the increased longitudinal relaxation rates observed in melanotic melanoma. An in vitro study of synthetic melanins. Invest Radiol 1989;24(10):794-804.
- Isiklar I, Leeds NE, Fuller GN, Kumar AJ. Intracranial Metastatic Melanoma: Correlation Between MR Imaging Characteristics and Melanin Content. AJNR 1995;165:1503-1512.
- Smith SM. Fast robust automated brain extraction. Human Brain Mapping 2002;17(3):143-155.
- Li W, Wu B, Liu CL. Quantitative susceptibility mapping of human brain reflects spatial variation in tissue composition. Neuroimage 2011; 55(4):1645-56.
- Li W, Avram AV, Wu B, Xiao X, Liu CL. Integrated Laplacian-based phase unwrapping and background phase removal for quantitative susceptibility mapping. Nmr Biomed. 2014;27(2):219-227.
- Wu B, Li W, Guidon A, Liu CL. Whole brain susceptibility mapping using compressed sensing. Magn Reson Med 2012;67(1):137-147.
- Li W, Wang N, Yu F, Han H, Cao W, Romero R, Tantiwongkosi B, Duong TQ, Liu CL. A method for estimating and removing streaking artifacts in quantitative susceptibility mapping. Neuroimage 2015;108:111-122.
- Patenaude B, Smith SM, Kennedy D, Jenkinson M. A Bayesian Model of Shape and Appearance for Subcortical Brain. Neuroimage 2011;56(3):907-922.
- Maleike D, Nolden M, Meinzer HP, Wolf I. Interactive segmentation framework of the Medical Imaging Interaction Toolkit. Comput Meth Prog Bio 2009;96(1):72-83.
- Nolden M, Zelzer S, Seitel A, Wald D, Müller M, Franz AM, Maleike D, Fangerau M, Baumhauer M, Maier-Hein L, Maier-Hein KH, Meinzer HP and Wolf I, The Medical Imaging Interaction Toolkit: challenges and advances, Int J Comput Assist Radiol Surg. 2013;8(4):607-620.
- Straub S, Laun FB, Freitag MT, et al. Assessment of melanin content and its influence on susceptibility contrast in melanoma metastases. Proc. Intl. Soc. Mag. Reson. Med. 25 (2017):1965.
Figures