5006
In vivo quantitative susceptibility mapping detection of β-amyloid targeted by curcumin-conjugated magnetic nanoparticles1Laboratory of Biomedical Imaging and Signal Processing, The University of Hong Kong, Hong Kong, China, 2Department of Electrical and Electronic Engineering, The University of Hong Kong, Hong Kong, China
Synopsis
At present, there is a lack of reliable in vivo diagnostic methods to visualize and quantify the Alzheimer's disease (AD) pathologies. β-amyloid (Aβ) plaques are the hallmarks of AD brains. Recently, we have designed a novel curcumin-conjugated magnetic nanoparticles (Cur-MNPs) that target Aβ pathologies. Quantitative susceptibility mapping (QSM) offers the possibility of quantifying Cur-MNPs in vivo as a quantitative surrogate marker for Aβ pathologies. In this study, we optimized the QSM acquisition and processing procedure for mouse brains in vivo. Furthermore, we investigated the ability of QSM in detecting Cur-MNPs targeted Aβ pathologies in vivo in transgenic AD mouse models.
Purpose
At present, there is a lack of reliable in vivo diagnostic methods to visualize and quantify the Alzheimer's disease (AD) pathologies such as β-amyloid (Aβ) plaques1,2. Recently, we have designed a novel curcumin-conjugated superparamagnetic iron oxide (SPIO) nanoparticles (Cur-MNPs) that target Aβ species3. Quantitative susceptibility mapping (QSM) offers the possibility of quantifying Cur-MNPs targeted Aβ pathologies in vivo. In this study, we optimized the QSM acquisition and processing procedure for mouse brains in vivo that involves image domain averaging, motion and phase difference corrections. Further, we evaluated the ability of QSM in detecting Cur-MNPs targeted Aβ pathologies in vivo in transgenic AD mice.Methods
Data acquisition and analysis: MRI was performed on a 7T Bruker preclinical scanner with a volume coil. 3D multi-echo gradient-recalled echo (GRE) data sets were acquired with TR=40.3ms, TE=3.9ms/10.2ms/16.5ms/22.8ms, flip angle=15o, bandwidth=46kHz, matrix size=220×140×50, FOV=18.00×11.48×5.45mm3, resolution=82×82×109μm3, 10 repetitions (in contrast to k-space averaging 10 times), and the total acquisition time of 47 minutes. To minimize the effect of the animal motion during the long scan time, image data were acquired repetitively instead of k-space averaging. Ten sets of images reconstructed from 10 repetitions were realigned using 3D rigid motion correction using SPM12. Due to the main field drift and animal physiological change, a constant phase difference was observed between each two consecutive repetitions. Such constant phase inconsistency was calculated and corrected before the complex averaging of the 10 realigned image datasets. Finally, QSM was then computed from the 3D phase map of the averaged 3D image dataset4,5.
Animals and Cur-MNPs administration: A commonly used transgenic AD mouse model (5xFAD) were employed. Three-mon-old 5xFAD mice and age-matched wild-type mice were scanned for QSM. Animals were injected with Cur-MNPs intravenously via tail vein (0.315mmol Fe/kg in 200μl) and scanned by MRI four hours after injection. The animals were anesthetized under 1.5% isoflurane mixed with 90% oxygen during MRI scan. Details on Cur-MNPs synthesis and characterization have been described in our recent publication3.
Results
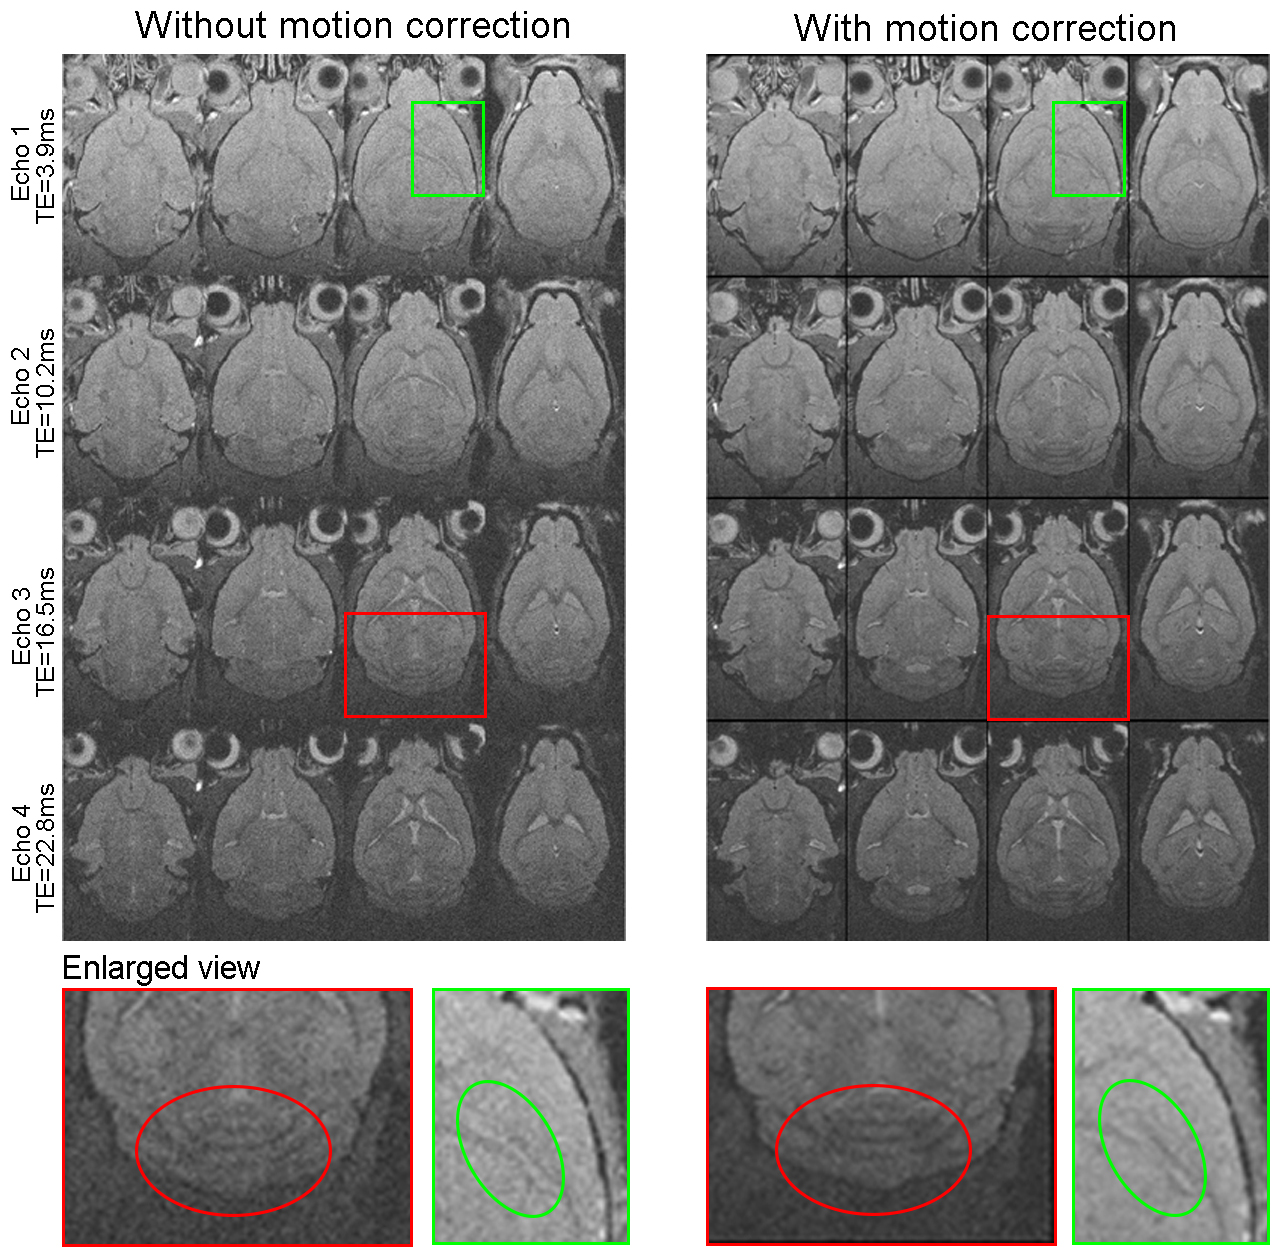
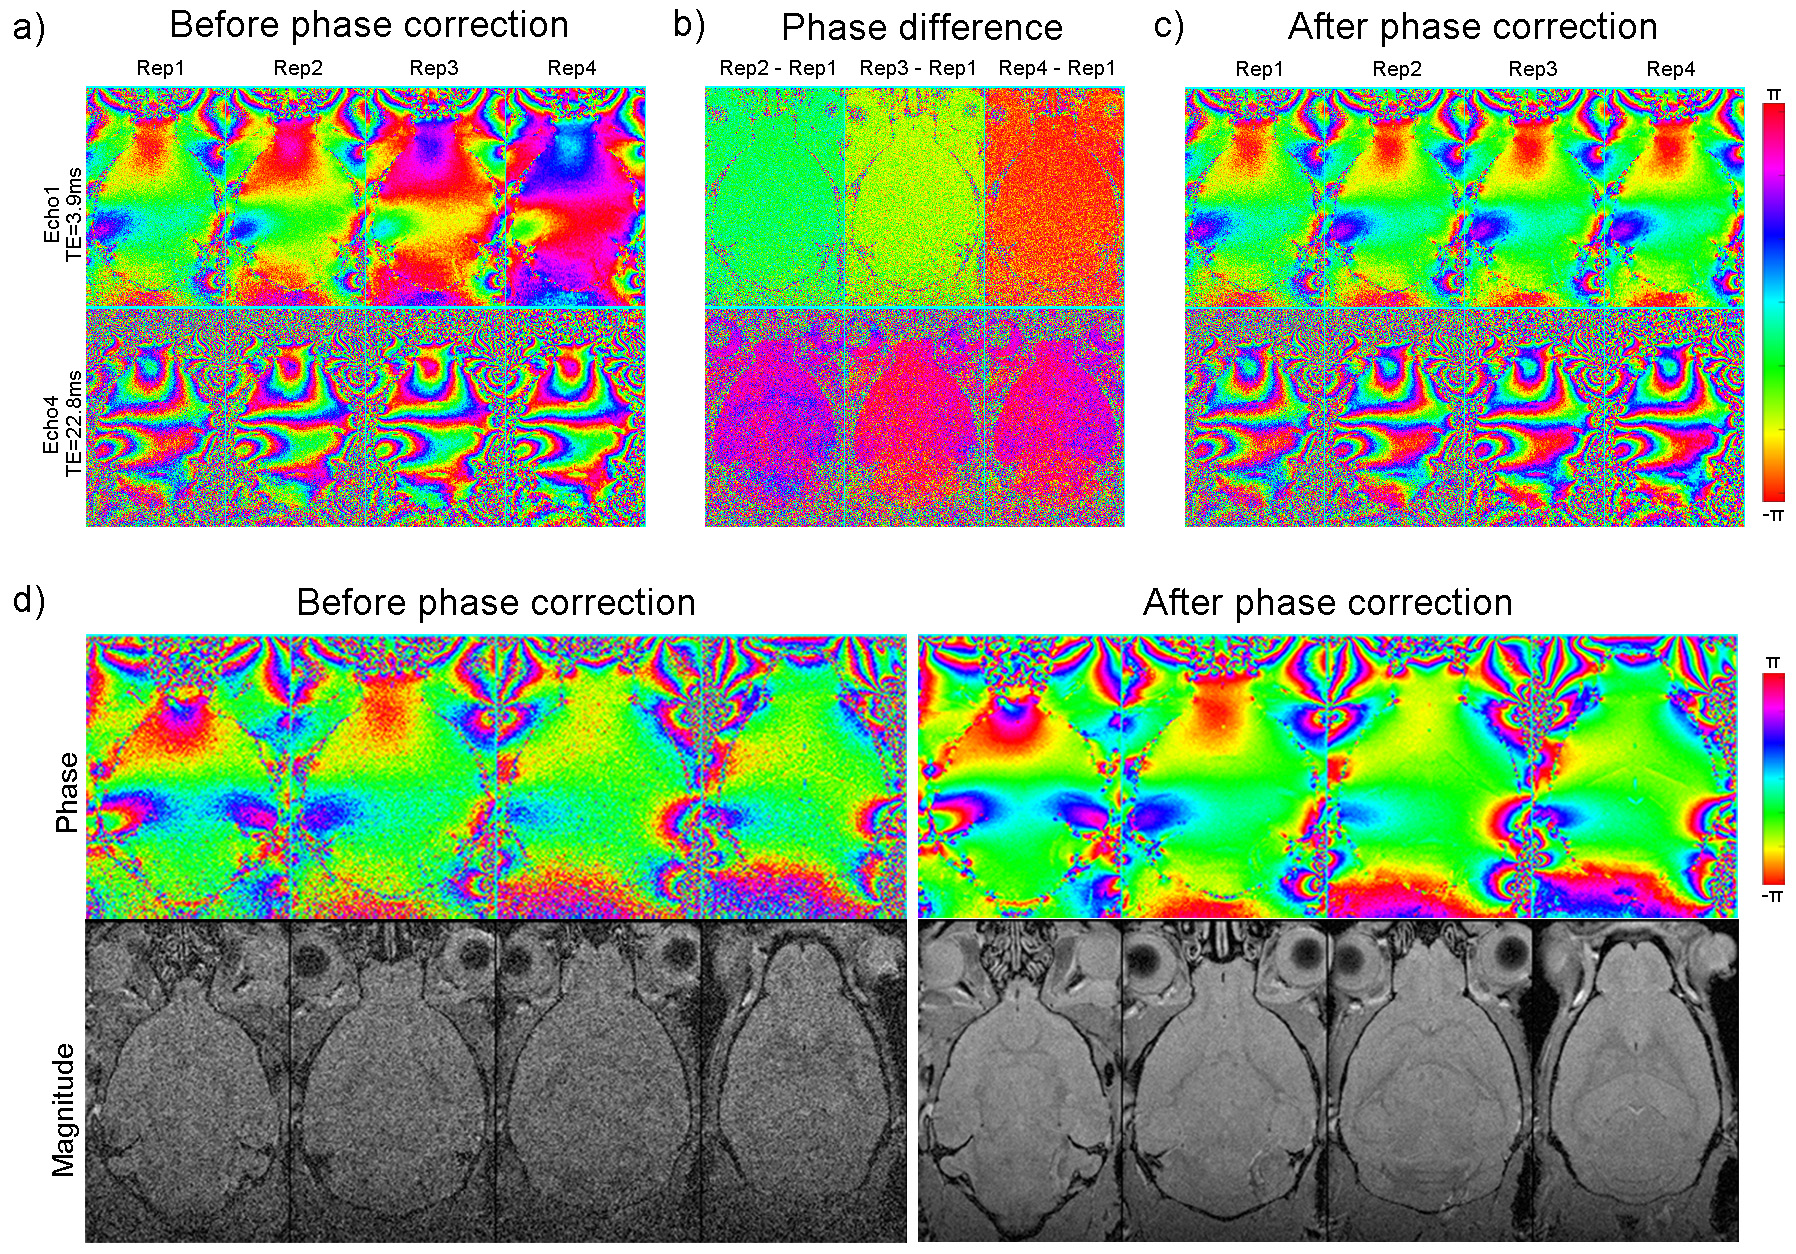
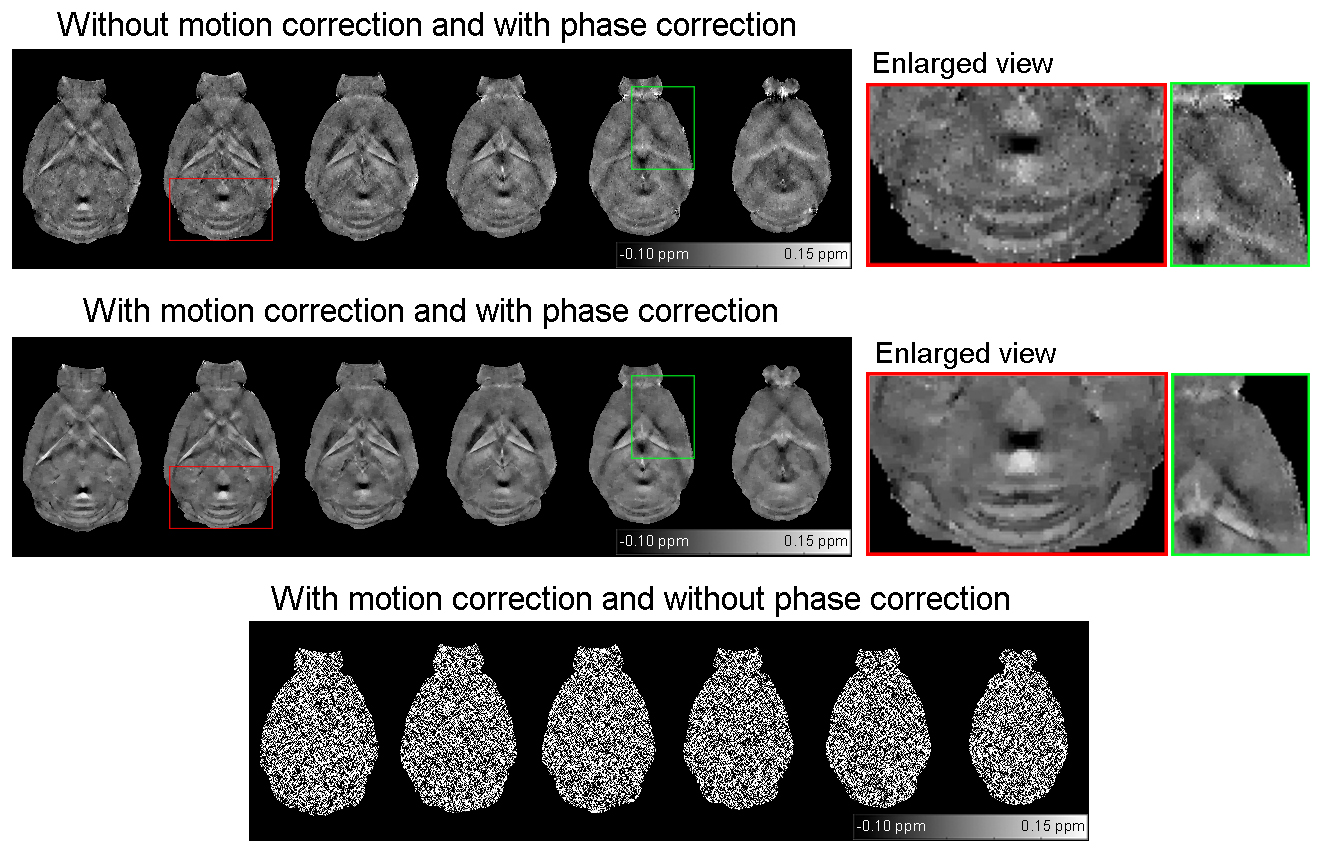
Figure 1 shows the averaged multi-echo 3D GRE images with and without motion correction (both with phase correction). With motion correction, the final images were seen to exhibit better anatomical details. Figure 2 shows the effect of phase correction. Before phase correction, different repetitions exhibited mostly constant phase differences (Figures 2a and 2b). After phase correction, the phases of each echo images within repetitions were well aligned (Figure 2c). This phase correction led to better phase images (less phase noise) and significantly improved magnitude images (higher SNR) as demonstrated in Figure 2d. Figure 3 illustrates the effects of proposed motion and phase correction on the final QSM results. With motion correction, the overall quality of QSM was dramatically improved, exhibiting higher SNR and less blurring. In contrast, no meaningful QSM results could be obtained without phase correction.
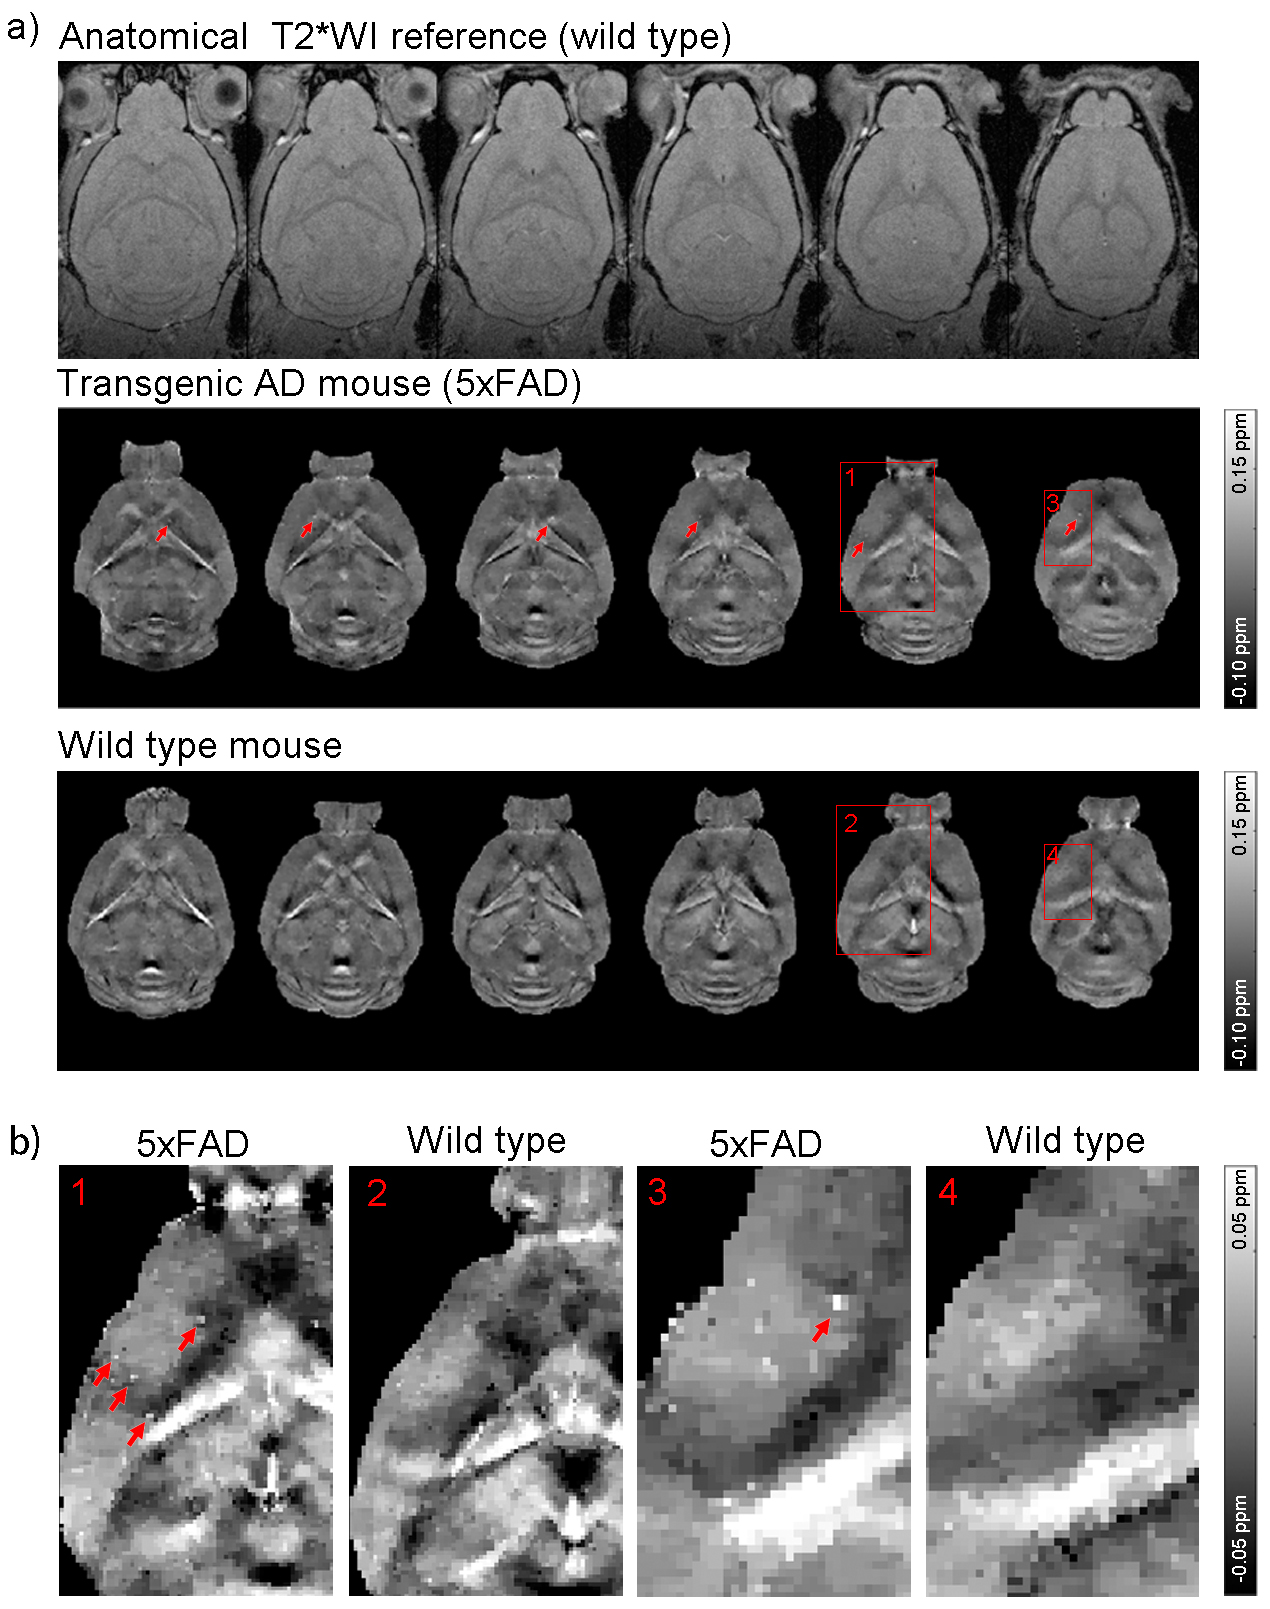
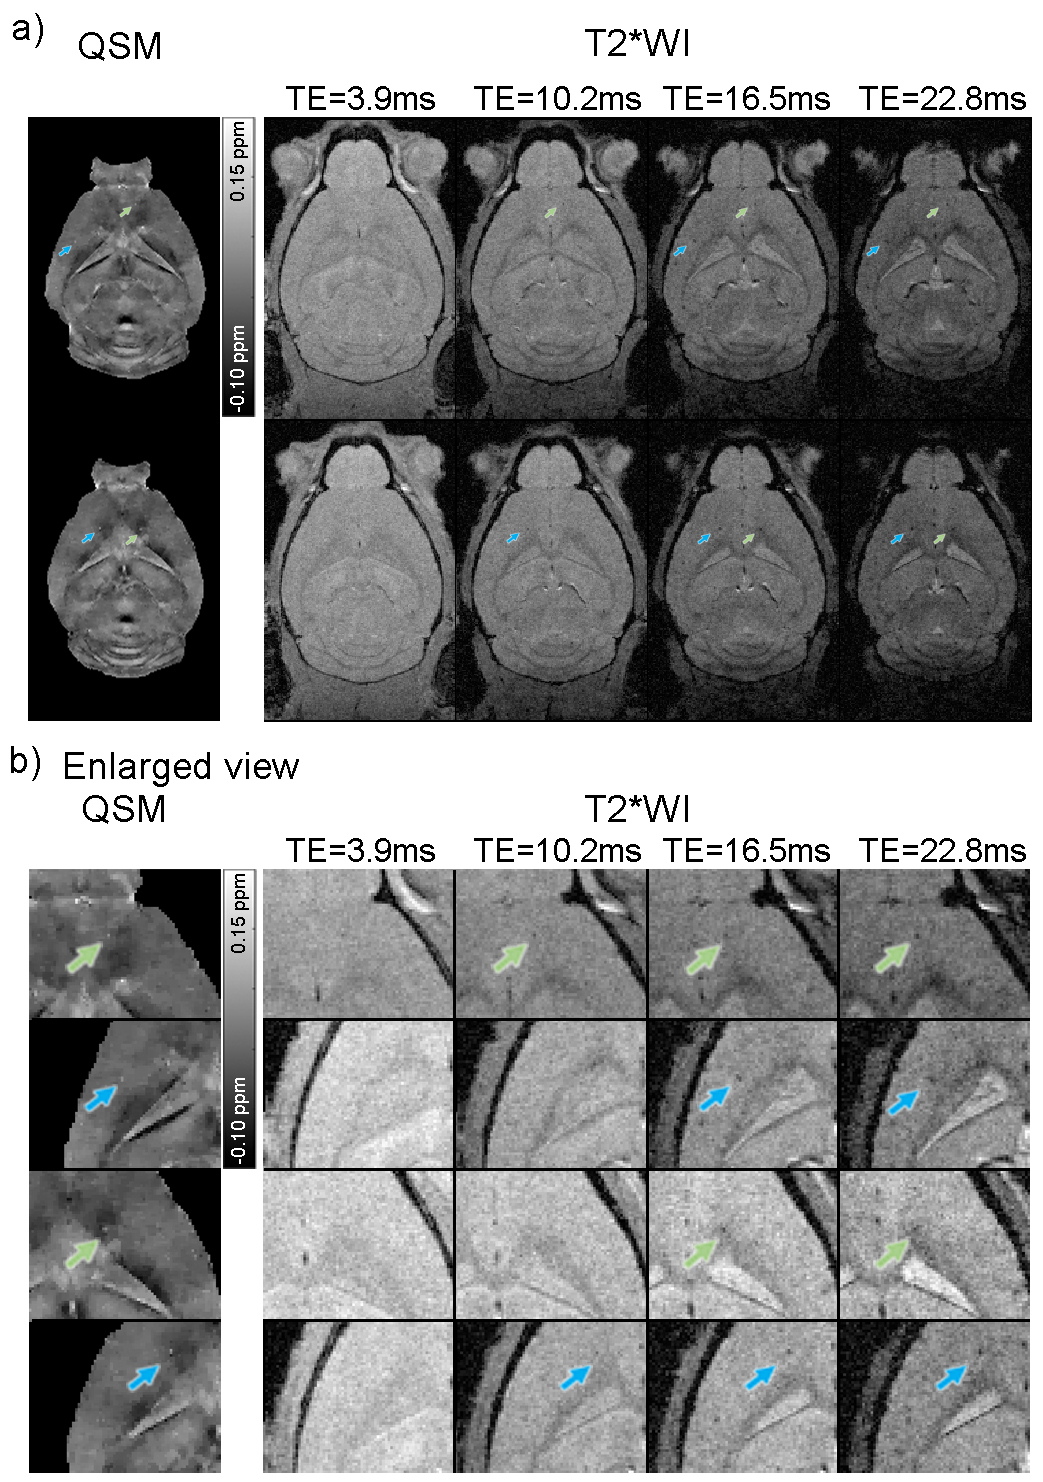
Figure 4 presents the QSM maps from one representative transgenic AD mouse (5xFAD) and one wild type control. In QSM maps, hyperintense spots (red arrows) were found to be abundant in the cortex, hippocampus and striatum of AD brains. They reflect the presence of Cur-MNPs that targeted Aβ pathologies. In contrast, similar spots were rarely observed in the wild type mouse. Figure 5 shows the QSM and the corresponding multi-echo GRE images of 5xFAD mouse. The focal spots with high magnetic susceptibility correspond well to the hypointense spots in the multi-echo GRE T2* weighted images, especially those in the images with long TEs.
Discussion
In vivo mouse brain QSM is challenging due to a variety of factors. Due to the small brain size and high resolution, the QSM scan time is often long. During the long scan time, the main field can drift and animal motions are inevitable. Therefore, the traditional QSM acquisition and reconstruction (i.e., averaging in k-space) will not be suitable. Here we proposed multi-repetition approach to acquire 3D GRE data, together with subsequent inter-repetition phase correction and image realignment before the final QSM reconstruction. Our results clearly demonstrated that this approach significantly improves mouse brain QSM quality. Furthermore, our results from transgenic 5xFAD AD mice clearly indicated the in vivo ability of QSM in detecting Aβ pathologies targeted by Cur-MNPs. Such QSM detection can lead to quantitative detection of Aβ pathologies in future studies.Acknowledgements
This work was supported by the Hong Kong Research Grant Council (HKU17115116 to E.X.W.).References
1.Jack, C.R., Jr. & Holtzman, D.M. Biomarker modeling of Alzheimer's disease. Neuron 80, 1347-1358 (2013).
2.Adlard, P.A., et al. A review of beta-amyloid neuroimaging in Alzheimer's disease. Frontiers in neuroscience 8, 327 (2014).
3.Cheng, K.K., et al. Curcumin-conjugated magnetic nanoparticles for detecting amyloid plaques in Alzheimer's disease mice using magnetic resonance imaging (MRI). Biomaterials 44, 155-172 (2015).
4.de Rochefort, L., et al. Quantitative susceptibility map reconstruction from MR phase data using bayesian regularization: validation and application to brain imaging. Magnetic Resonance in Medicine 63, 194-206 (2010).
5.Liu, T., et al. Nonlinear formulation of the magnetic field to source relationship for robust quantitative susceptibility mapping. Magnetic resonance in medicine 69, 467-476 (2013).
Figures