5005
Imaging Human Brain Cortical Substructure with Quantitative Susceptibility Mapping at 7 THongjiang Wei1, Berkin Bilgic2, Kawin Setsompop2, Boris Keil2, David Feinberg 3,4, and Chunlei Liu1,3
1EECS, University of California, Berkeley, Berkeley, CA, United States, 2Athinoula A. Martinos Center for Biomedical Imaging, Massachusetts General Hospital, Charlestown, MA, United States, 3Helen Wills Institute for Neuroscience, University of California, Berkeley, Berkeley, CA, United States, 4Advanced MRI Technologies, Sebastopol, CA, United States
Synopsis
High-field MRI combined with high-density motor-cortex coil and a novel QSM algorithm allows in vivo brain cortex imaging with high contrast-to-noise ratio and spatial resolution (0.15x0.15x0.65 mm3). Our work revealed up to six apparent myelin/iron layers in
Introduction
The human cerebral cortex comprises of multi-layers of neuronal cells interconnected with synapses, axons and vessels. Understanding of the proper microstructural arrangement of complex neural structures in the human cortex is of great interest in studying normal brain functions and a wide variety of neurodegenerative disorders. The ability to image the magnetic susceptibility of human cerebral cortex at the resolution of cortical layers1 is challenging, especially with limited slice coverage. In the present study, we present a novel method to resolve tissue microstructure and infer cortical substructure by mapping the magnetic susceptibility at ultra-high resolution, i.e. at 150μm spatial resolution at 7T. This is achieved by using a densely packed 32-channel motor cortex coil that is tight fitting combined with a novel quantitative susceptibility mapping (QSM) reconstruction algorithm dealing with limited spatial coverage. Our work revealed up to six apparent myelin/iron layers and complex vasculature in the cortical areas.Methods
Data were acquired on a 7T scanner (Magnetom, Siemens Healthcare) using a densely packed 32-channel motor cortex coil (38mm loop, 32 channels). An axial 2D gradient echo sequence was used to acquire images with the following parameters: TR=450 ms, TE1/spacing/TE6 =8.12/4.4/30.12ms, flip angle=40°, matrix size=1066×924, voxel size=0.15×0.15mm2, slice thickness = 0.65mm, ten slices, with cardiac gating, flow compensation. QSM reconstruction: Noise amplification, a major issue in inverse problems, manifests as streaking artifacts and quantification errors in QSM. At this resolution, ~0.15mm, noise in the signal is severe for high quality QSM and is challenging for imaging the substructure of cortical areas. In this study, we proposed a new QSM reconstruction method specially accounting for the noise effects. By using a non-linear formation of the measured phase to magnetic susceptibility and incorporating the k-space under-sampling and weighting, the proposed improved method based on compress sensing (iCS) solves the following equation: $$$χ=min{||F-1·Wkspace·F(exp(F-1D2·Fχ)- exp(φ))||2 +λ1·||ψχ||1 + λ2·TV(χ)}$$$, F and F-1 are Fourier transform and inverse Fourier transform, respectively. ψ is wavelet transform. TV stands for total variation. λ1 and λ2 are the penalty terms. Wkspcae is the k-space weighting term and we adopted D2 for k-space weighting2. Eq. 1 can be solved iteratively using the conjugate gradient (CG) solver. To address the issue of limited number of slices, in this study, wrapped phase was unwrapped using a 2D Laplacian-based phase unwrapping method and the background phase was removed using the 2D V_SHARP method3. High quality cortical vasculature was computed using susceptibility map weighted imaging (SMWI)4.Results
Fig.1 shows examples of magnitude image (sum of the square root over echoes), R2* image, the normalized unwrapped phase, tissue phase maps and QSM images. The R2* image fitted from multi-echo magnitude has low SNR which obscures the detailed cortical structures. The tissue phase after background phase removal still has low SNR and cortical layers are invisible. Many anatomical details, including veins and cortical layers, become visible on the high quality QSM image (λ1 =4x10⁻⁵ and λ2= 2x10⁻⁴) by suppressing the noise. As shown in Fig.1f, magnetic susceptibility variations across the cortical thickness are observed. Up to six apparent myelin/iron layers in cortex are revealed by QSM. Intensity profile along a single projection through the cortex (black line in f) shows that cortex in this area is ~3mm and the thickness of each layer can be calculated. For example, layer 1 has a thickness of ~300μm and has a paramagnetic susceptibility. Fig.2c shows the SMWI images and fig.2d shows a maximal intensity projection of the reconstructed SMWI through six slices. SMWI based on the magnitude and QSM, avoiding artifacts induced by non-local phase images, provides high-quality human cortical vasculature as pointed by the red arrow.Discussion
The results presented here indicate that high-field MRI combined with high density cortical coils and a novel QSM algorithm allows in vivo brain cortex imaging at high CNR and high resolution. At this resolution, we were able to determine the underlying magnetic susceptibility that enables resolving cortical substructure with fine details, quantification of myelin and neuronal density of cortical layers, and quantification of small vessel structures. For example, SMWI can depict the vessels with accurate width and shape edge, especially for small vessels in the cortical areas. The observed cortical susceptibility contrast can originate from a variety of sources, e.g. tissue iron, myelin content and deoxygenated hemoglobin in blood1.Conclusion
Our work revealed up to six apparent magnetic susceptibility layers in human brain cortex and we also show the complex vasculature in the brain cortical areas at 7T. Cortical susceptibility mapping provides new quantitative measurements of in vivo human brain cortical substructures.Acknowledgements
NIMH 096979 and NIH BRAIN Initiative U01 EB025162References
1. Duyn, J.H., et al., High-field MRI of brain cortical substructure based on signal phase. Proceedings of the National Academy of Sciences, 2007. 104(28): p. 11796-11801. 2.Wu, B., et al., Whole brain susceptibility mapping using compressed sensing. Magnetic resonance in medicine, 2012. 67(1): p. 137-147. 3. Wei, H., et al., Joint 2D and 3D phase processing for quantitative susceptibility mapping: application to 2D echo‐planar imaging. NMR in Biomedicine, 2017. 30(4). 4. Gho, S.M., et al., Susceptibility map‐weighted imaging (SMWI) for neuroimaging. Magnetic resonance in medicine, 2014. 72(2): p. 337-346.Figures
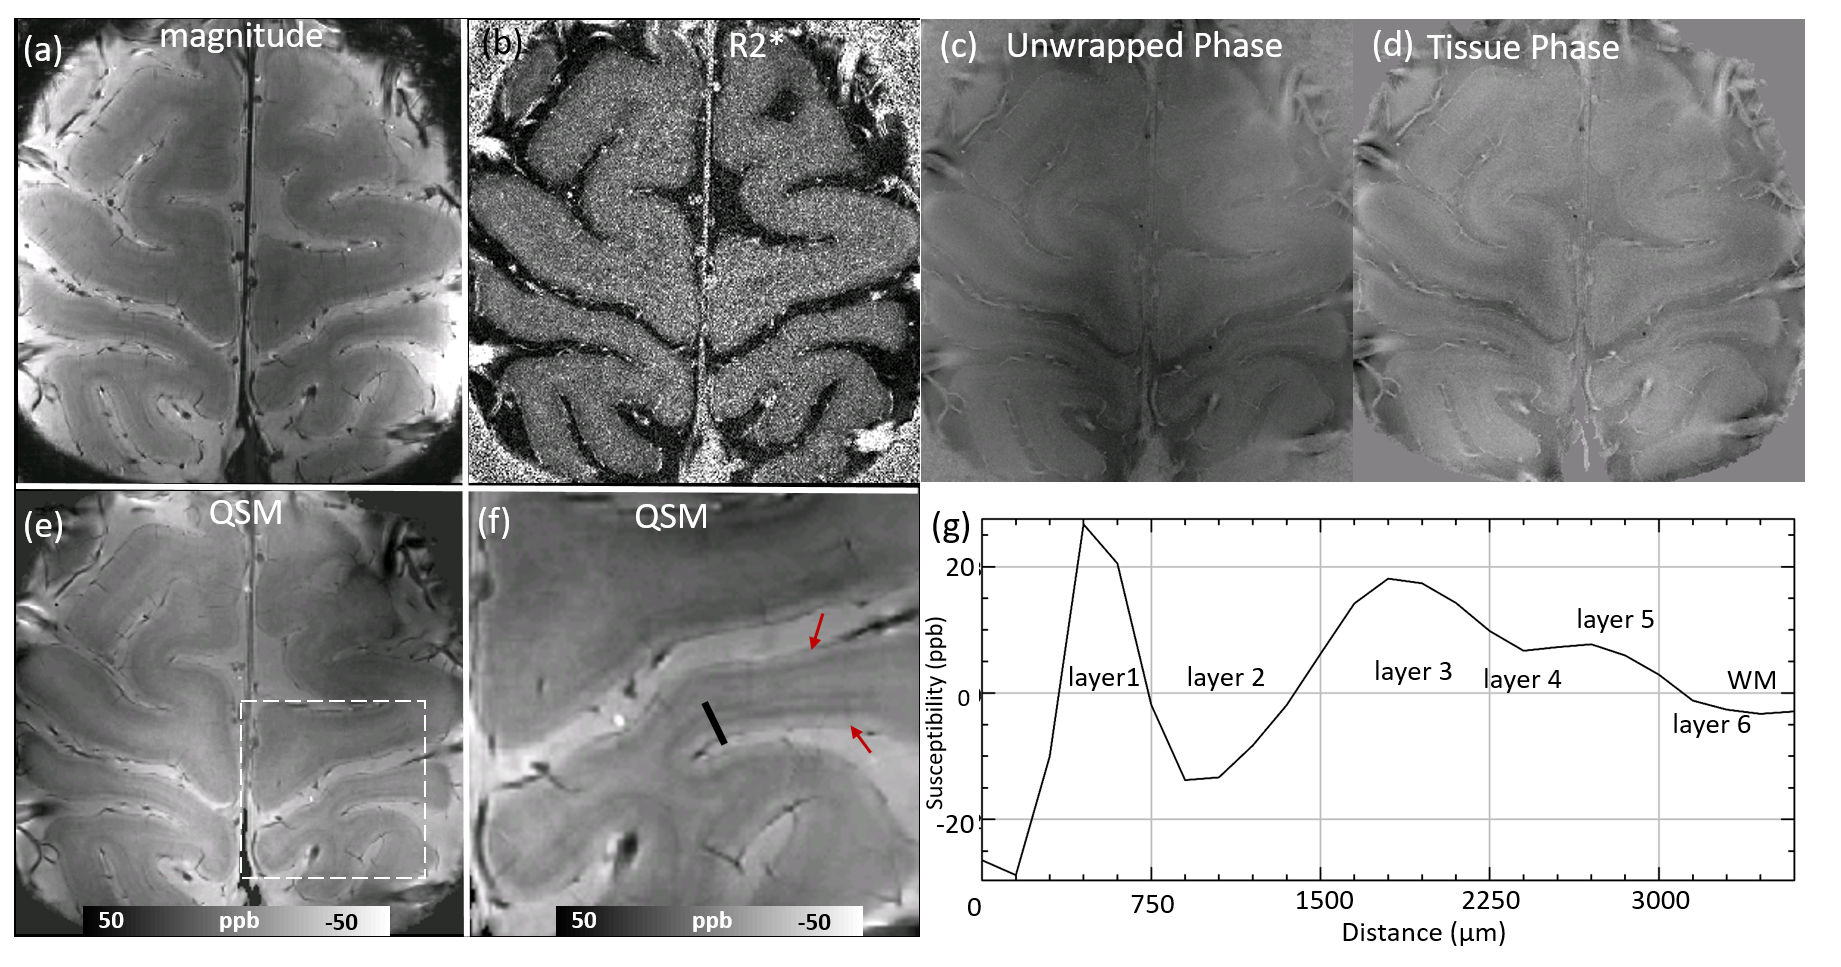
Fig.1. Example of GRE magnitude, R2*, tissue phase and QSM images in motor cortex acquired at a 150x150μm inplane resolution. (b) R2* image. (c) Normalized phase map. (d) Tissue phase map. (e, f) QSM images computed using iCS can effectively suppress the noise effects and reveal fine detail cortical substructure. (g) The susceptibility line profile along the black line as shown in (f) across the cortex. Red arrows in f indicate the cortical layers observed using QSM.
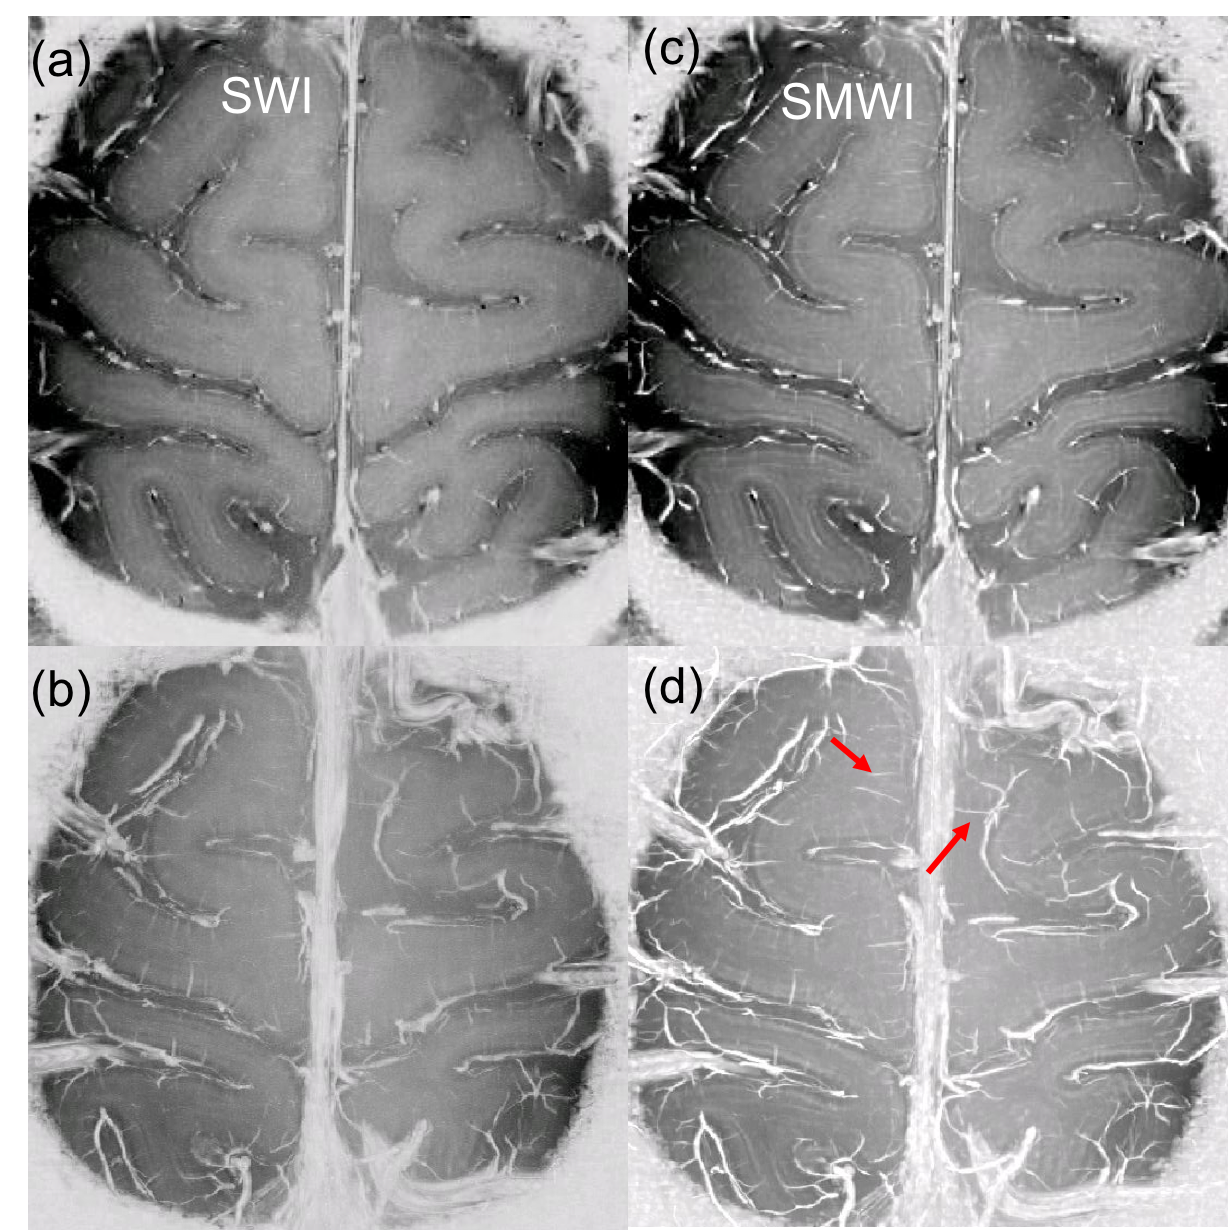
Fig.2. Example of (a) SWI and (c) SMWI and (b,d) a maximal intensity projection of the reconstructed SWI and SMWI of the cortex, respectively. Red arrow points to the small vessel observed on the SMWI image.