5004
GRE Phase Contrast of the Brain at Ultra-Short TE in Patients with Multiple SclerosisHongjiang Wei1, Peng Cao2, Roland Henry2, Peder Larson2, and Chunlei Liu1
1EECS, University of California, Berkeley, Berkeley, CA, United States, 2Radiology and Biomedical Imaging, UCSF School of Medicine, San Francisco, CA, United States
Synopsis
The purpose of this study was to determine whether gradient-echo proton images of the brain exhibit any phase contrast at UTE and whether this contrast can be used to improve the characterization of tissue microstructure in the brain. Our data demonstrated that UTE images of the brain can attain strong phase contrast even at a TE of 226ms by using off-resonance RF pulses for selective saturation. UTE phase in an MS patient shows a strong contrast with surrounding white matters.
Introduction
Image phase measured by gradient-echo sequences has provided a new source of MRI contrast. Phase images of the brain have been largely obtained at long echo times as maximum phase signal-to-noise ratio is achieved at TE = T2* (~40 ms at 3T)1. The structures of the brain, however, are compartmentalized with a wide range of signal relaxation times. At such long TE, the short-T2 and ultra-short-T2 (< 1 ms)2 components are largely attenuated and contribute minimally to phase contrast. So far, direct visualization of short and ultra-short-T2 phase in the brain remains challenging. The purpose of this study was to determine whether gradient-echo proton images of the brain exhibit any phase contrast at UTE and whether this contrast can be used to improve the characterization of tissue microstructure in the brain. Our data demonstrated that UTE images of the brain can attain strong phase contrast even at a TE of 226ms by using off-resonance RF pulses for selective saturation. UTE phase in an MS patient shows a strong contrast with surrounding white matters.Methods
Brain data were acquired at 7T (MR950, GE Healthcare, Waukesha, WI) and were sampled with a 3D radial trajectory. The readout duration was 1.024 ms, and flip angle = 10°. To evaluate the phase as a function of TE, volunteers and patients with MS were also scanned with different echo times, TR = 20 ms, TEs = [0.226, 2.65, 5.1, 15] ms and [0.226, 2.65, 5.1, 7.656] ms, isotropic spatial resolution = 2x2x2 mm3, scan time = 28 minutes. To assess phase contribution of the ultra-short-T2 components, off-resonance adiabatic pulses (as shown in Fig.1) were applied to partially saturate the broad ultra-short-T2 resonance. After each saturation preparation, 10 repetitions of excitation and readout were played out. Images were reconstructed on a coil-by-coil basis using 3D gridding3. After gridding reconstruction, phase images in Cartesian space were calculated for each coil separately. To reconstruct images of the saturated component, as shown in Fig.2, a difference image, Δmi, was computed for each coil by subtracting the image acquired with saturation, mi(sat), from the image acquired without saturation, mi(nos). After the subtraction, a magnitude image was then computed as the square root of the sum of squares of all coils; a phase image was computed by combining phase of all coils weighted by coil sensitivity maps. To remove phase induced by sources outside the brain, the combined phase was further filtered with the spherical-mean-value filtering4.Results
The reversed contrast between saturated signal at UTE and standard GRE at long TE can be visualized by comparing the saturated signal acquired at gradually increasing echo times (Fig. 3). Overall gray matter gradually changed from positive to negative and white matter changed from negative to positive. As pointed by arrows in Fig.3, The white gray matter contrast was completely reversed at TE = 15 ms compared to that at TE= 0.226 ms. The magnitude and phase images of saturated components using UTE sequence on an MS patient are shown in Fig. 4. Similar reversed contrast between the saturated signal at UTE and longer TE was observed. As expected, when demyelination occurs in the MS lesions, the frequency shift of the saturated signals in these lesions will become more negative (resulting in a more positive phase shift as shown by red arrow), appearing similar to that of CSF.Discussion
We showed that, with off-resonance saturation pulses, brain tissues exhibited visible phase contrast at a TE as short as 226 ms at 7 T. The phase properties of the saturated signals were evaluated by subtracting signals with saturation from signals without saturation. We expect the off-resonance pulses to create direct saturation of ultra-short-T2 components and indirect saturation of longer-T2 components via magnetization transfer. This evaluation led to two unique findings: 1) phase contrast of saturated components between gray and white matter is reversed compared that of long-T2 signals and 2) phase contrast at UTE in an MS patient allowed better differentiation of lesions from the surrounding normal white matters than that at long TE.Conculsion
We have shown off-resonance saturation together with UTE offers a new way to generate phase contrast in the brain and may provide valuable new information to probe tissue microstructure.Acknowledgements
No acknowledgement found.References
1. Wu, B., et al., Fast and tissue-optimized mapping of magnetic susceptibility and T2* with multi-echo and multi-shot spirals. Neuroimage, 2012. 59(1): p. 297-305. 2. Du, J., et al., Ultrashort echo time (UTE) magnetic resonance imaging of the short T2 components in the white matter of the brain using a clinical 3T scanner. Neuroimage, 2014. 87: p. 32-41. 3. Beatty, P.J., D.G. Nishimura, and J.M. Pauly, Rapid gridding reconstruction with a minimal oversampling ratio. IEEE Trans Med Imaging, 2005. 24(6): p. 799-808. 4. Wu, B., et al., Whole brain susceptibility mapping using compressed sensing. Magn Reson Med, 2012. 67(1): p. 137-47.Figures
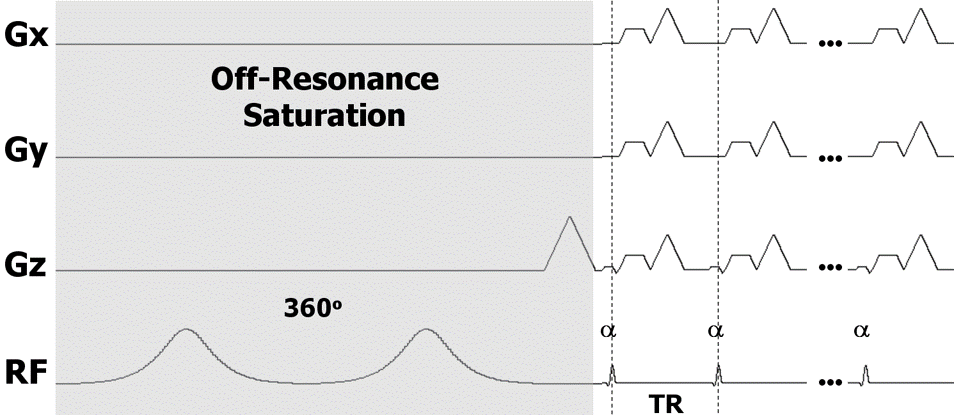
Figure 1. Diagram
of the UTE pulse sequence with off-resonance saturation. The saturation pulse
consists of two consecutive 180o adiabatic RF pulses. A
minimum-phase pulse is used for excitation followed by 3D radial readout
gradients. Multiple excitations and readouts are performed after each
saturation pulse to improve efficiency.
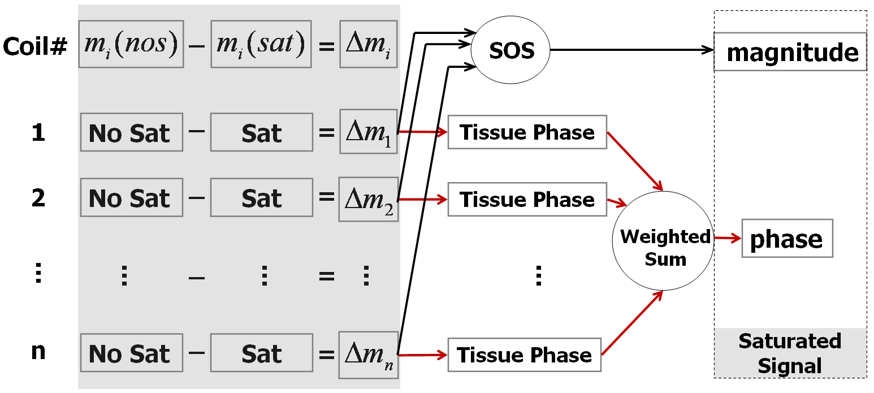
Figure 2. Flow
chart of the algorithm for reconstructing images of the saturated signal.
Complex subtraction was performed for each coil. A magnitude image was
calculated by taking the square root of sum of squares. Tissue phase was
obtained by unwrapping and filtering. The final phase was calculated by
weighting phase images from each coil by the corresponding coil sensitivities.
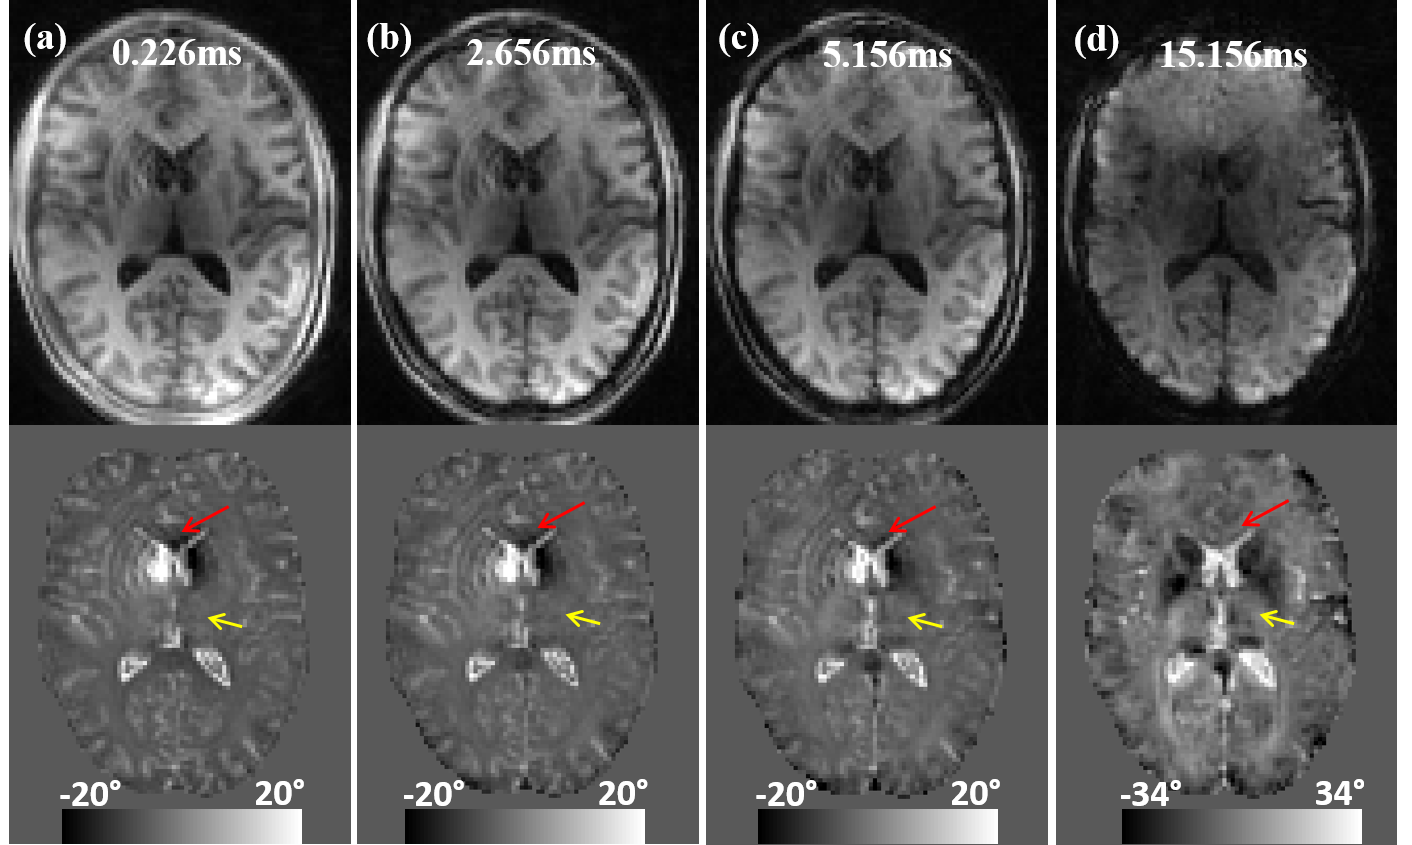
Figure 3. Dependence of the saturated signal on TE. A representative axial slice of normalized magnitude and phase images acquired at different TEs. The reverse phase contrast between gray and whiter matter are visible. Note that the magnitude and phase images at TE = 15.156 ms (d) are without saturation.
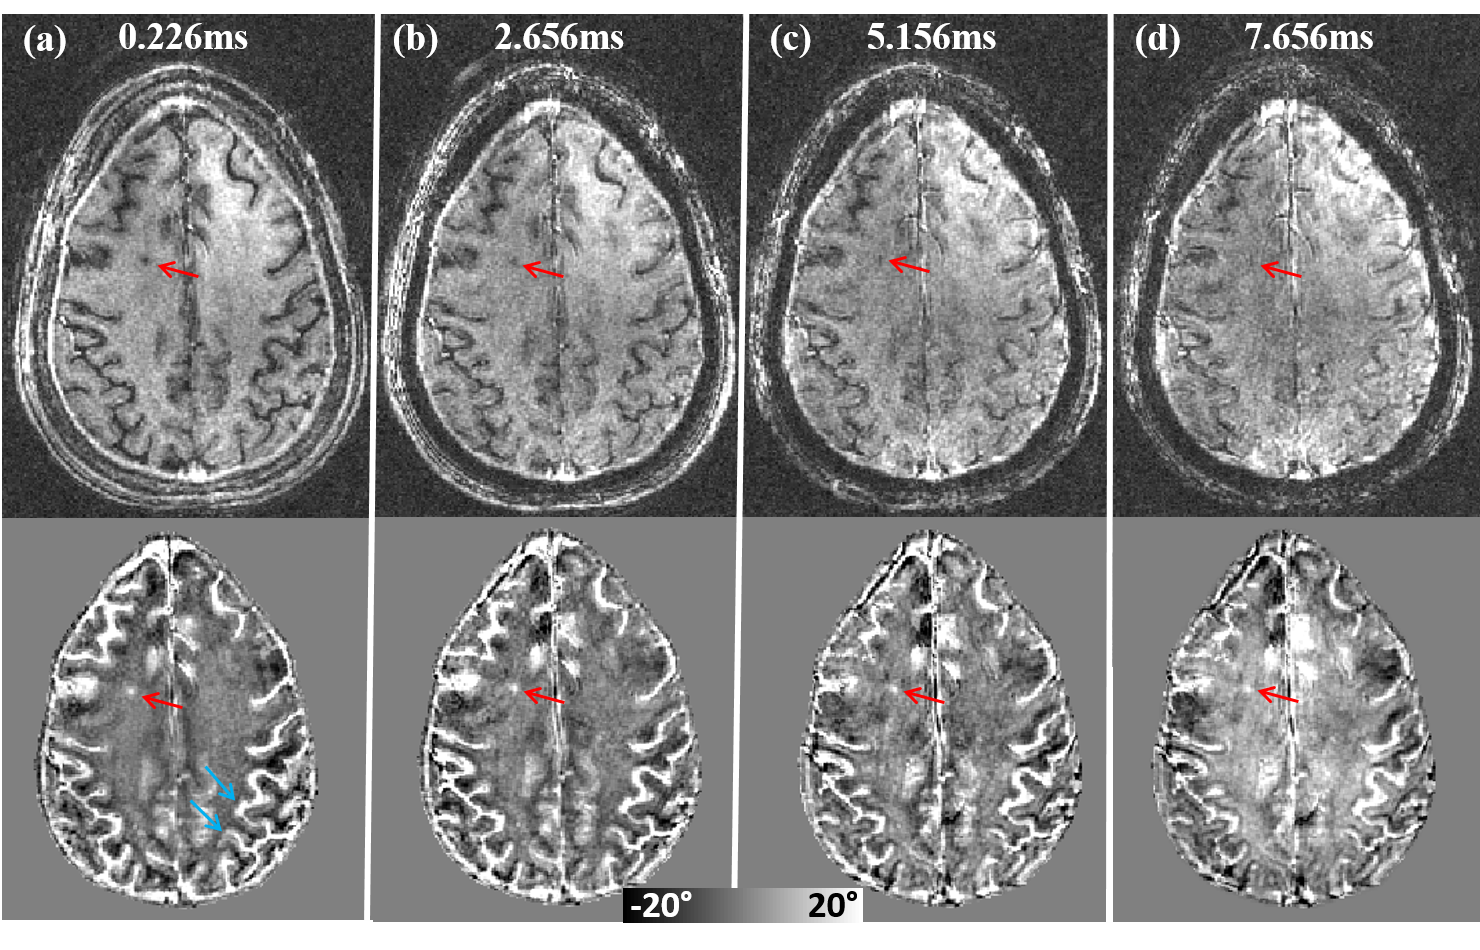
Figure 4. Dependence
of the saturated signal on TE in an MS patient. Top row: magnitude images.
Bottom row: phase images. At TE = 0.226 ms, MS lesion shows a strong contrast
with surroundings. As TE increases, phase contrast between the lesion and
surrounding white matters decrease gradually. Note that the magnitude and phase
images at TE = 7.656 ms (d) are without saturation.