4998
Simultaneous Analyses and Reconstruction of Quantitative Susceptibility Mapping and Voxel-based Morphometry Using Magnetization-prepared Spoiled Turbo Multiple Gradient Echo1Department of Radiology, Nagoya City University Hospital, Nagoya, Japan
Synopsis
Quantitative susceptibility mapping (QSM) and voxel-based morphometry (VBM) analyses are helpful in detecting an abnormal iron overload and the regional change of volume in the gray and white matters, respectively. This abstract presents a novel method for simultaneous analyses of QSM and VBM using magnetization-prepared spoiled turbo multiple gradient echo sequence with inversion pulse for QSM sequence which provides 3D T1-weighted structural images for VBM and multi-echo phase images for QSM on single scan.
Purpose
Quantitative susceptibility mapping (QSM) is a new quantitative reconstruction method is useful for detecting the abnormal iron overload. The usefulness of it was exhibited for several neurodegenerative diseases1-4.Numerical researches showed that voxel-based morphometry (VBM) plays a supplementary role in diagnosis of these neurodegenerative diseases and its methodology has been already established5,6. We introduce here a novel method for simultaneous analyses of QSM and VBM using single dataset.
Materials and Methods
On a 3.0 T MRI (Ingenia, Philips), 1 mm3 iso-voxel 3D Magnetization-Prepared spoiled turbo multiple gradient echo sequence with inversion pulse for QSM (MP-QSM) which serves 3D T1-weighted and multi-echo phase images was conducted in human experiments on 17 healthy volunteers (27 ± 5 years old). The scan parameters for MP-QSM were: #TE = 5, TE1 = 6.0 ms, ∆TE = 6.2 ms, TR = 35 ms, flip angle = 15°, inversion time = 1200 ms, shot interval = 2400 ms, turbo factor = 62. Flowchart of simultaneous analysis in MP-QSM is shown in Fig. 1. The spoiled multiple gradient echo (mGRE) and magnetization-prepared spoiled turbo gradient echo (MP-GRE) datasets were collected as references for QSM and VBM, respectively. The scan parameters for mGRE and MP-GRE were the same as MP-QSM except that not applying an inversion pulse for QSM and that TR = 10 ms, turbo factor = 184, and single echo acquisition for VBM. To demonstrate the benefit of the proposed simultaneous analysis, each analysis compared MP-QSM with conventional sequences acquired separately.
Voxel-based morphometry analysis
The magnitude image of first echo in MP-QSM was segmented into the white matter (WM), gray matter (GM), and cerebrospinal fluid (CSF) on SPM12. The GM and WM images were transformed to MNI space for spatial normalization by using the subject-specific template generated from diffeomorphic anatomical registration using exponentiated Lie algebra algorithm7. These images were smoothed using Gaussian kernel and modulated to preserve brain volume. Voxel-wise whole brain comparisons were made to determine the regions of differences in GM and WM between MP-QSM and MP-GRE by a one sample t-test with family-wise error correction using subtracted image of both sequences. The volumes of WM, GM, and CSF were also determined.
Quantitative susceptibility mapping
The local field map was computed from multi-echo phase images using 3D weighted Laplacian-based phase unwrapping8 and non-regularized variable kernels sophisticated harmonic artifact reduction for phase data technique9. The susceptibility map using MP-QSM was reconstructed by below equation like morphology enabled dipole inversion (MEDI) +0 method10.
$$argmin_{\chi}{\parallel}W(F^{-1}D\chi-\phi){\parallel}_2^2+\lambda_{MEDI}{\parallel}MF^{-1}G_{i}\chi{\parallel}_1+\lambda_{CSF}{\parallel}M_{CSF}(F^{-1}\chi-\overline{M_{CSF}}){\parallel}_2^2$$
where W is a spatial weighting term, D is the dipole kernel, M is structural weighted binary mask based on segmentation result of VBM, and Gi are gradient kernels in Fourier domain. MCSF, $$$\overline{M_{CSF}}$$$ and are binary mask of CSF images, and mean susceptibility value within MCSF. The CSF images segmented for VBM are combined with dipole inversion for improving CSF homogeneity. To detect the structural edge, the GM, WM, and CSF images were utilized to MEDI+0 algorithm. The susceptibility map using mGRE was estimated by MEDI algorithm11. The susceptibility values in regions of interest located at iron-rich tissues were determined.
Results and Discussions
T1
contrast is induced to the magnitude image in MP-QSM by inversion pulse, like
MP-GRE sequence (Fig. 2a and b). The contrast in mGRE between the gray and
white matters is not sufficient to perform VBM (Fig. 2c). All measured volumes in MP-QSM were approximately equivalent to
those in MP-GRE (Table1). However, the significant differences in GM and WM results
can be observed in Fig. 3. This is explained by that the magnitude image in MP-QSM
is easily contaminated by the signal of transition state, due to long TR and
small number of RF irradiation per shot interval. It is well-known that the VBM
result has a close relationship with acquisition parameters12. However, since
MP-QSM could measure each volume of the brain accurately, our result suggested that
MP-QSM is appropriate for VBM. The susceptibility maps were successful to
estimate in MP-QSM (Fig.4 a-c) and mGRE (Fig.4 d-f). The decrease of SNR of CSF
induced by inversion pulse in MP-QSM can lead to streaking artifact in
susceptibility map. However, the combination of weighted total variation with
structural edge based on segmentation and L2 regularization for CSF aided to
improve the image quality of susceptibility map in MP-QSM. Moreover, a
significant correlation was observed in susceptibility value between MP-QSM
and mGRE sequences (Fig. 4g).
These results in QSM and VBM reveal an availability of simultaneous analyses using MP-QSM.
Conclusion
The proposed simultaneous analysis and reconstruction makes it possible to acquire acceptable-quality images for QSM and VBM and to reduce scan time.
Acknowledgements
This work was supported by JSPS KAKENHI Grant Number 17K15805.
References
1. O'Callaghan J, Holmes H, Powell N, et al. Tissue magnetic susceptibility mapping as a marker of tau pathology in Alzheimer's disease. Neuroimage. 2017; 159: 334-45.
2. Guan X, Xuan M, Gu Q, et al. Regionally progressive accumulation of iron in Parkinson's disease as measured by quantitative susceptibility mapping. NMR Biomed. 2017; 30 (4): e3489.
3. Guan X, Xuan M, Gu Q, et al. Influence of regional iron on the motor impairments of Parkinson's disease: A quantitative susceptibility mapping study. J Magn Reson Imaging. 2017; 45 (5): 1335-42.
4. Stüber C, Pitt D, Wang Y. Iron in Multiple Sclerosis and Its Noninvasive Imaging with Quantitative Susceptibility Mapping. Int J Mol Sci. 2016; 17 (1): E100.
5. Shigemoto Y, Matsuda H, Kamiya K, et al. In vivo evaluation of gray and white matter volume loss in the parkinsonian variant of multiple system atrophy using SPM8 plus DARTEL for VBM. NeuroImage: Clinical. 2013; 2: 491-6.
6. Koikkalainen J, Rhodius-Meester H, Tolonen A, et al. Differential diagnosis of neurodegenerative diseases using structural MRI data. NeuroImage: Clinical. 2016; 11: 435-49.
7. Ashburner J. A fast diffeomorphic image registration algorithm. Neuroimage. 2007; 38 (1): 95-113.
8. Robinson SD, Bredies K, Khabipova D, et al. An illustrated comparison of processing methods for MR phase imaging and QSM: combining array coil signals and phase unwrapping. NMR Biomed. 2017; 30 (4): e3601.
9. Kan H, Arai N, Takizawa M, et al. Background Field Removal Technique using Non-regularized Variable Kernels Sophisticated Harmonic Artifact Reduction for Phase Data for Quantitative Susceptibility Mapping. Proc Intl Soc Mag Reson Med. 2017; 25: 1405.
10. Liu Z, Spincemaille P, Yao Y, et al. MEDI+0: Morphology enabled dipole inversion with automatic uniform cerebrospinal fluid zero reference for quantitative susceptibility mapping. Magn Reson Med. 2017: in press.
11. Liu T, Liu J, de Rochefort L, et al. Morphology enabled dipole inversion (MEDI) from a single-angle acquisition: Comparison with COSMOS in human brain imaging. Magn Reson Med. 2011; 66 (3): 777-83.
12. Brunton S, Gunasinghe C, Jones N, et al. A voxel-based morphometry comparison of the 3.0T ADNI-1 and ADNI-2 volumetric MRI protocols. Int J Geriatr Psychiatry. 2015; 30 (5): 531-8.
Figures
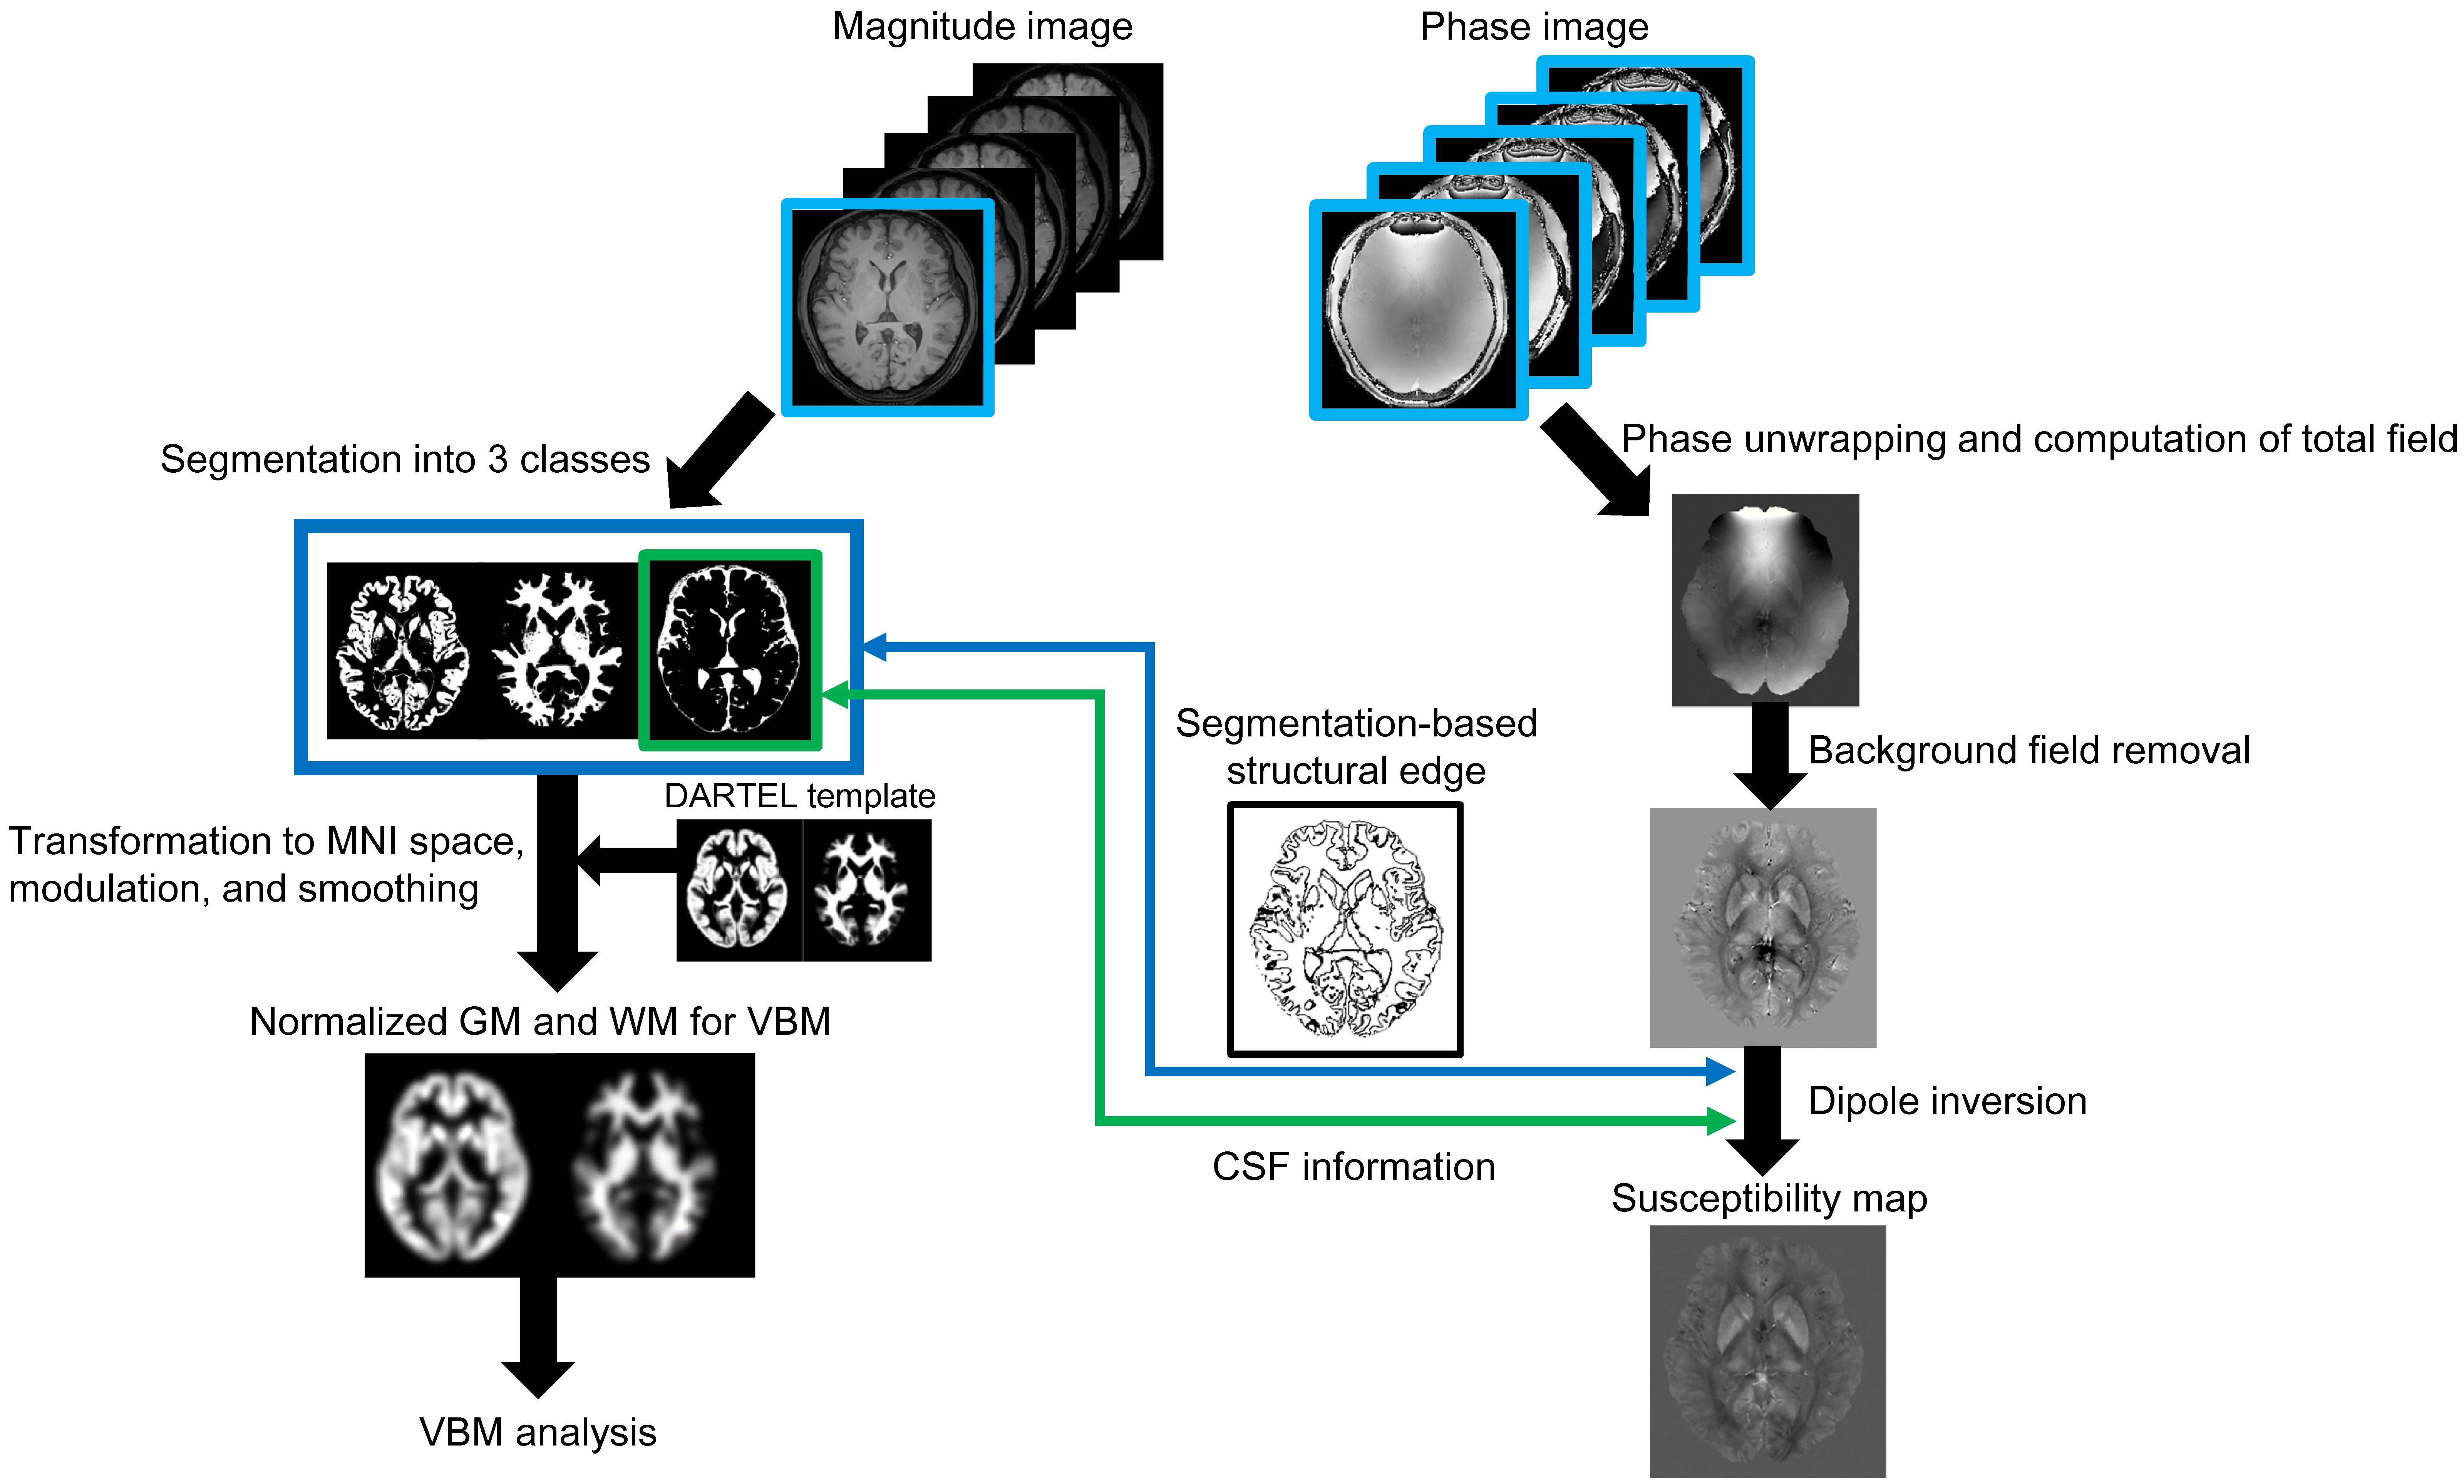
Fig. 1 Schematic flowchart of simultaneous analysis for quantitative susceptibility mapping (QSM) and voxel-based morphometry (VBM). The magnitude image of first echo in MP-QSM sequence is utilized to VBM analysis. Its image is segmented into 3 kinds of classes (whiter and gray matters, and cerebrospinal fluid) and, then, transformed to MNI space with volume modulation and spatial smoothing using pre-calculated template. The multi-echo phase images are initially unwrapped phase jump and computed local field removed background field. The susceptibility map was reconstructed by combination of spatial distribution of CSF and segmentation-based structural edge information obtained when performing VBM.
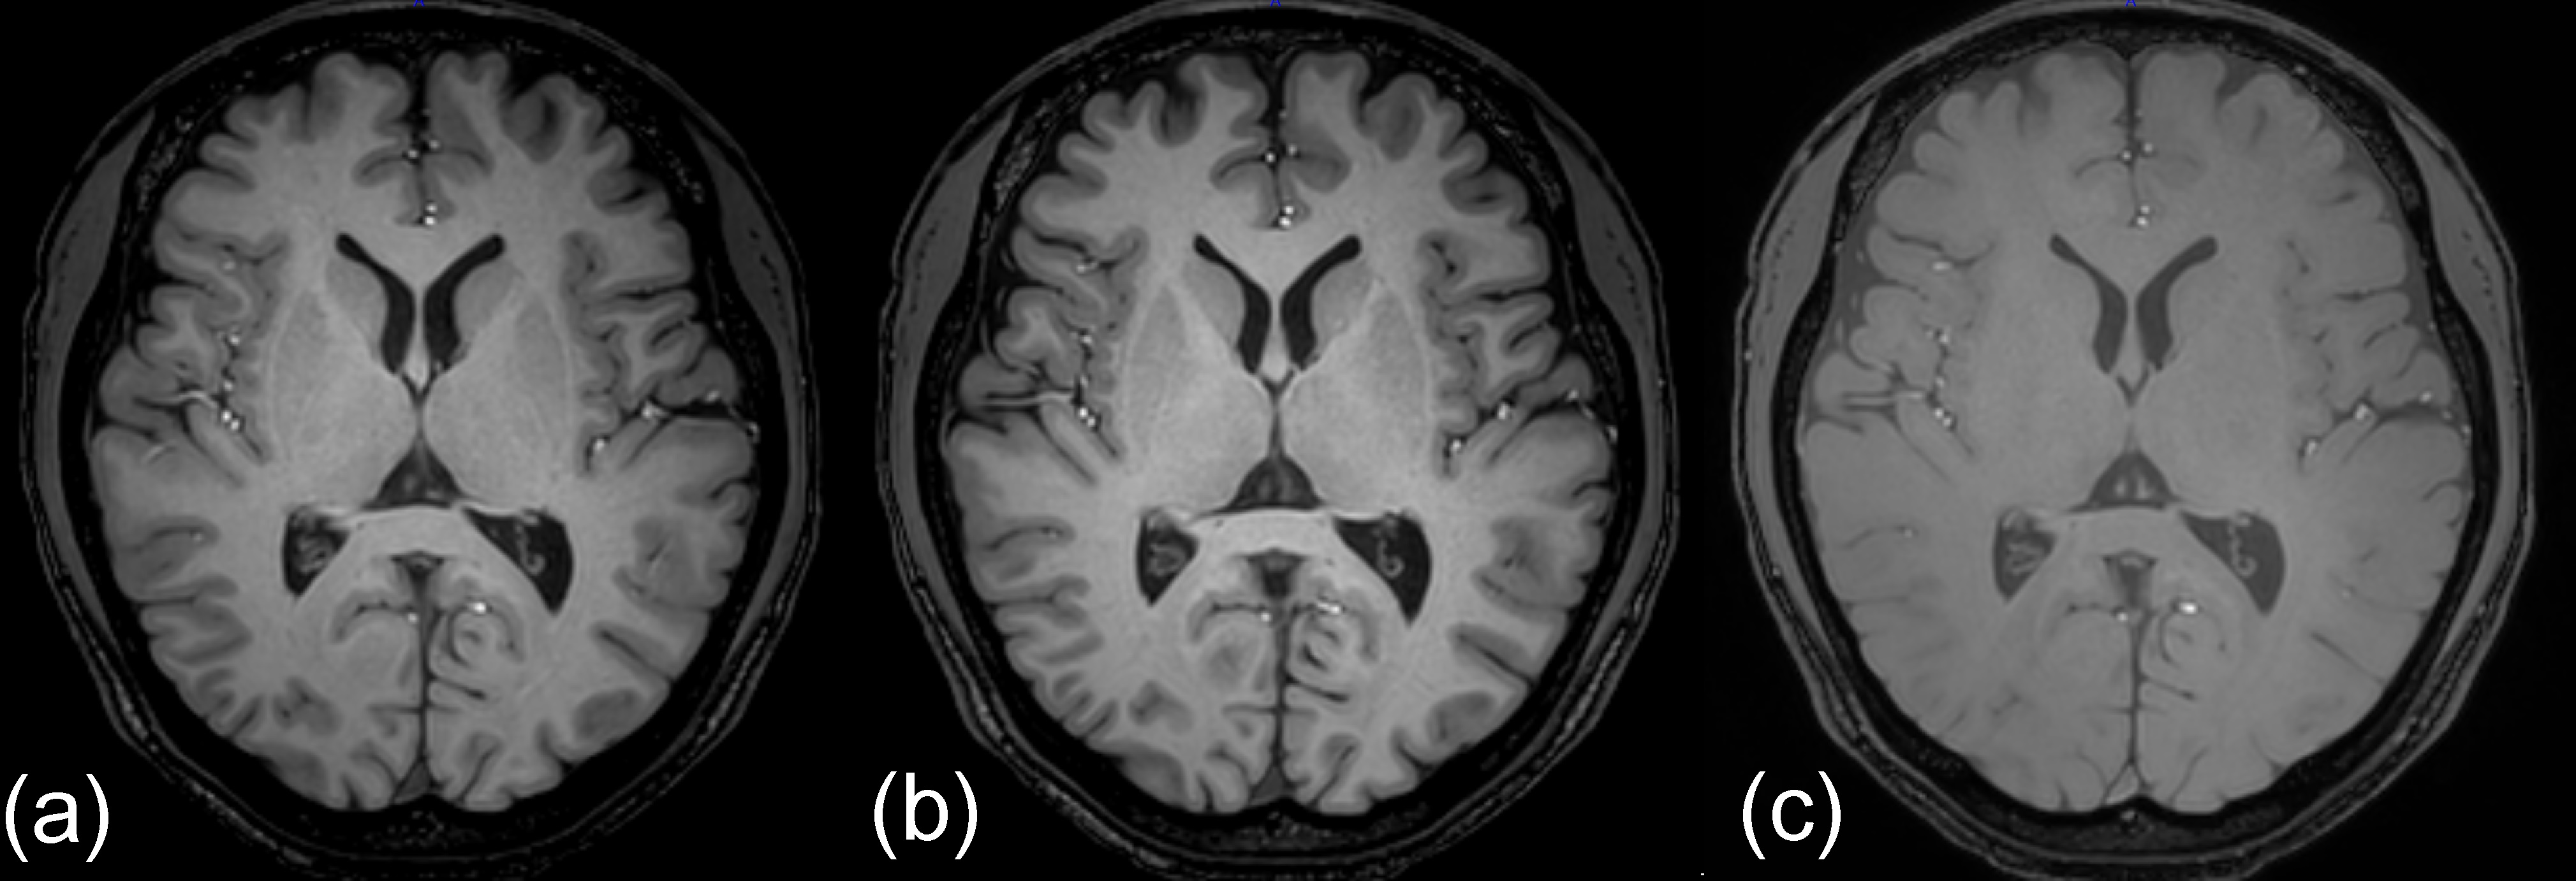
Fig. 2 Typical examples of magnitude image of (a) MP-QSM, (b) MP-GRE, and (c) mGRE. An inversion pulse induced obvious contrast between the white and gray matters. The low contrast of magnitude image in mGRE is not sufficient to perform voxel-based morphometry.
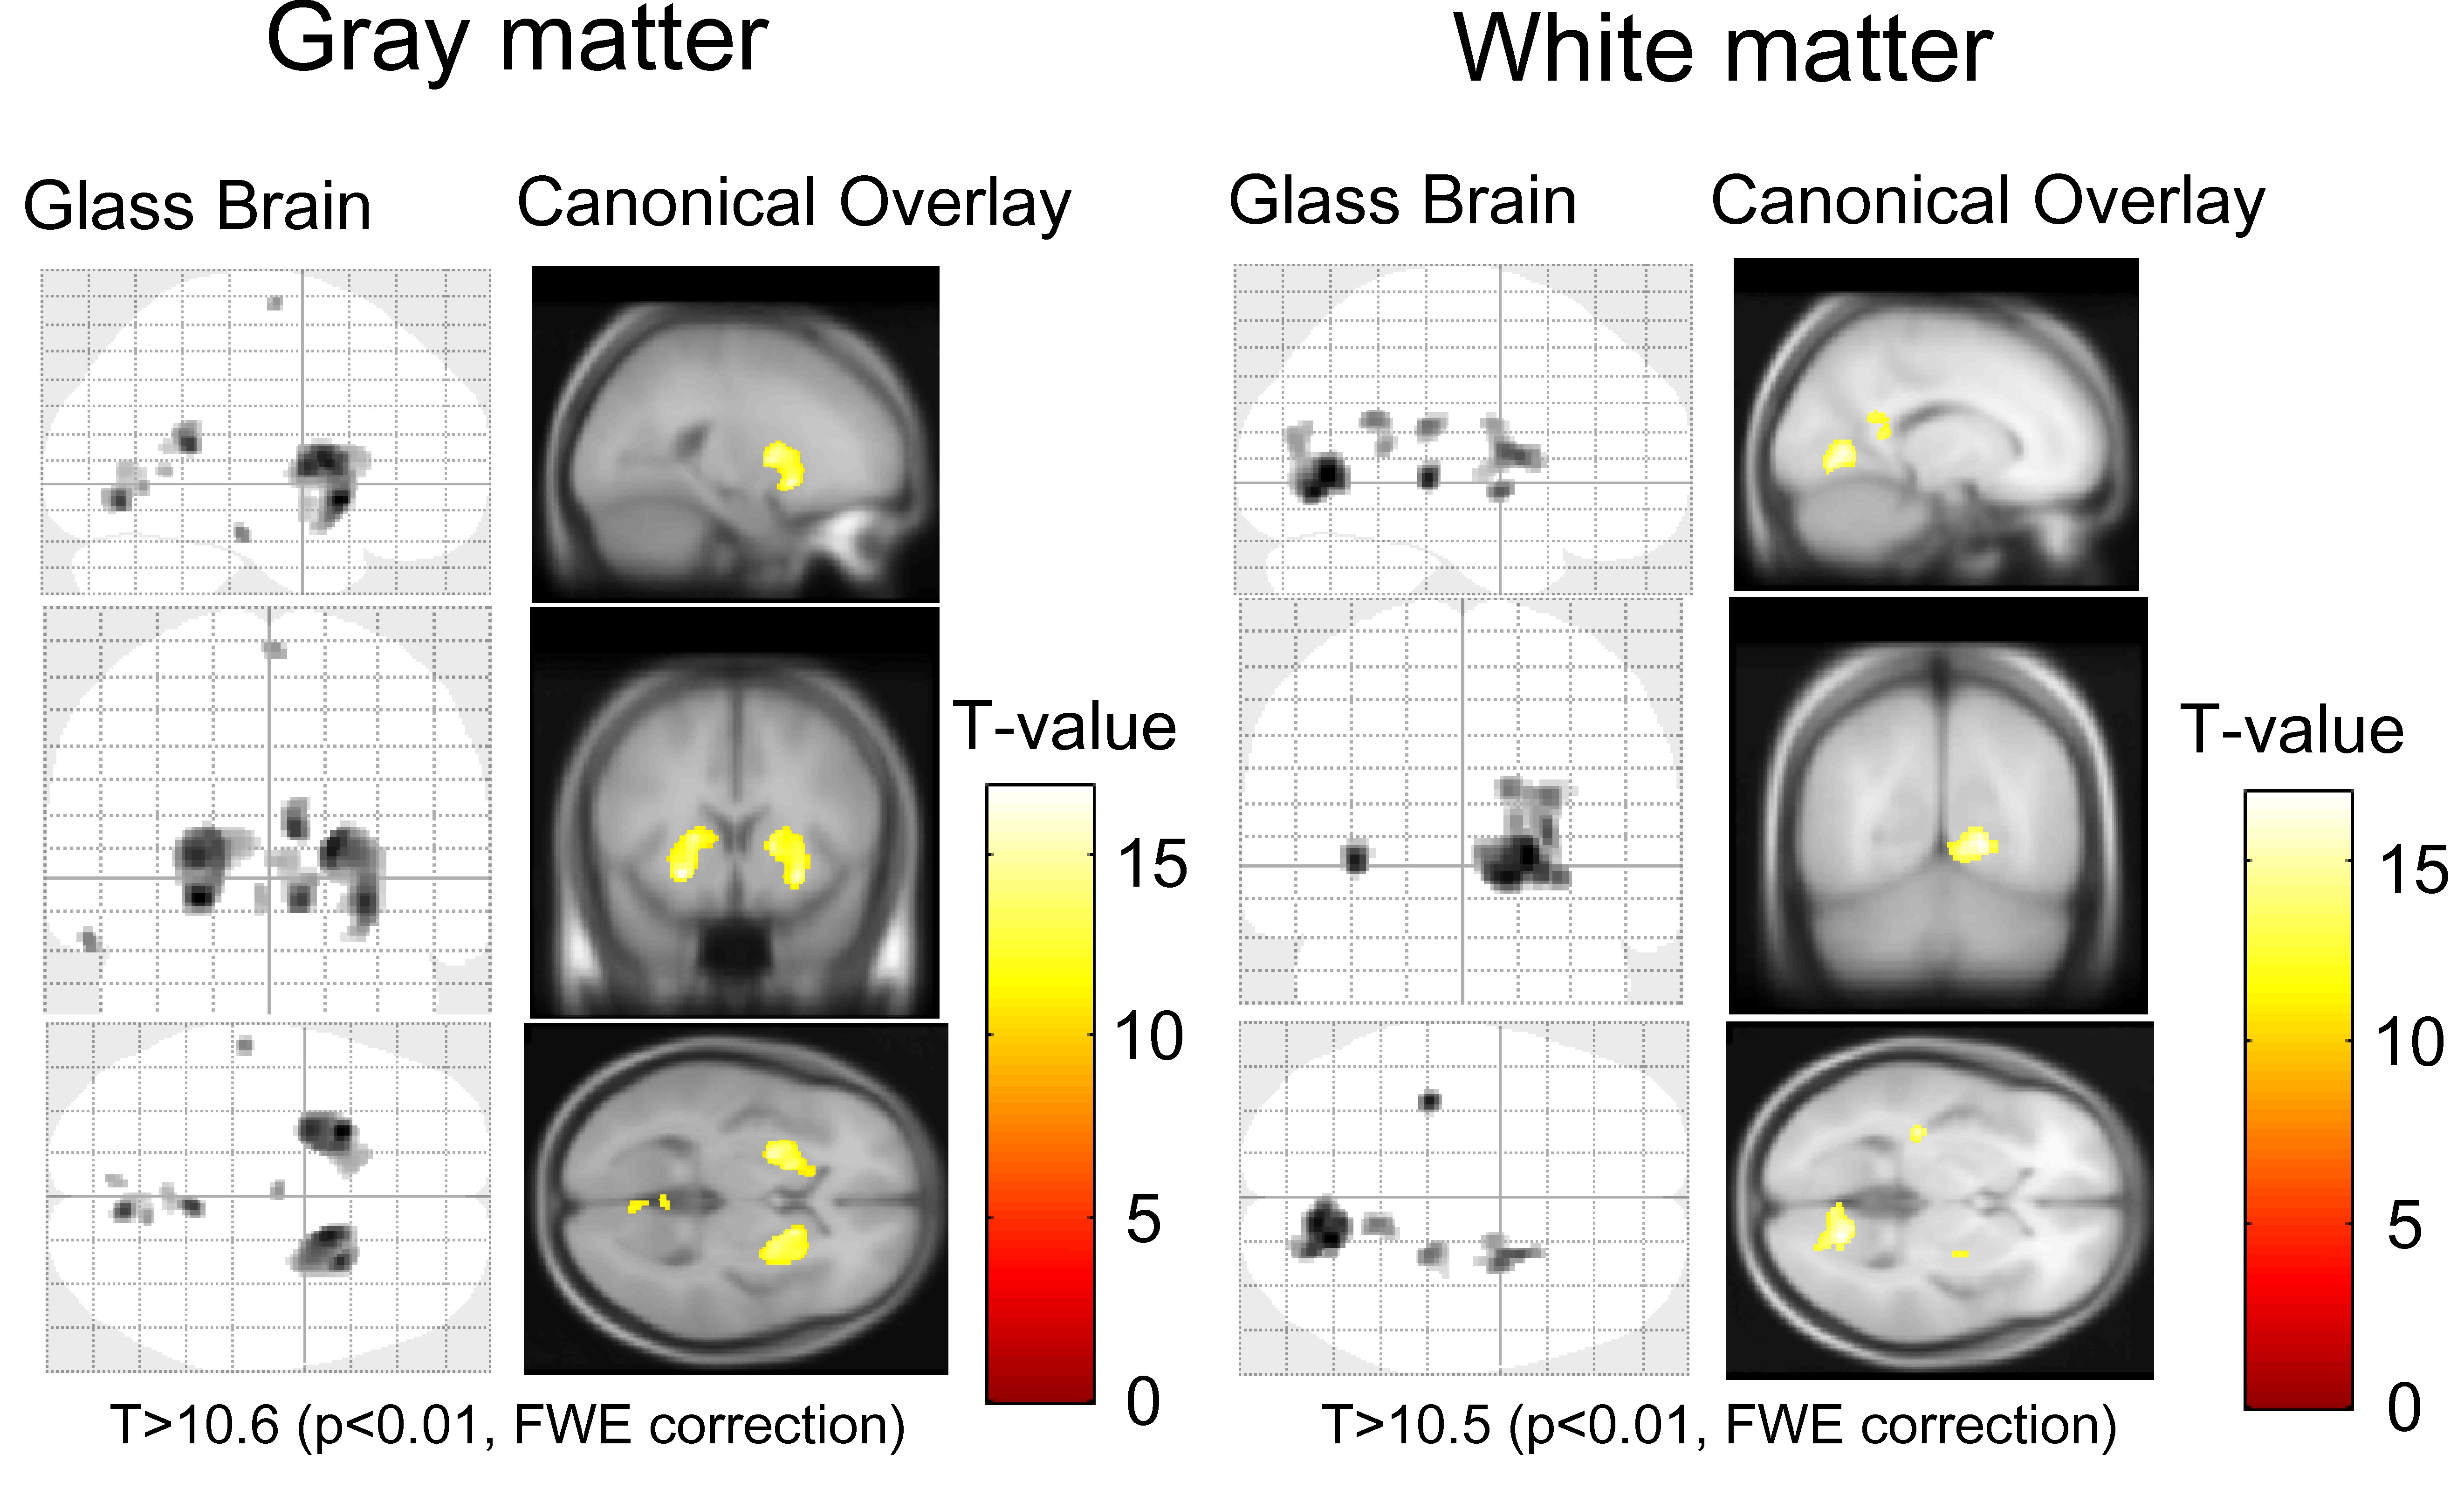
Fig. 3 Glass brain and canonical overlay showing significant regions of differences in the gray matter and white matter in MP-QSM compared to MP-GRE.

Fig. 4 Susceptibility maps in (a, b, c) MP-QSM and (d, e, f) mGRE. (g) Result of linear regression analysis in susceptibility values between MP-QSM and mGRE is shown. The regions of interest were located at the caudate nucleus, putamen, globus pallidus, red nucleus, substantia nigra, internal capsule, and dentate nucleus. It showed an excellent agreement in susceptibility values between MP-QSM and mGRE.
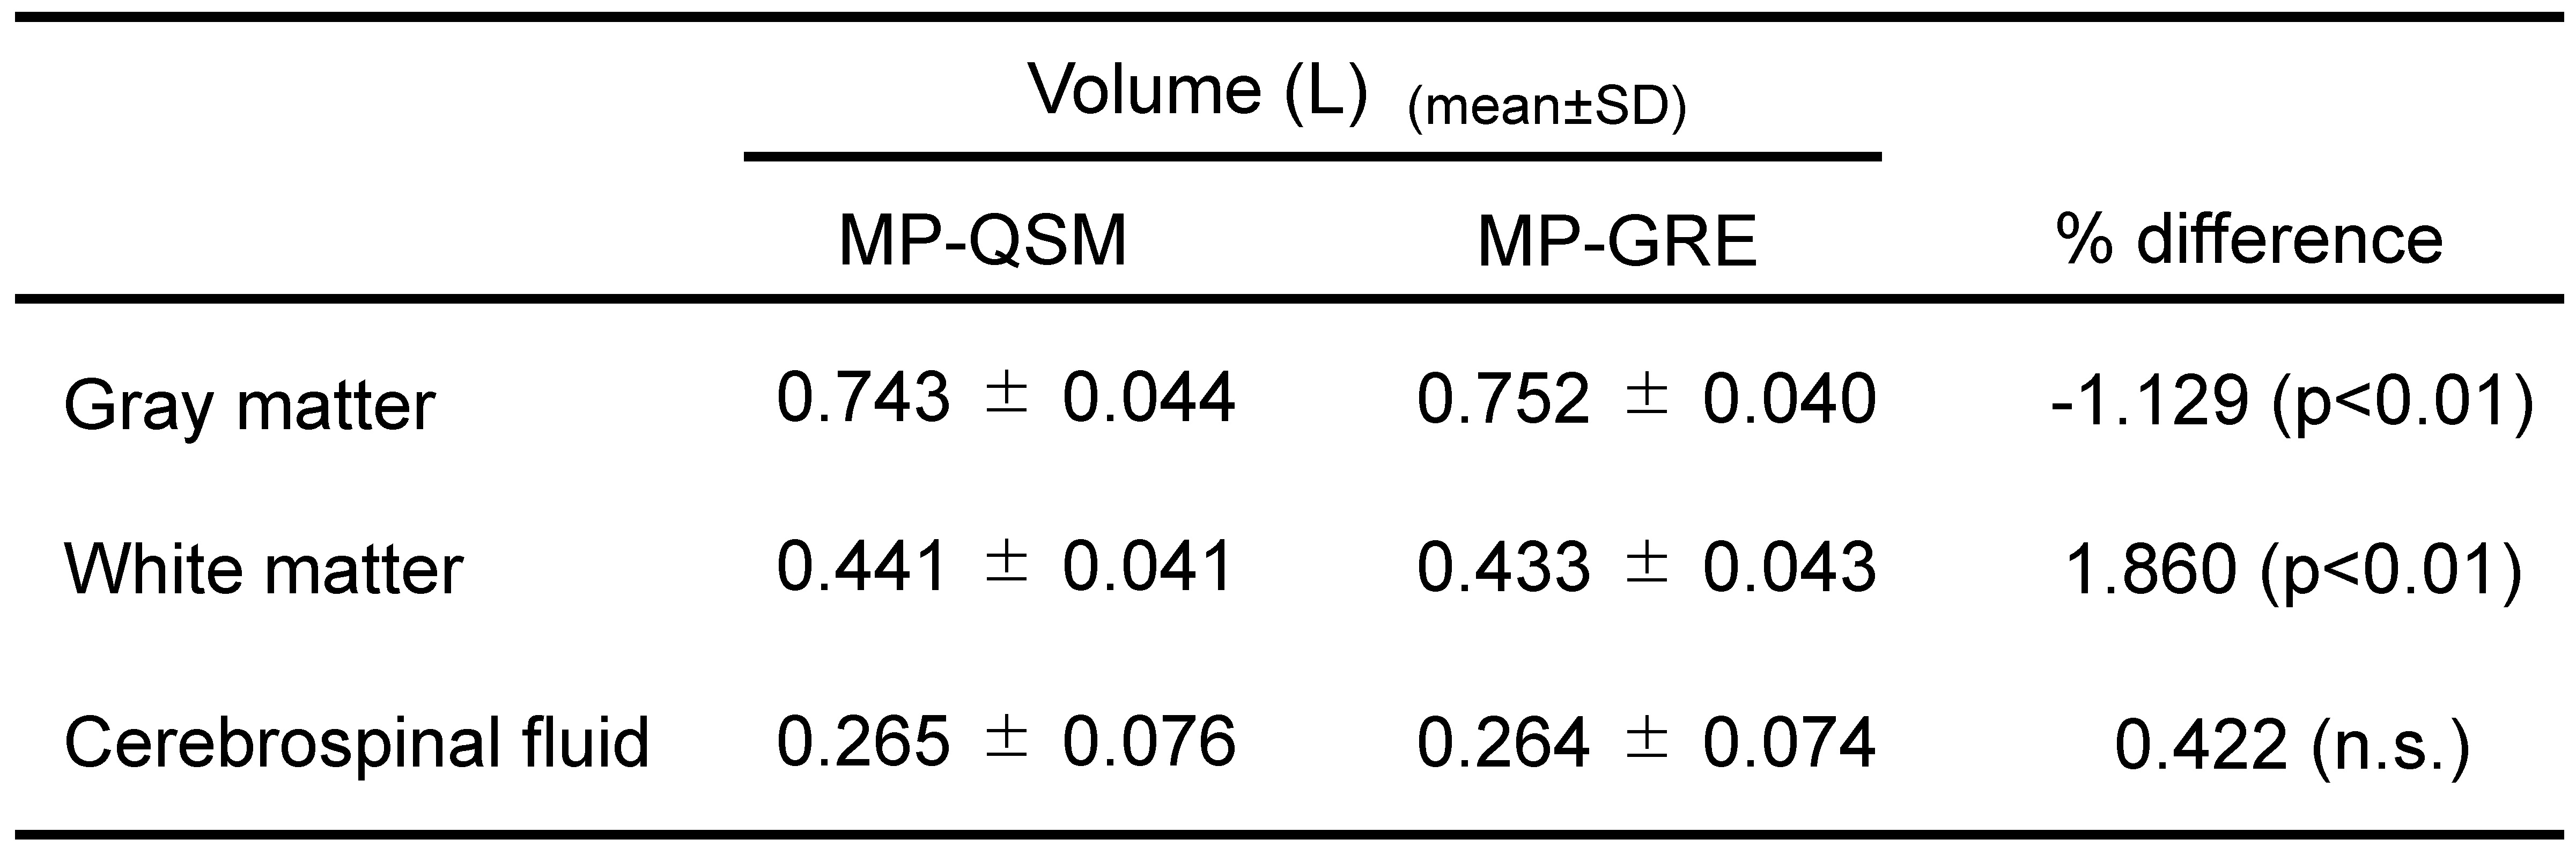
Table1 Volumes of gray matter, white matter, and cerebrospinal fluid. Significant differences were observed in the volumes of the gray matter and white matter.