4997
Accelerating 3D whole brain quantitative susceptibility mapping acquisition using compressed sensing1Center for In Vivo Microscopy, Department of Radiology, Duke University, Durham, NC, United States
Synopsis
To evaluate the feasibility of compressed sensing (CS) for accelerating quantitative susceptibility mapping (QSM) acquisition at a high spatial resolution in mouse brains (22.5 μm3, isotropic). This preliminary study shows that CS can be applied to significantly reduce the acquisition time of GRE MRI of mice brains at 9.4 T without losing apparent accuracy in quantitative susceptibility values.
INTRODUCTION
Quantitative susceptibility mapping (QSM), provides a method for quantitative mapping myelination, which plays a crucial role in several diseases in the central nervous system (CNS)1. The acquisition time can vary from a few minutes to a few hours, depending on image resolution, repetition time, and other scan parameters. Susceptibility tensor imaging (STI), which requires acquisition of several scans at multiple angles relative to B0, requires even longer acquisition times2. Therefore, any method to accelerate QSM acquisition is desirable. In this study, we provided a quantitative assessment of QSM with compressed sensing (CS-QSM) using computer simulation and post mortem experiments of the mouse brain at high spatial resolution (22.5 μm3, isotropic).METHODS
All animal studies were approved by the local Institutional Animal Care and Use Committee (IACUC). Adult male C57/BL6J mice (Jackson Laboratory, Bar Harbor, ME) were used for the studies. Fixed specimens were scanned at 9.4 T (Oxford 8.9-cm vertical bore; Agilent VnmrJ 4.0 imaging console) using a modified 3D spoiled-gradient-recalled (SPGR) sequence. Scan parameters were as follows: matrix size = 840 × 512 × 512, FOV = 18.9 × 11.52 × 11.52 mm3, flip angle = 55º, TE = 12 ms, 1 echo, and TR = 50 ms. The spatial resolution was 22.5 μm3 isotropic and the scan time was about 224 minutes for the fully sampled data. The scan time of CS experiments varied from 56 minutes to 14 minutes, depending on the acceleration factors (from 4.0 to 16.0). In this study, compressed sensing was applied on the k-space of gradient echo images to solve the complex image3. Various CS acceleration factors (1.0, 4.0, 5.1, 6.4, 8.0, 10.0, and 16.0, where 1.0 stands for the fully sampled data) were used to assess the accuracy for quantitative QSM in the brain. All phase and susceptibility analysis were conducted in STI suite (University of California, Berkeley)4.RESULTS
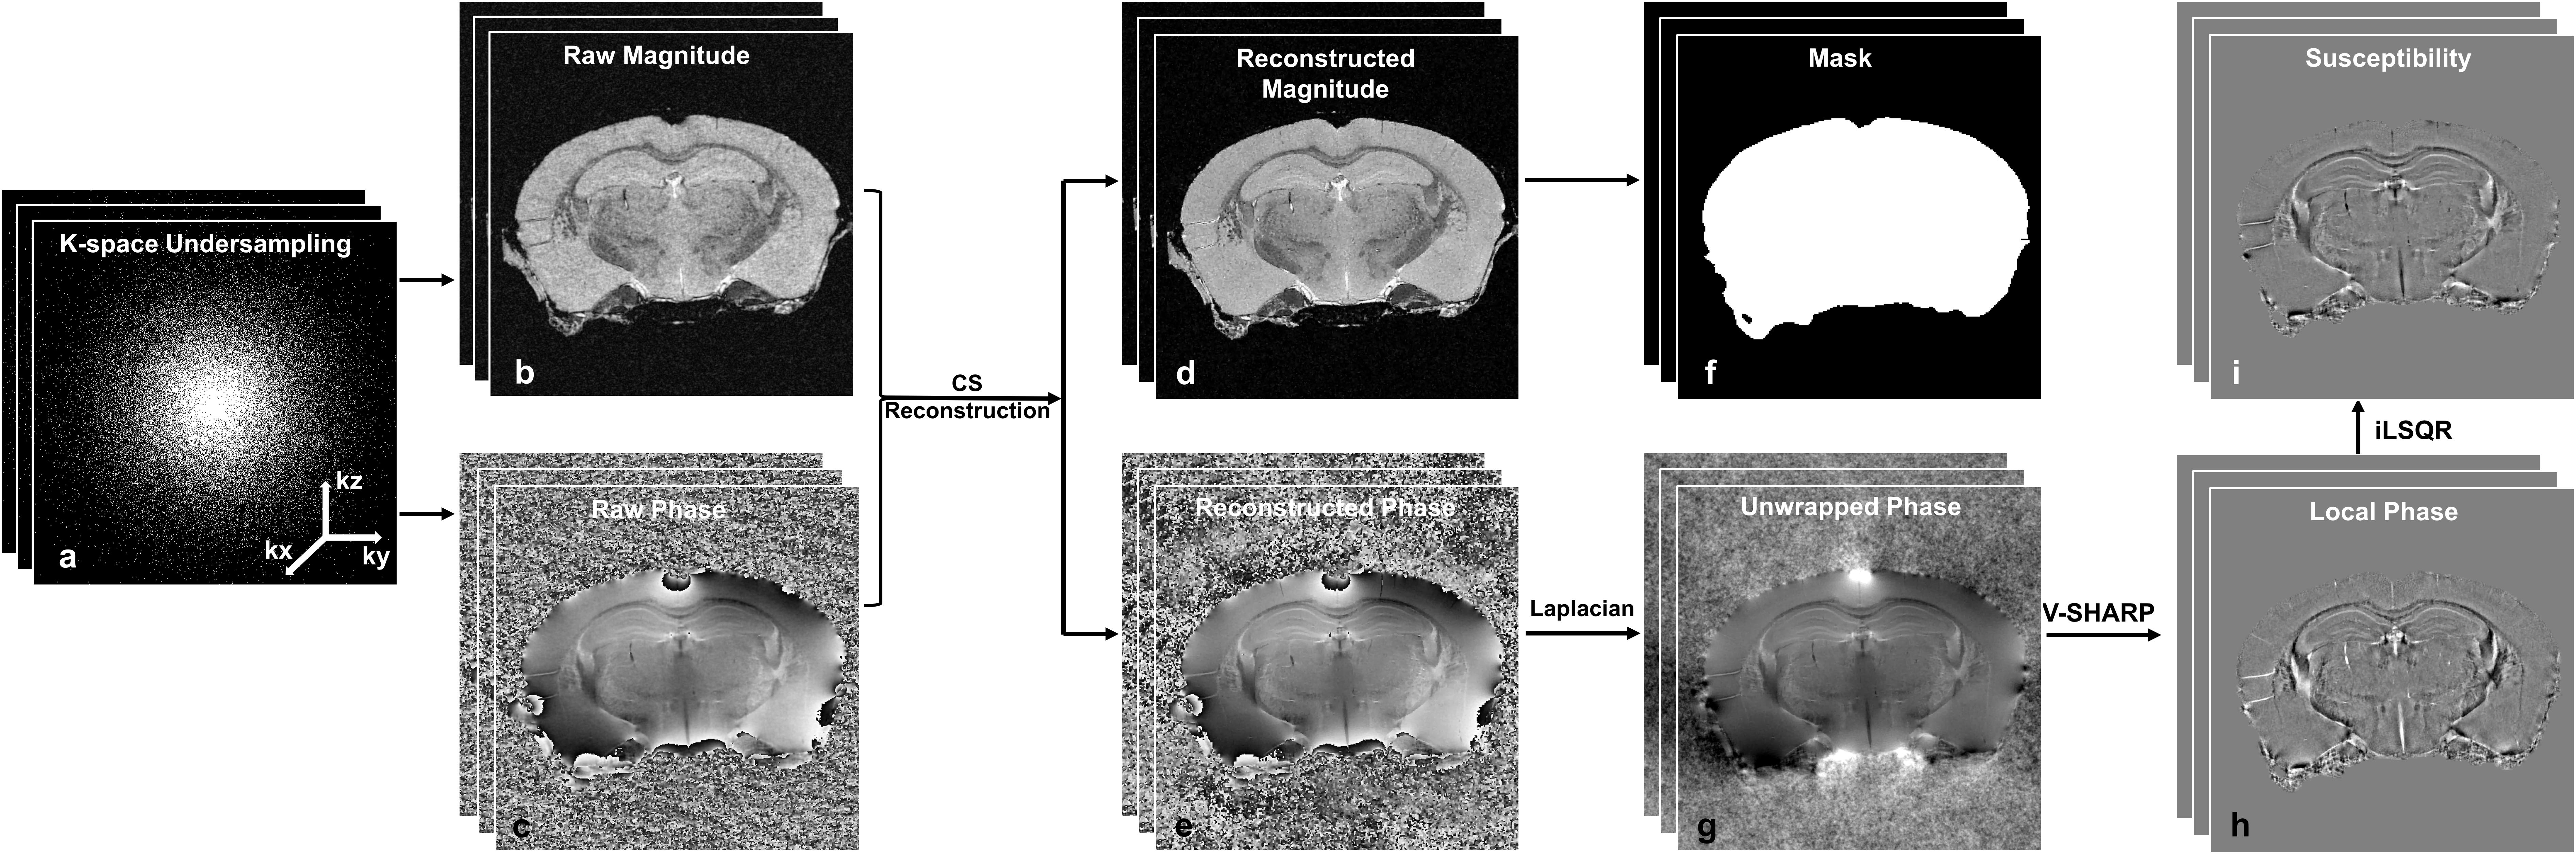
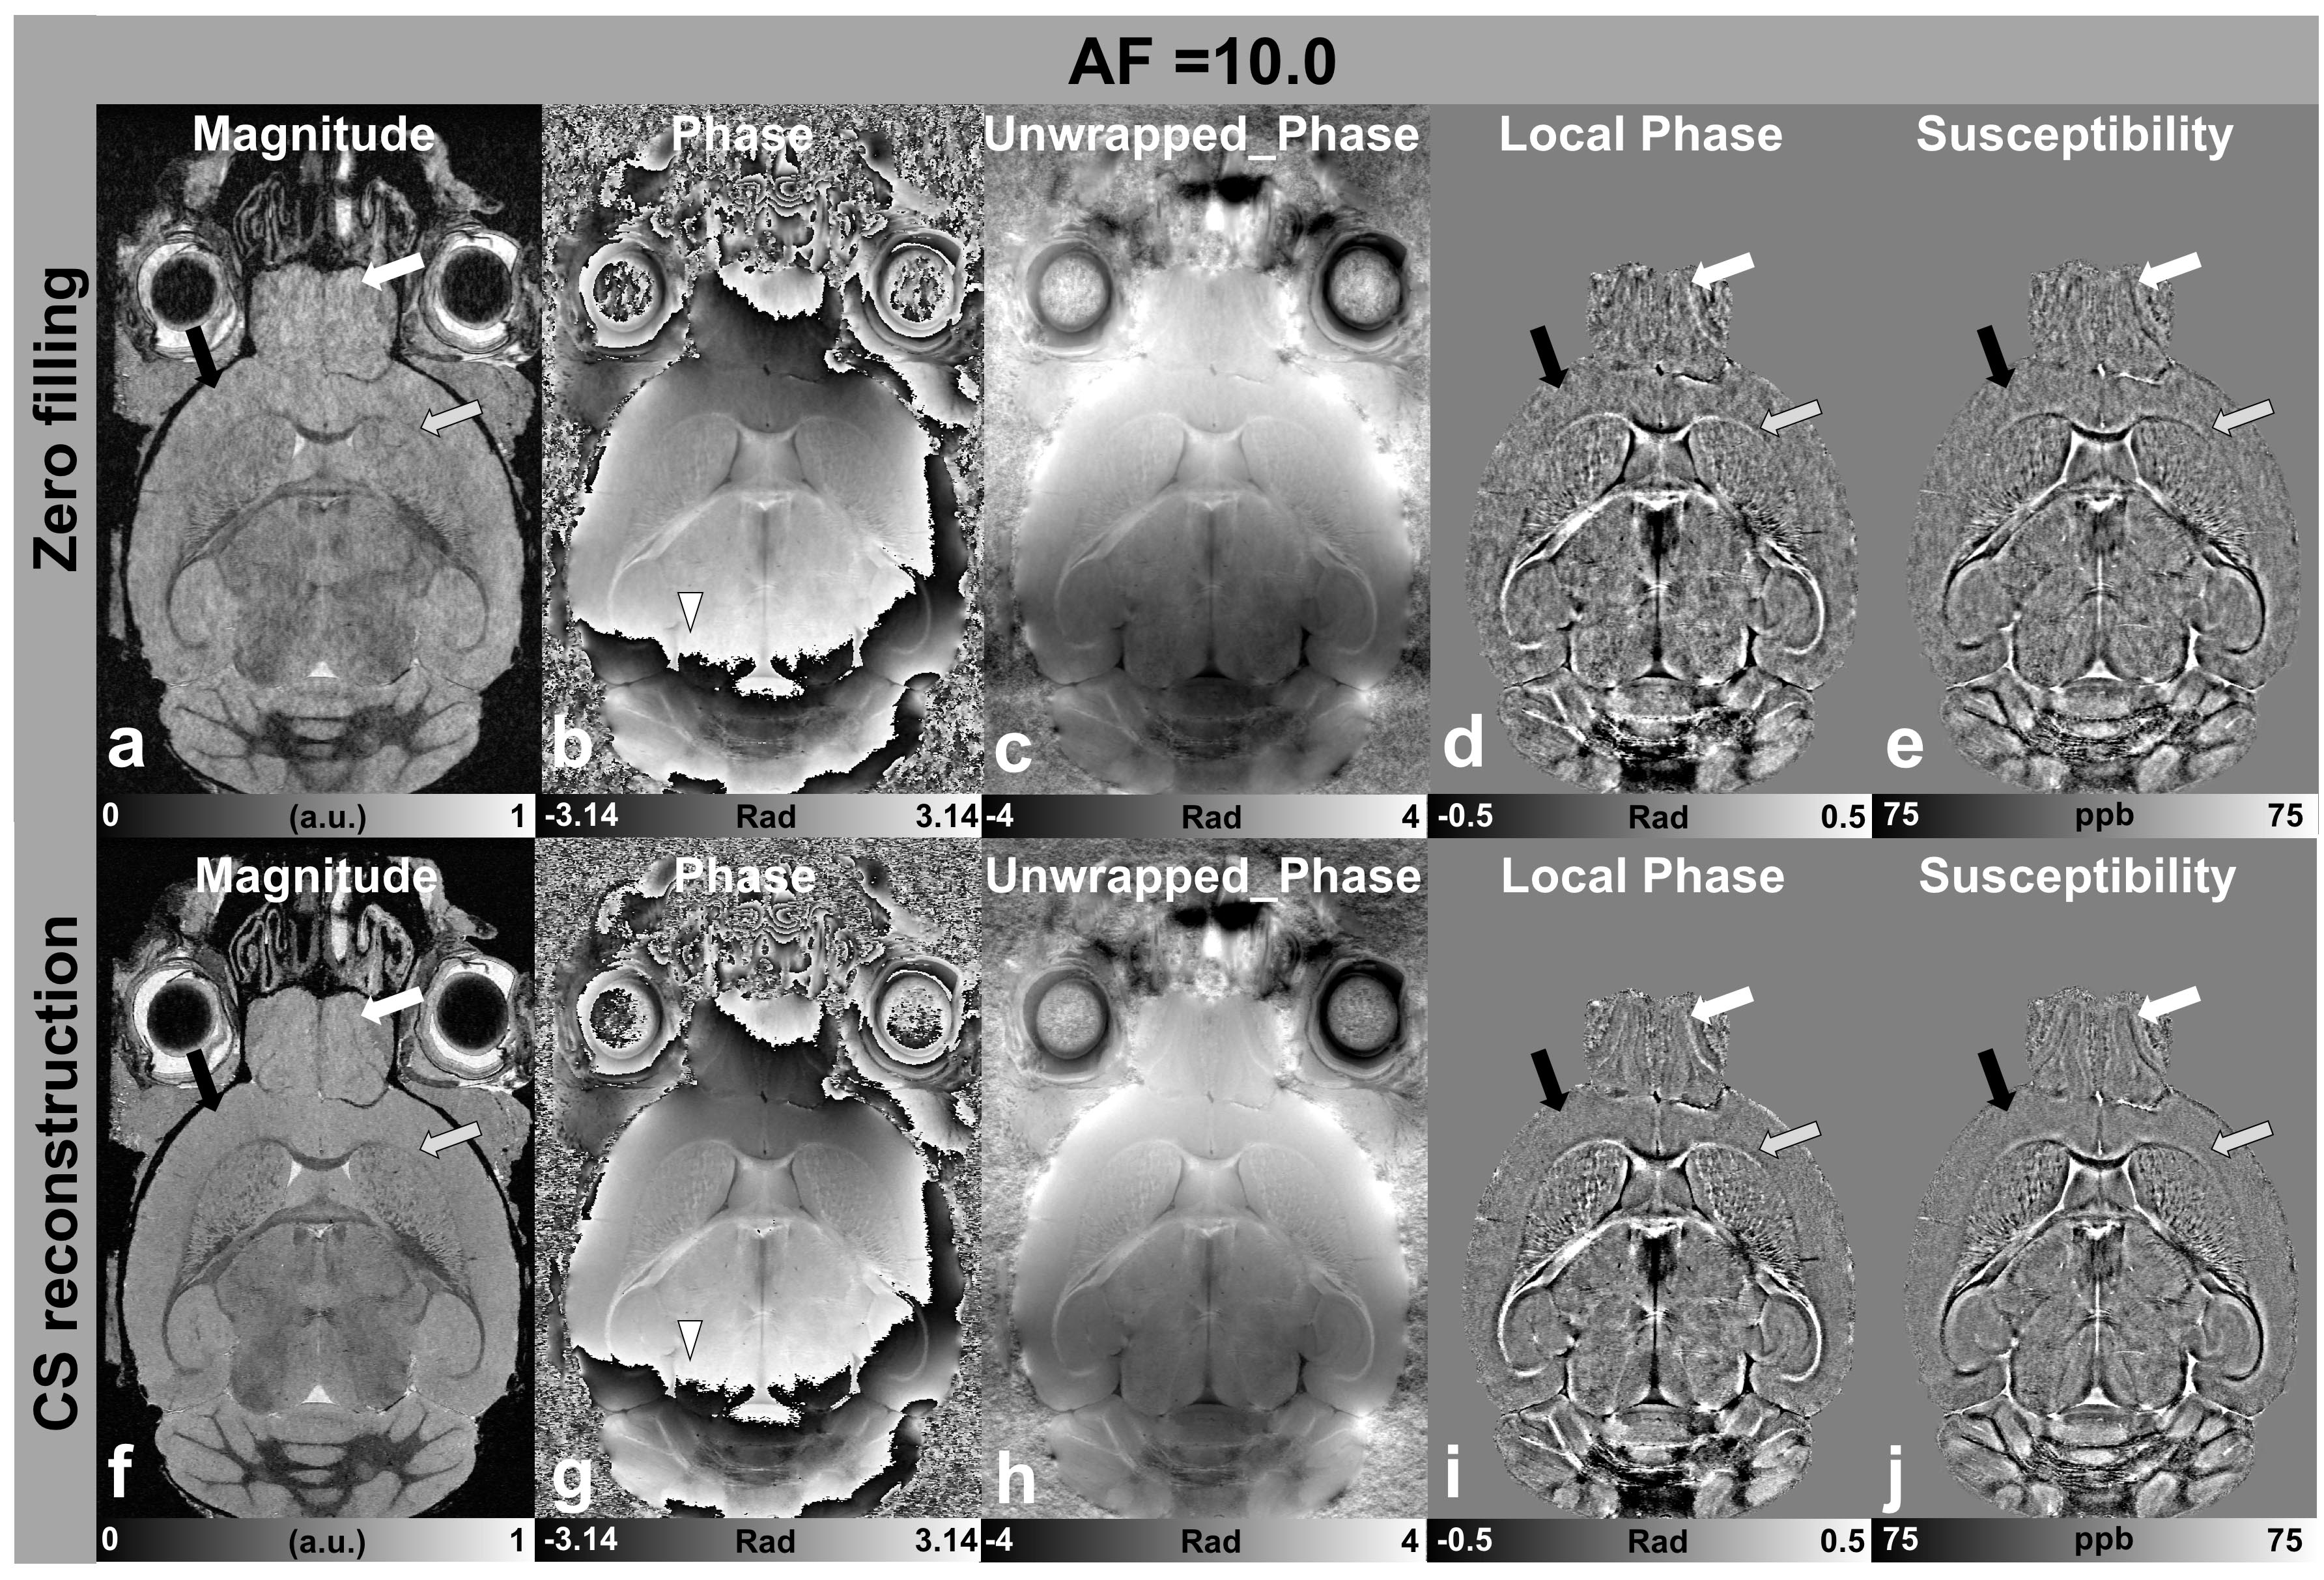
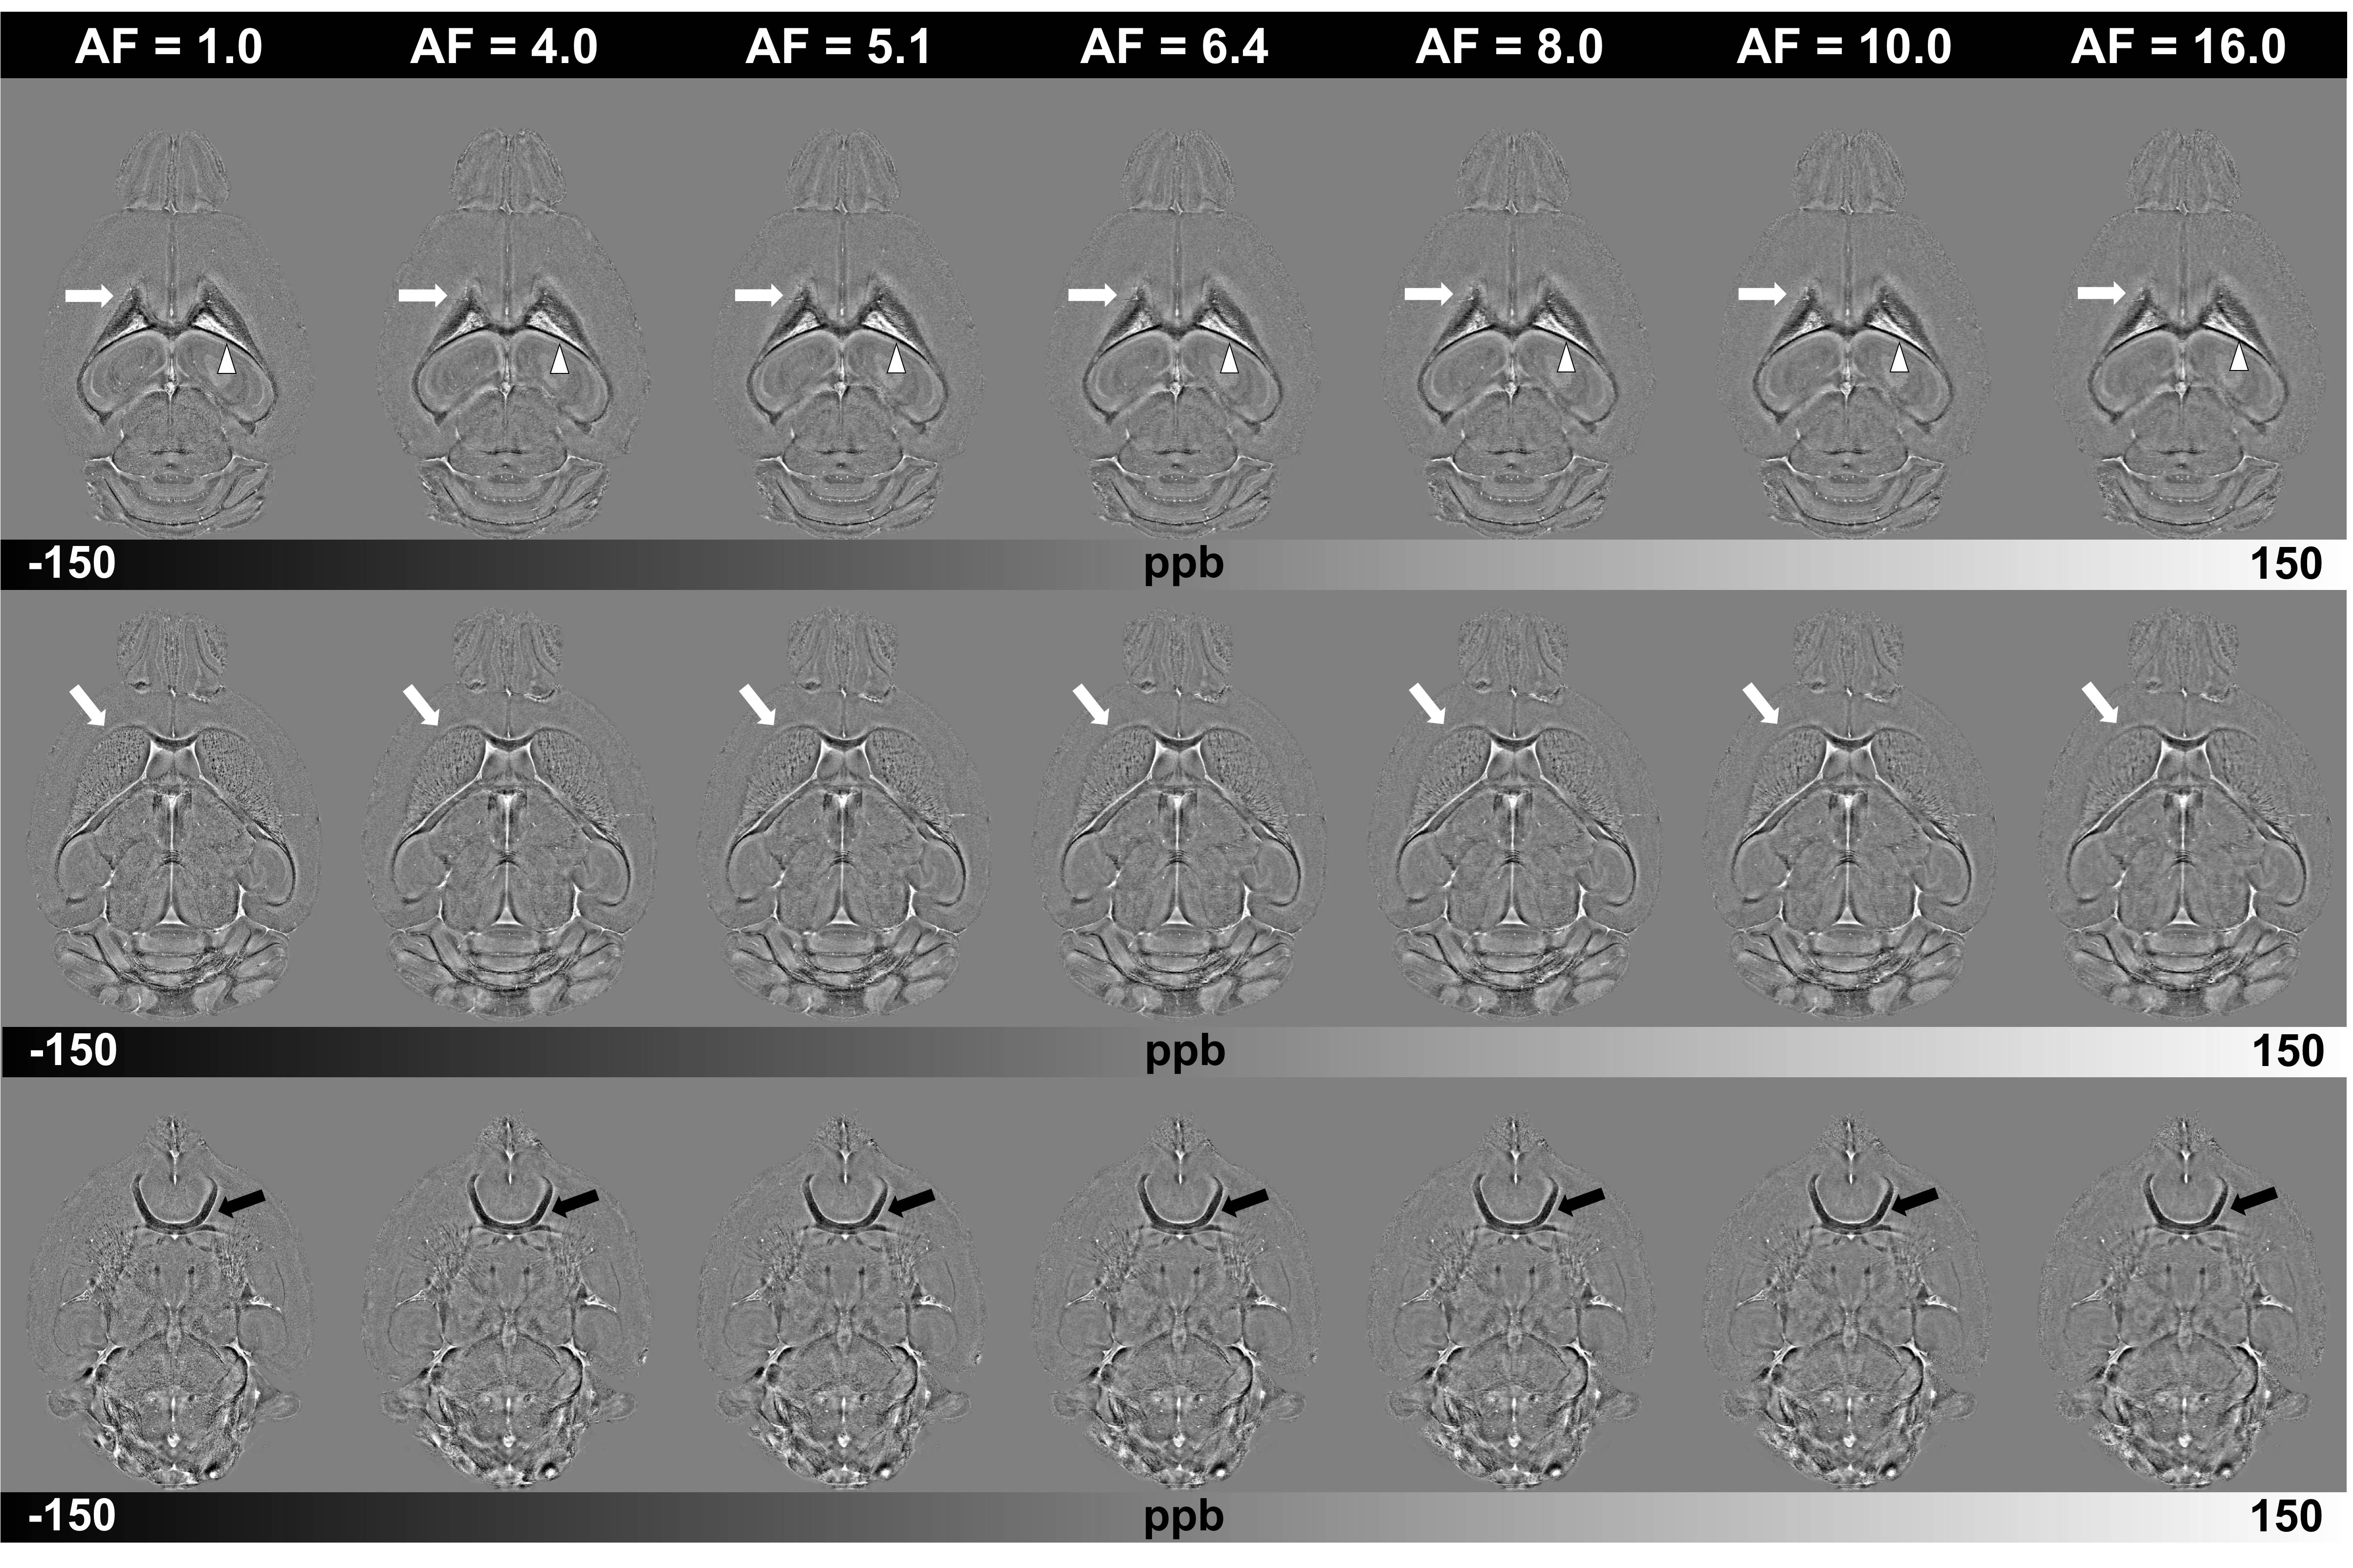
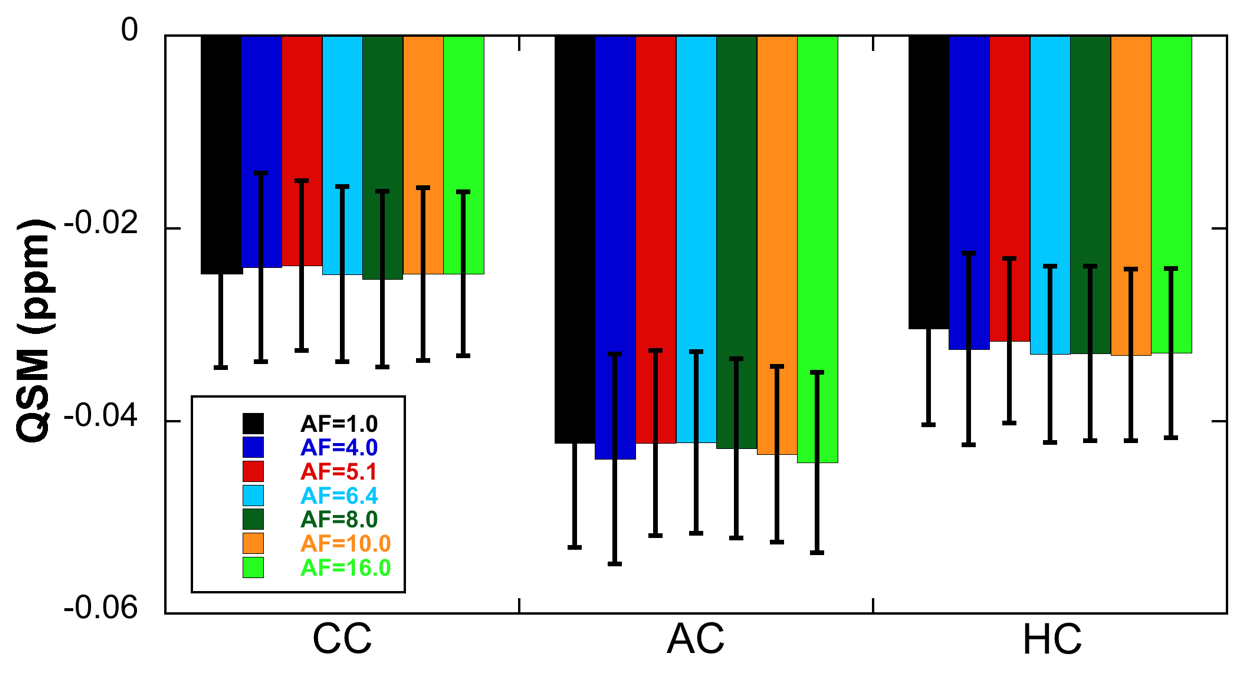
Figure 1 illustrated the methods used in this study, starting from data acquisition to final susceptibility mapping generation. Direct Fourier transformed of undersampled k-space data showed incoherent artifacts (b) in magnitude images, while the artifacts were reduced after CS reconstruction (d). The reconstructed phase (e) was unwrapped using Laplacian method (g) and removed background using V-SHARP method (h). The final susceptibility mapping (i) was obtained using iLSQR method. Figure 2 showed the simulated results of magnitude, raw phase, unwrapped phase, local phase, and susceptibility mapping of zero filling (upper) and CS reconstructed (lower) at an acceleration factor of 10.0. The raw magnitude image (a) showed apparent artifacts, while the CS reconstructed magnitude image (f) were visually much cleaner. The phase artifacts and the corresponding susceptibility mapping became severe (d, black and white arrows) with anatomic information largely degraded. The artifacts were largely reduced in the reconstructed image (i, j). Figure 3 showed the quantitative susceptibility mappings of mouse brain at various CS acceleration factors (1.0, 4.0, 5.1, 6.4, 8.0, 10.0, 16.0, where 1.0 stands for fully sampled results as ground truth), where AC (slice 1), CC (slice 2 and slice 3) and FI (slice 3) were pointed out by black and white arrows. All the susceptibility mappings showed no apparent artifacts with major information qualitatively preserved and negligible artifacts, even with the AF of 16.0 (6.25 % k-space data). The maximum variations were 2.4 % difference at the FI area with AF of 8.0; 2.2 % difference at the CC area with AF of 16.0; 5.6 % difference at the FI area with AF of 16.0 (Fig 4).DISCUSSION
Traditional CS methods often use phase estimation to make phase-corrected images so that the phase variations are reduced, making images sparser, and this process could be done using the fully sampled k-space center (2% ~ 5 %). The disadvantage of this phase estimation is that the process may remove some phase information of the true image before the CS reconstruction procedure. Therefore, in this study, no phase estimation was applied before CS reconstruction to avoid missing raw phase information. We evaluated that compressed sensing QSM can be applied to reduce the acquisition time of gradient echo scans of the whole mouse brain at 9.4 T without losing apparent accurate susceptibility values of the major white matter tracts (FI, CC, and AC) using ROI analysis.CONCLUSION
This preliminary study shows that CS can be applied to reduce the acquisition time of GRE MRI of mice brains at 9.4 T without losing significant accuracy in quantitative susceptibility values.Acknowledgements
This work was supported by NIH/NIBIB P41 EB015897, Office of the Director 1S10ODO10683-01, NIH/NINDS 1R01NS096720-01A1.References
(1) Liu C, Li W, Tong KA, Yeom KW, Kuzminski S. Susceptibility-weighted imaging and quantitative susceptibility mapping in the brain. J Magn Reson Imaging 2015;42(1):23-41.
(2) Liu C. Susceptibility tensor imaging. Magnetic resonance in medicine 2010;63(6):1471-1477.
(3) Lustig M, Donoho D, Pauly JM. Sparse MRI: The application of compressed sensing for rapid MR imaging. Magnetic resonance in medicine 2007;58(6):1182-1195.
(4) Li W,
Wang N, Yu F, Han H, Cao W, Romero R, Tantiwongkosi B, Duong TQ, Liu C. A
method for estimating and removing streaking artifacts in quantitative
susceptibility mapping. NeuroImage 2015;108:111-122.
Figures