4996
Considerations in Quantitative Susceptibility Mapping using Echo Planar Imaging1High Field MR Centre, Department of Biomedical Imaging and Image-Guided Therapy, Medical University of Vienna, Vienna, Austria, 2Christian Doppler Laboratory for Clinical Molecular MR Imaging, Vienna, Austria
Synopsis
Phase images from EPI and GE acquisitions differ due to the divergent acquisition schemes and reconstruction steps. The effect of these is investigated both in measured phase and estimated susceptibility values. We show that non-ΔB0-related phase is present in phased array data combined with the Virtual Receiver Coil and Roemer approaches and that this influences estimated susceptibilities. For EPI, data can be combined using a multi-echo “ASPIRE” GE prescan, leading to minimal non-ΔB0-related phase. There was large variability of in-vivo EPI fieldmaps due to physiological noise and non-linearities in phase evolution in both GE and EPI data.
Introduction
Recent years have seen the use of Echo-Planar Imaging (EPI) for Quantitative Susceptibility Mapping (QSM)1,2; either with dedicated, high resolution 3D3 or 2D4 acquisitions or from fMRI data5. EPI provides high SNR/t as well as the possibility of motion-correcting individual volumes. There are, however, many differences between the signal characteristics and reconstruction steps in EPI and, for QSM conventionally used, gradient echo (GE) acquisitions which may influence susceptibility estimates.
Here, we assess
- three candidate methods for combining the data from phased array coils; Virtual Reference Coil (VRC)6, Roemer7 and ASPIRE8 (modified for EPI by applying phase-offsets calculated from a dual-echo GE prescan),
- the effect of the phase of parallel imaging and multi-band acceleration, partial Fourier acquisition and EPI sequence (should these include phase filter or other processing steps); Siemens product EPI, Multi-Band EPI C2P9, WIP 770B10 and multi-echo EPI C2P11,
- Nyquist ghost correction (global12 and local13),
- phase stability over volumes and correspondence with the phase measured using GE,
- the possible influence of susceptibility gradients on TE and, consequently, fieldmaps14.
Methods
A homogeneous oil phantom and two healthy volunteers were measured using a 7T Siemens MAGNETOM scanner and a 32-channel Nova Medical head coil. For the phantom, 12 EPI runs with TEs between 28 and 46 ms were acquired, and for a volunteer 8 EPI runs with TEs between 28 and 43 ms, all with 10 repetitions. Further, a 3D GE scan (TE = {7,14,21,28,35,42} ms) with identical resolution to the EPIs (voxel size = 1.46x1.46x3 mm), and a second, high-resolution (voxel size = 0.45x0.45x1 mm) 3D GE scan (TE = {7,14,21,28} ms) were acquired. Phase combination methods were assessed via the quality metric Q15 and the presence of non-ΔB0-related phase by reference to the Hermitian inner product (HiP) calculated from a pair of GE echoes. Susceptibility maps were generated using the TGV3 and the correction for the local echo-times according to Deichmann et al.14.Results
- VRC, Roemer and ASPIRE phase combination methods all yielded excellent phase-matching quality throughout the brain. In the case of ASPIRE, this was despite distortion mismatch between EPI and (GE-based) phase-offsets. Roemer and VRC reconstructions contained circa π non-ΔB0-related phase variation, not present in ASPIRE, which led to up to 0.02 ppm error in susceptibility estimates (Figure 2).
- EPI phase values were consistent between EPI sequences, and broadly unaffected by the use of parallel imaging, multiband and partial Fourier acquisition.
- Using global12 Nyquist ghost correction instead of local approach13 decreased combination quality and led to phase singularities (Figure 3a).
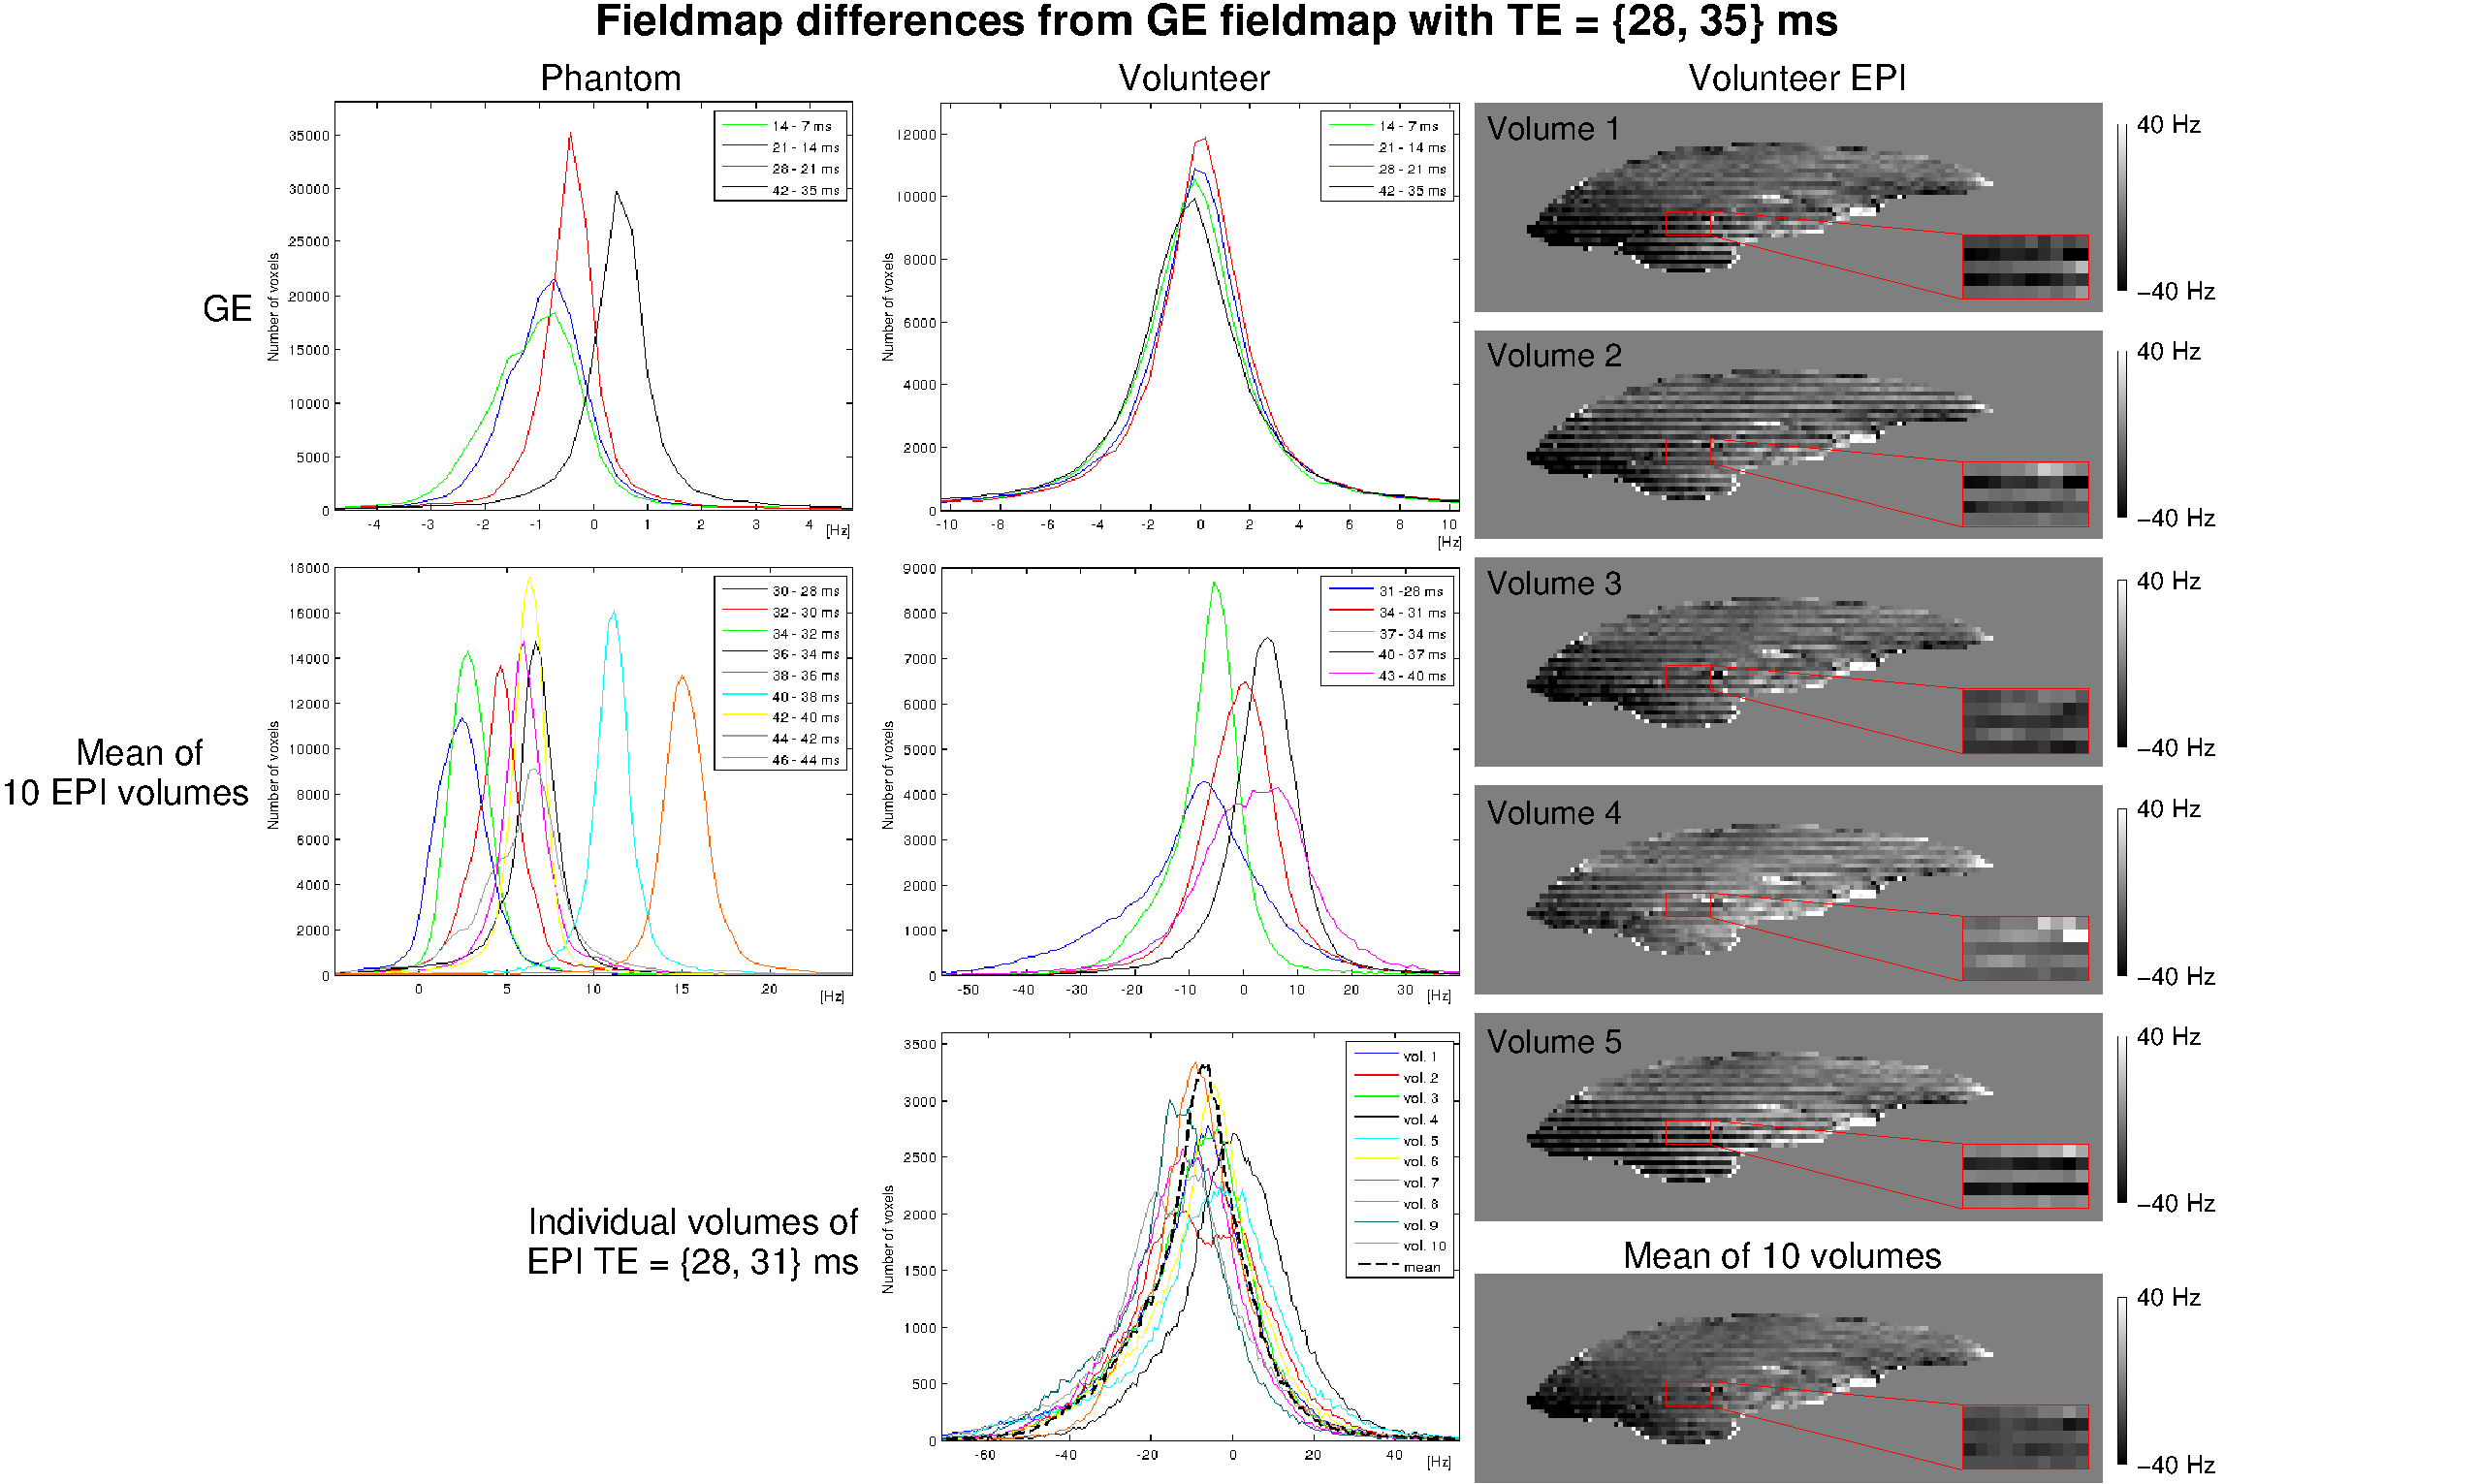
- In the phantom, mean EPI fieldmap values differed by up to 15 Hz from GE-based values (Figure 4). In contrast, fieldmaps from other pairs of GE echoes agreed to within about 1 Hz. In vivo, EPI fieldmaps showed a variation of up to 30 Hz over volumes, due to strong physiological fluctuations (bottom histogram). In EPI, fieldmaps calculated between later pairs of echoes tended to be larger. Surprisingly, this was systematically the case for GE in the phantom: field values from later echoes were higher.
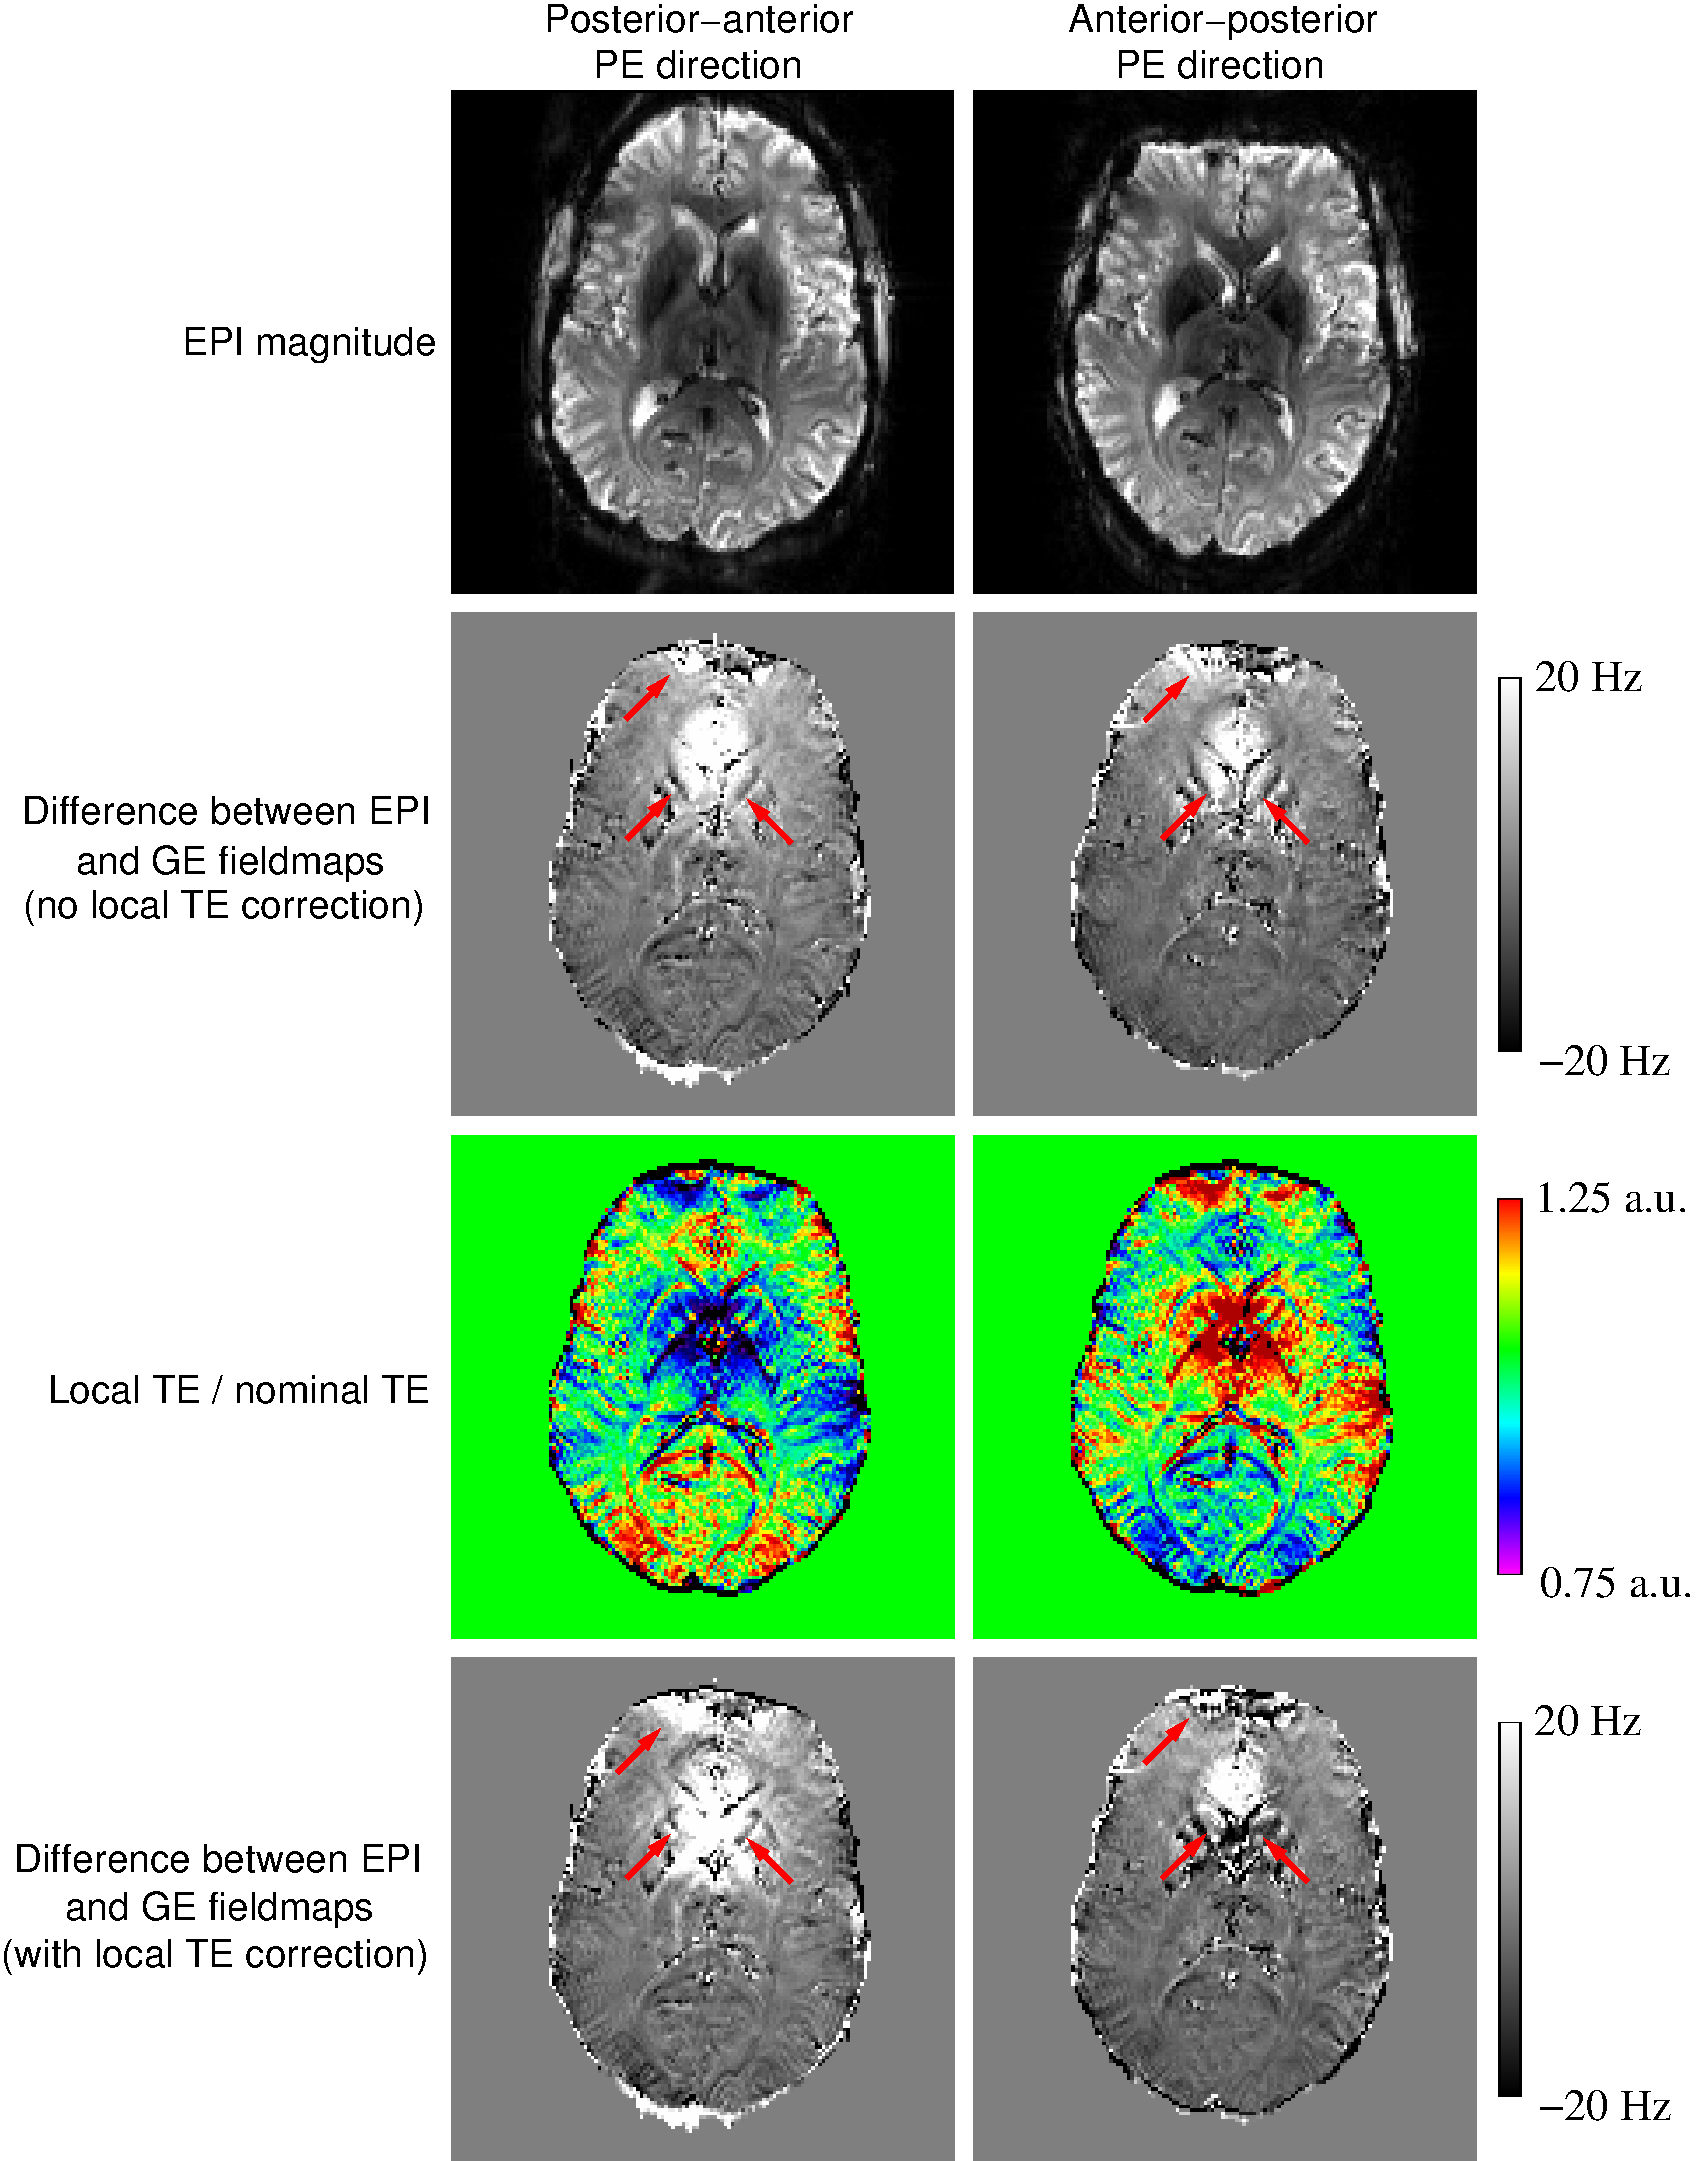
- Local TE variation did not account for the differences between EPI and GE fieldmaps (Figure 5).
Discussion
The aim of this study was to examine potential sources of discrepancies between EPI-based and GE-based measurements of phase, with a view to improving the reliability of EPI-based QSM. EPI phase generated with the VRC and Roemer methods contained non-ΔB0-related phase which was shown (consistent with 16), to bias QSM values. EPI phase values were noisier and subject to physiological noise between volumes, requiring averaging over the time series. Ascending/descending slice order would be therefore beneficial over interleaved such that neighbouring slices are acquired similar phase of the breathing cycle, facilitating motion correction. The non-linear phase-evolution in both EPI and GE data, present even in a homogeneous phantom, points to a systematic non-linear behaviour of the acquired MRI signal (e.g. due to cumulative delays). This could be a contributing factor (in addition to unwrapping errors recently identified by Cronin et al.17) to the behaviour observed in studies of tissue microstructure18,19. Discrepancies between EPI and GE fieldmaps were not explained by local variation in EPI, probably because of the residual presence of larger sources of differences between the two modalities.
Conclusion
We have established an effective phase combination approach for EPI-based phase data and identified several differences between EPI and GE signal and processing steps that influence estimated susceptibilities. Non-linearity of phase evolution and physiological noise have been shown to significantly influence measured phase and QSMs if effective strategies are not adopted.Acknowledgements
This study was supported by funds of the Oesterreichische Nationalbank Anniversary Fund, Project Number 16213 and the Christian Doppler Laboratory for Clinical Molecular MR Imaging.References
- Shmueli K, de Zwart JA, van Gelderen P, Li TQ, Dodd SJ, Duyn JH. Magnetic susceptibility mapping of brain tissue in vivo using MRI phase data. Magn Reson Med 2009;62(6):1510–1522.
- Schweser F, Deistung A, Reichenbach JR. Foundations of MRI phase imaging and processing for Quantitative Susceptibility Mapping (QSM). Z Med Phys 2016;26:6–34.
- Langkammer C, Bredies K, Poser BA, Barth M, Reishofer G, Fan AP, Bilgic B, Fazekas F, Mainero C, Ropele S. Fast quantitative susceptibility mapping using 3D EPI and total generalized variation. Neuroimage 2015;111:622–630.
- Sun H, Wilman AH. Quantitative susceptibility mapping using single-shot echo-planar imaging. Magn Reson Med 2015;73(5):1932–1938.
- Sun H, Seres P, Wilman AH. Structural and functional quantitative susceptibility mapping from standard fMRI studies. NMR Biomed 2017. doi: 10.1002/nbm.3619.
- Parker DL, Payne A, Todd N, Hadley JR. Phase reconstruction from multiple coil data using a virtual reference coil. Magn Reson Med 2014;72(2):563–569.
- Roemer PB, Edelstein WA, Hayes CE, Souza SP, Mueller OM. The NMR phased array. Magn Reson Med 1990;16(2):192–225.
- Eckstein K, Dymerska B, Bachrata B, Bogner W, Poljanc K, Trattnig S, Robinson SD. Computationally efficient combination of multi-channel phase data from multi-echo acquisitions (ASPIRE). Magn Reson Med 2017; doi: 10.1002/mrm.26963.
- Moeller S, Yacoub E, Olman CA, Auerbach EJ, Strupp J, Harel N, Ugurbil K. Multiband multislice GE-EPI at 7 tesla, with 16-fold acceleration using partial parallel imaging with application to high spatial and temporal whole-brain fMRI. Magn Reson Med 2010;63(5):1144–1153.
- Setsompop K, Gagoski BA, Polimeni JR, Witzel T, Wedeen VJ, Wald LL. Blipped-Controlled Aliasing in Parallel Imaging (blipped-CAIPI) for simultaneous multi-slice EPI with reduced g-factor penalty. Magn Reson Med 2012;67(5):1210–1224.
- Poser BA, Norris DG. Investigating the benefits of multi-echo EPI for fMRI at 7 T. NeuroImage 2009;45:1162–1172.
- Heid O. US6043652 A. 2000.
- Feiweier T. US0234221 A1. 2011.
- Deichmann R, Josephs O, Hutton C, Corfield DR, Turner R. Compensation of susceptibility-induced BOLD sensitivity losses an Echo-Planar fMRI Imaging. Neuroimage 2002;15:120–135.
- Robinson S, Grabner G, Witoszynskyj S, Trattnig S. Combining phase images from multi-channel RF coils using 3D phase offset maps derived from a dual-echo scan. Magn Reson Med 2011;65(6):1638–1648.
- Schweser F, Atterbury M, Deistung A, Lehr BW, Sommer K, Reichenbach JR. Harmonic phase subtraction methods are prone to B1 background components. Proceedings of the 19th Annual Meeting of the ISMRM, Montreal, 2011a; no 188.
- Cronin MJ, Wang N, Decker KS, Wei H, Zhu WZ, Liu CH. Exploring the origins of echo-time-dependent quantitative susceptibility mapping (QSM) measurements in healthy tissue and cerebral microbleeds. Neuroimage 2017;149:98–113.
- Sood S, Urriola J, Reutens D, O’Brien K, Bollmann S, Barth M, Vegh V. Echo time-dependent quantitative susceptibility mapping contains information on tissue properties. Magn Reson Med 2017;77:1946–1958.
- Li
W, Wu B, Liu
C. Quantitative susceptibility mapping of human brain reflects
spatial variation in tissue
composition. Neuroimage 2011;55:1645–1656.
Figures
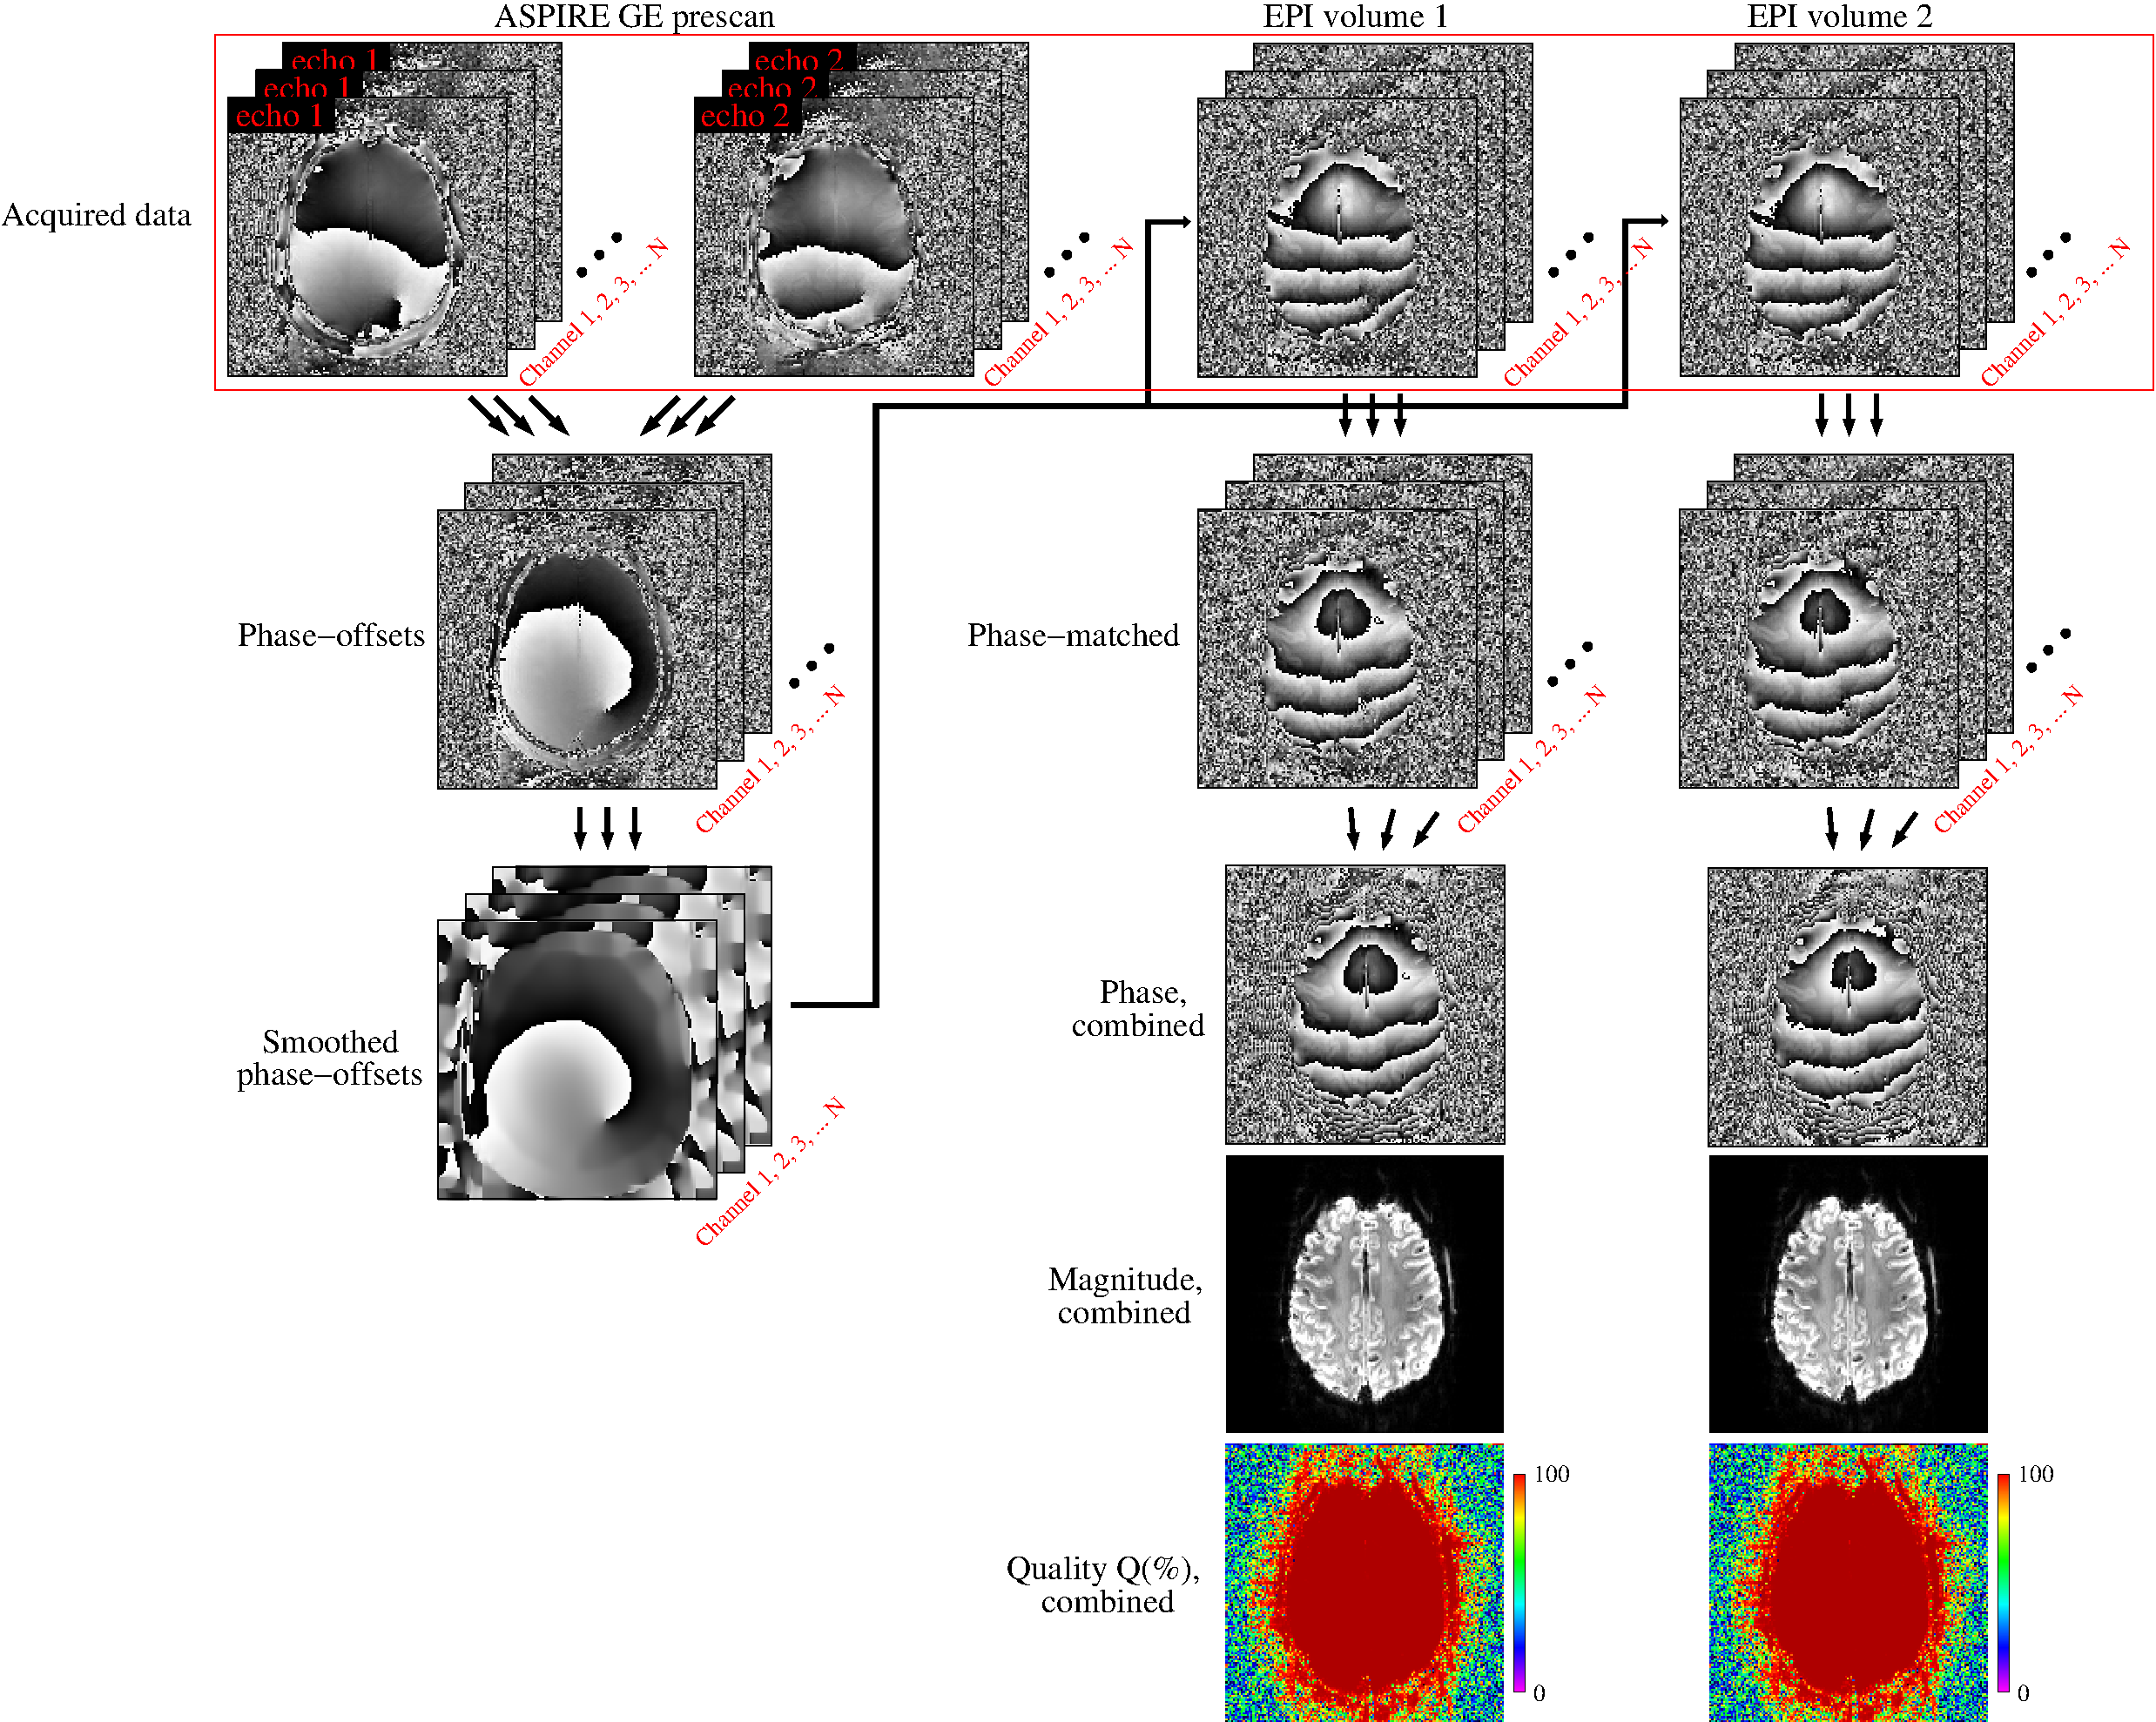
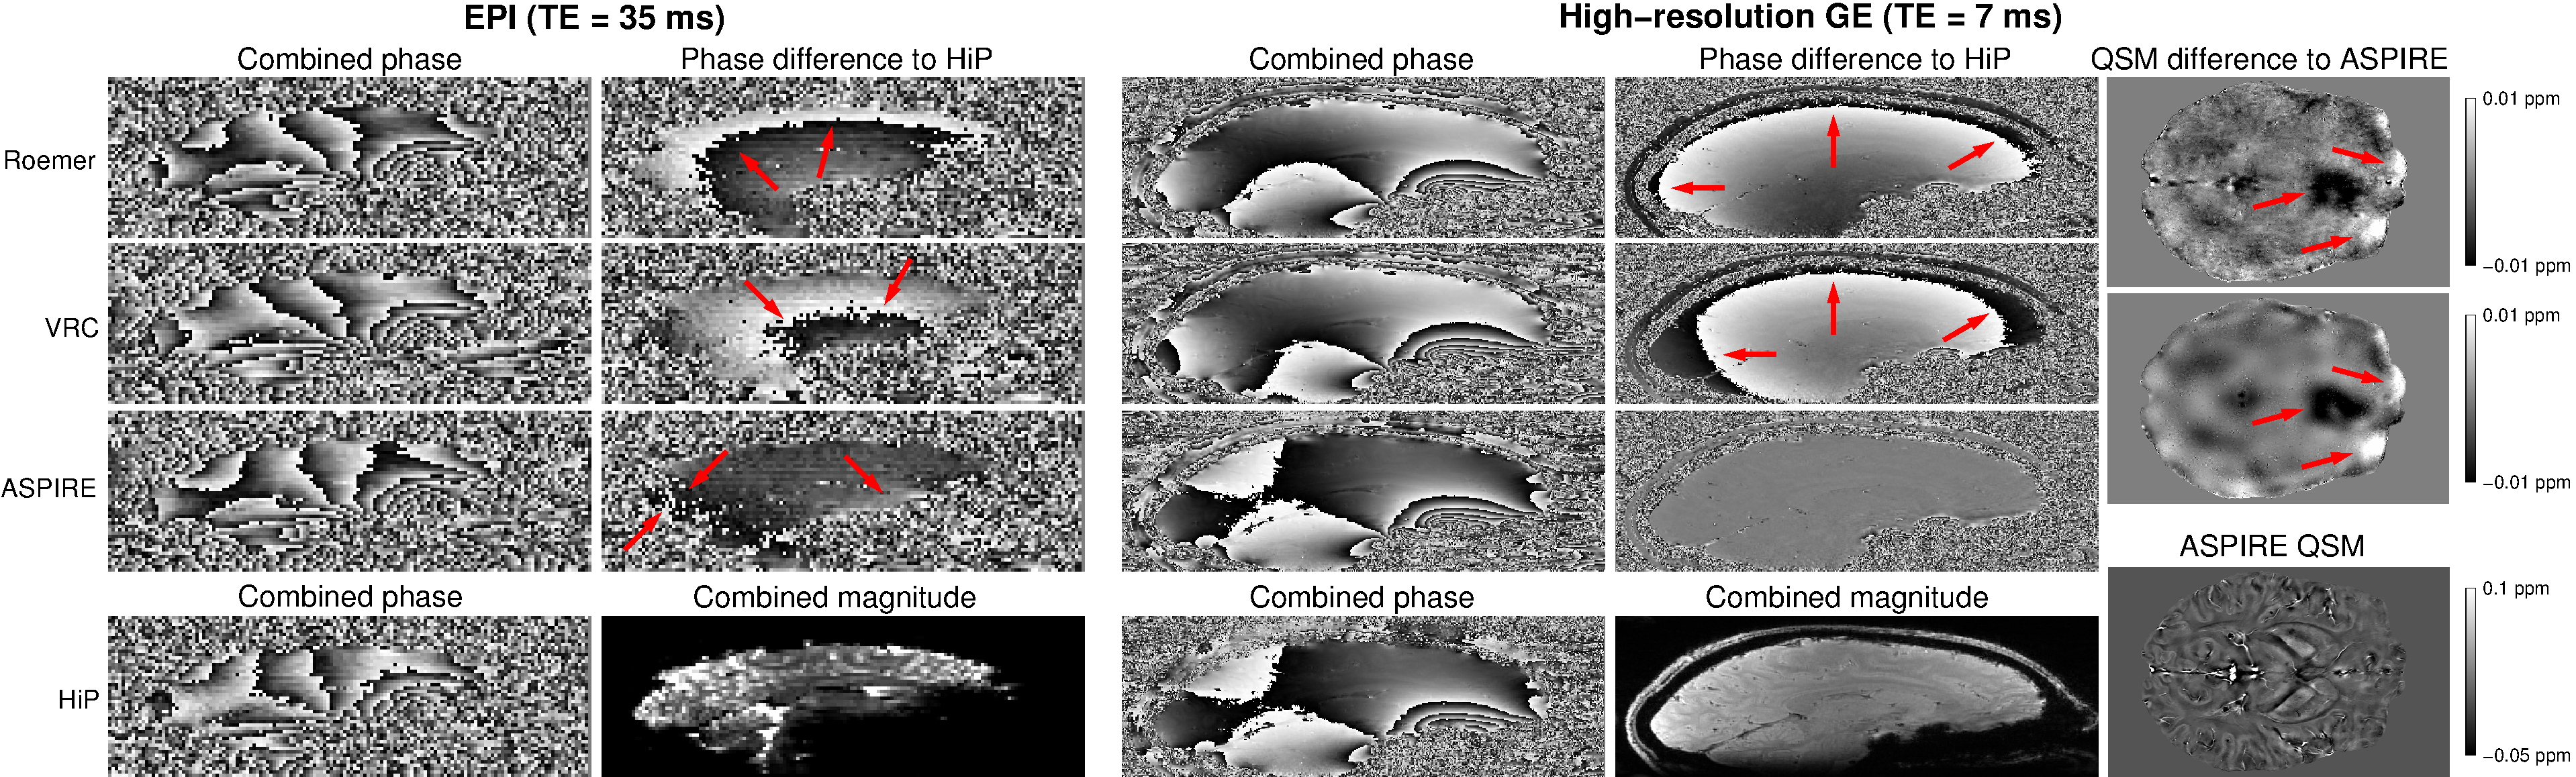
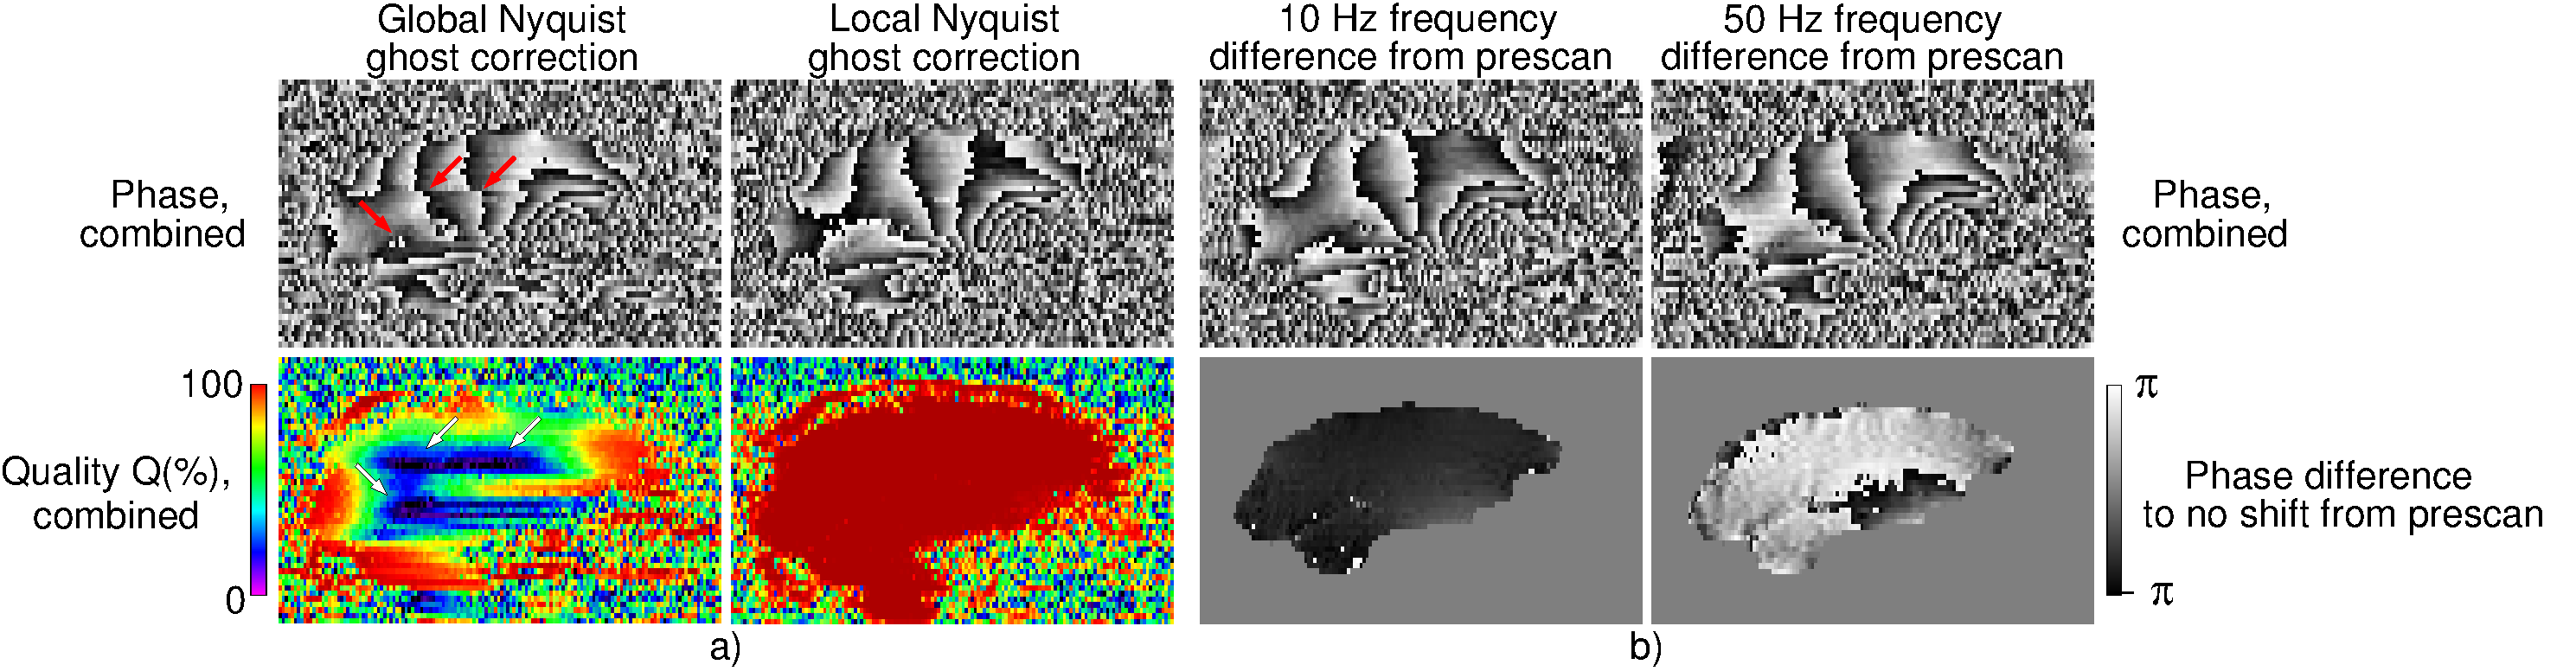
Figure 3: a) A comparison of the performance of Nyquist ghost correction approaches. The global approach led to very low phase-matching quality and the presence of open-ended fringe lines (see arrows). A high combination quality over the entire brain was reached with the local approach. b) An illustration of the effect of using different frequencies for ASPIRE prescan and EPI measurements. Even a small frequency difference, which arose due to an automatic frequency adjustment, causes additional phase evolution and overestimation of susceptibility values.