4994
Extracting more: Multi-echo MP2RAGE at 7T enables simultaneous T1w, quantitative T1, T2* and susceptibility mapping from a single acquisition1University of Calgary, Calgary, AB, Canada, 2University of Melbourne, Melbourne, Australia, 3McGill University, Montreal, QC, Canada, 4Siemens Healthcare Pty Ltd, Brisbane, Australia
Synopsis
We demonstrate the feasibility of extracting simultaneous T1w, quantitative T1, T2* and susceptibility mapping from a single Multi-echo MP2RAGE scan of 10min at 7T. After optimizing the multi-channel phase combination, QSM from the Multi-echo MP2RAGE is comparable to that from a standard GRE sequence, with the benefits of additional parametric maps.
Introduction
MP2RAGE with two inversion times is commonly performed at ultra-high field to increase image contrast. While the original single-echo MP2RAGE sequence produces T1-weighted (T1w) anatomical contrast and quantitative T1 mapping [1], a recent multi-echo extension of the sequence (ME-MP2RAGE) [2] also enables T2* and quantitative susceptibility mapping (QSM). However, the scan time of the ME-MP2RAGE is extremely long (~20min), and QSM suffers significant artifacts due to phase singularities in the default adaptive-combined images. Here we optimize the ME-MP2RAGE sequence to achieve a clinical acceptable scan time (~10min) and propose an optimized reconstruction pipeline for ME-MP2RAGE QSM without artifacts.Methods
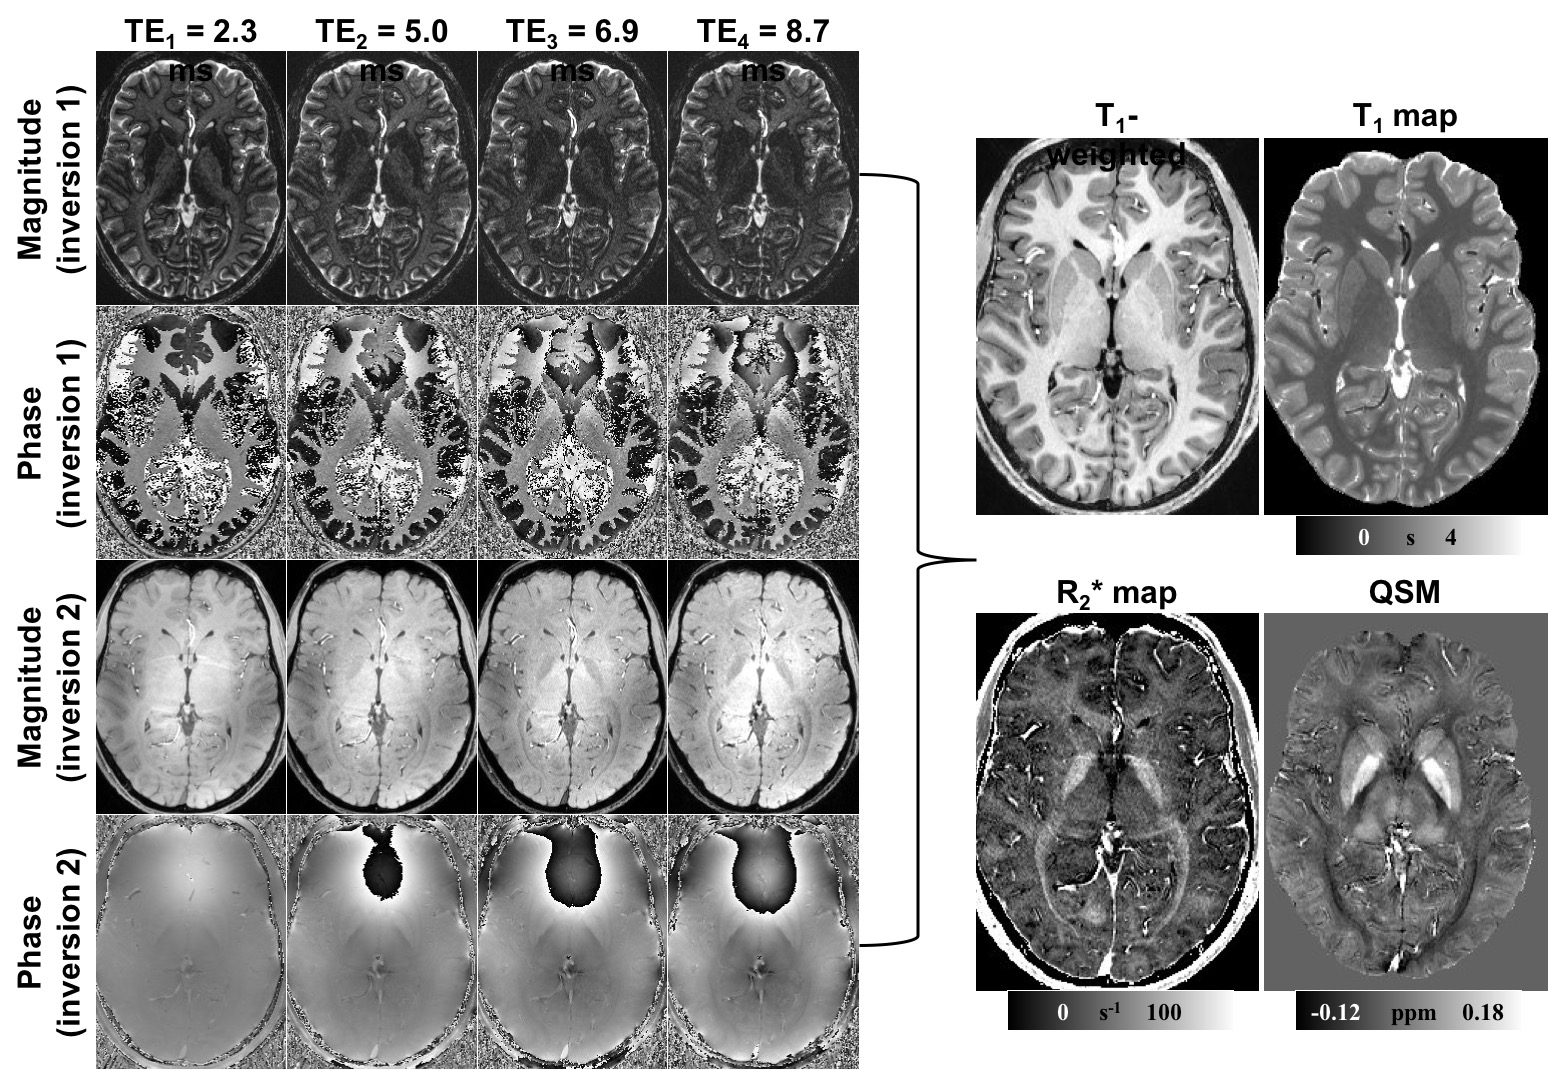
Data acquisition: Five healthy subjects (age: 36 ± 12.5) were scanned on a 7T whole-body research scanner (Siemens Healthcare, Erlangen, Germany) using a bipolar ME-MP2RAGE prototype sequence: TEs = 2.3/5.0/6.9/8.7 ms, TIs = 950/2900 ms, TR = 6000 ms, BWs = 340/660/750/750 Hz/px, FAs = 4/6 degree, voxel size = 0.75 mm isotropic, scan time = 10:08 min. One subject was also scanned using a unipolar 4-echo GRE sequence: TE1 = 4.8 ms, ∆TE = 3.6 ms, TR = 18 ms, voxel size = 0.6 mm isotropic, scan time = 8:52 min. For all the acquisitions, a 32-channel head coil was used for signal reception (Nova Medical, Wilmington MA, USA).
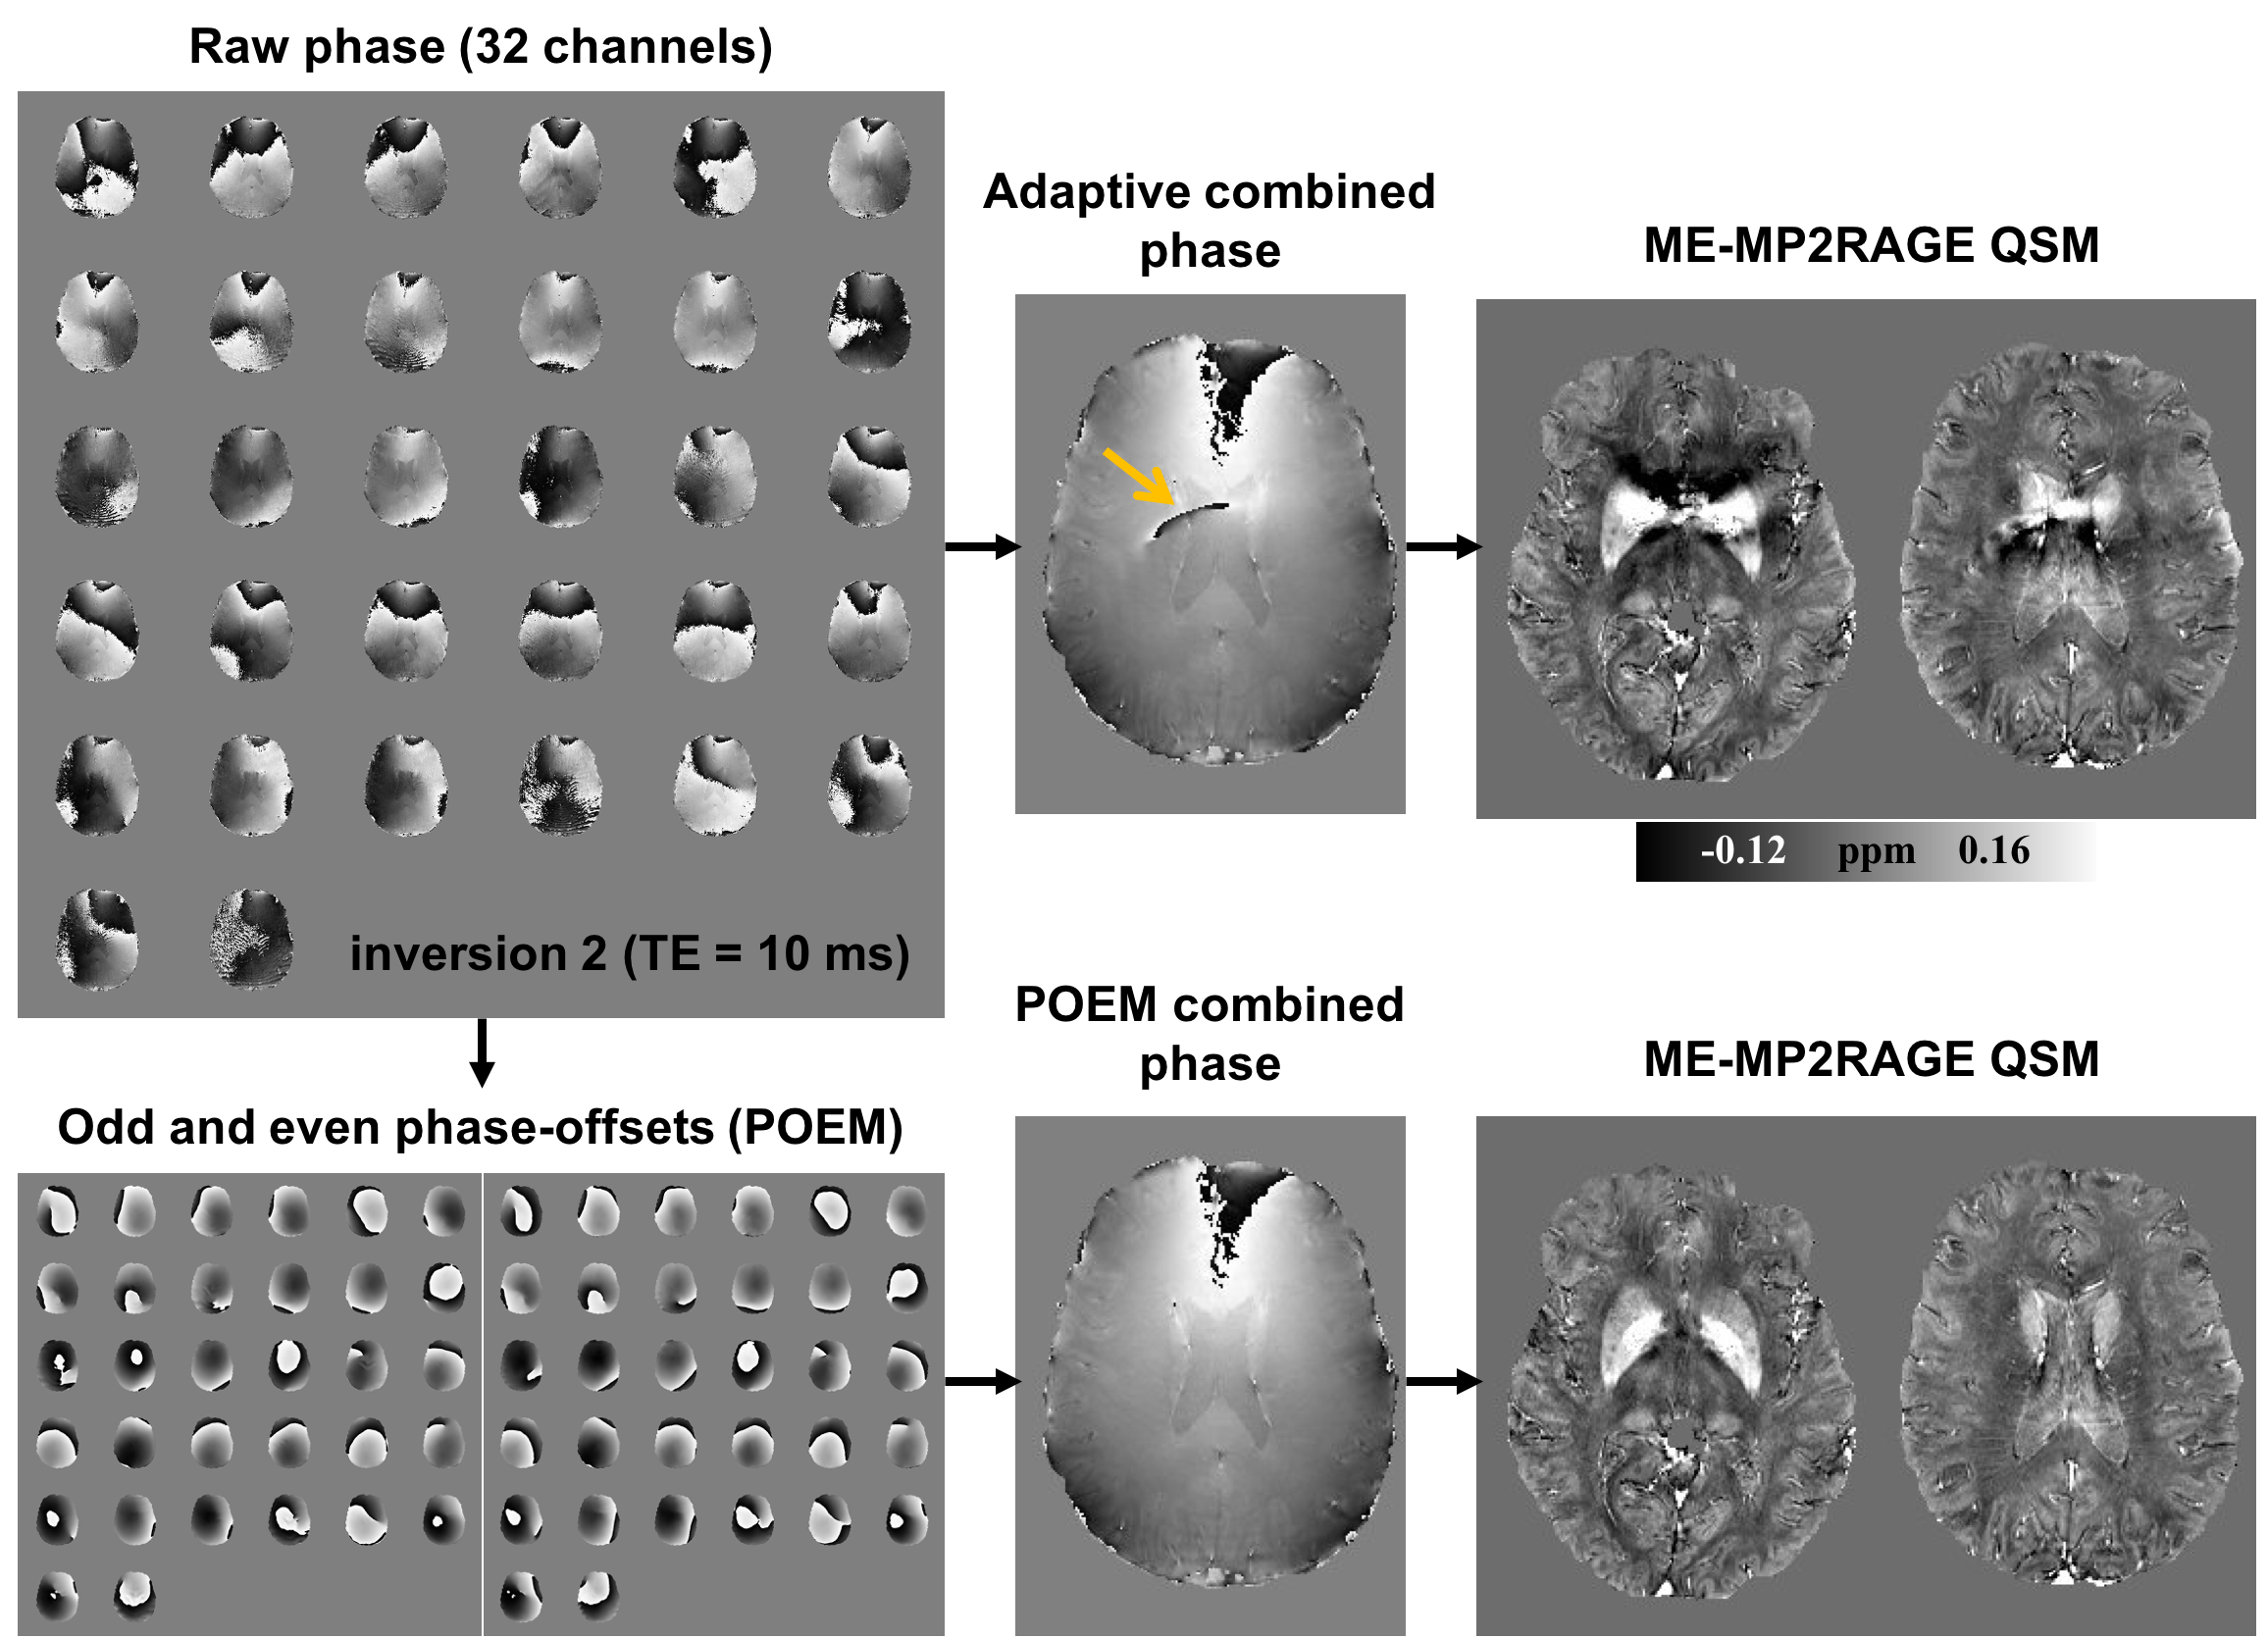
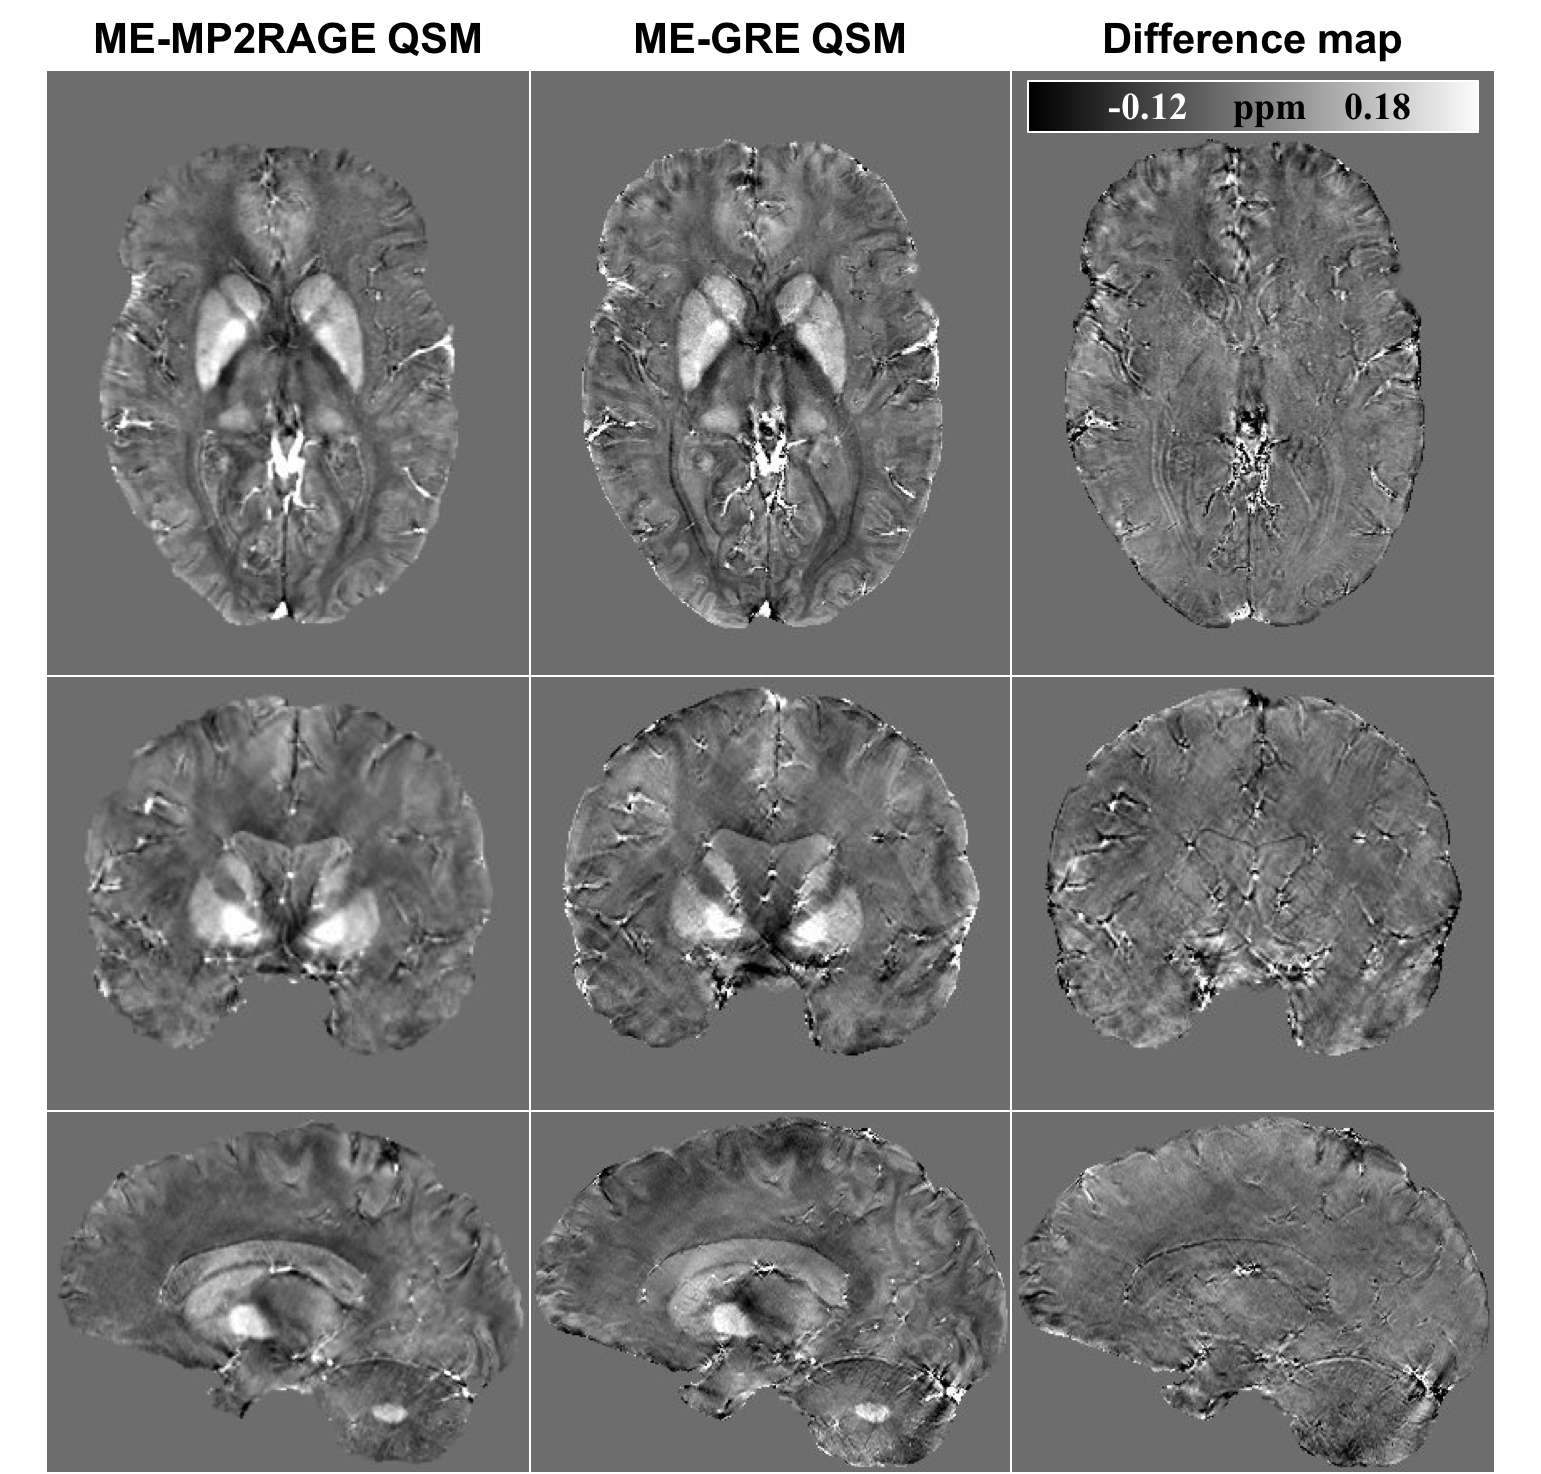
Image processing: T1w images and T1 maps were obtained from the scanner outputs. T2* maps were calculated using a mono-exponential fit from the magnitude images of the 4 echoes from the second inversion. The individual-channel uncombined images were exported to reconstruct QSM from the uncombined complex images of the ME-MP2RAGE second inversion and ME-GRE acquisitions. Raw phase images from the 32 channels were first combined using the Phase-Offsets Estimation from Multi-echoes (POEM) method [3]. Odd (positive) and even (negative)-echo phase-offsets were estimated respectively from the echoes of the same polarities and removed before complex summation and unwrapped using the best-path method [4] and then fitted across echo times to generate a total field map. Background field was removed using the RESHARP method [5] (kernel radius = 2 mm and Tikhonov regularization = 10-4). Susceptibility inversion on the local field map was performed using iLSQR method [6]. For comparison, ME-MP2RAGE QSM was registered to the ME-GRE QSM of the same subject using FLIRT.
Results
Images of different contrasts generated from the ME-MP2RAGE sequence are demonstrated in Figure 1. All images are multi-channel, combined using the POEM method. The T1w and quantitative T1 map both show excellent contrast between cortical grey matter, white matter, and some deep grey matter regions, such as caudate and putamen. R2* (1/T2*) and especially susceptibility maps show clear boundaries of globus pallidus and thalamus, which are difficult to delineate in T1 images.
The importance of proper phase combination from multi-channel receiver coils for QSM from ME-M2RAGE is illustrated in Figure 2. The default adaptive-combined phase image obtained from the scanner output shows open-ended fringe line (orange arrow), which was also observed in the original MRP2RAGE and ME-MP2RAGE papers [1, 2]. This leads to significant artifact in the final QSM images. Using the POEM combination method, phase images are properly combined to produce QSM without artifact.
Susceptibility maps from ME-MP2RAGE and ME-GRE of the same subject are compared in Figure 3. Susceptibility contrasts between the two methods look very similar in orthogonal views. Most of the differences occur near vessels, but deep grey matter structures do not show obvious contrast in the difference maps.
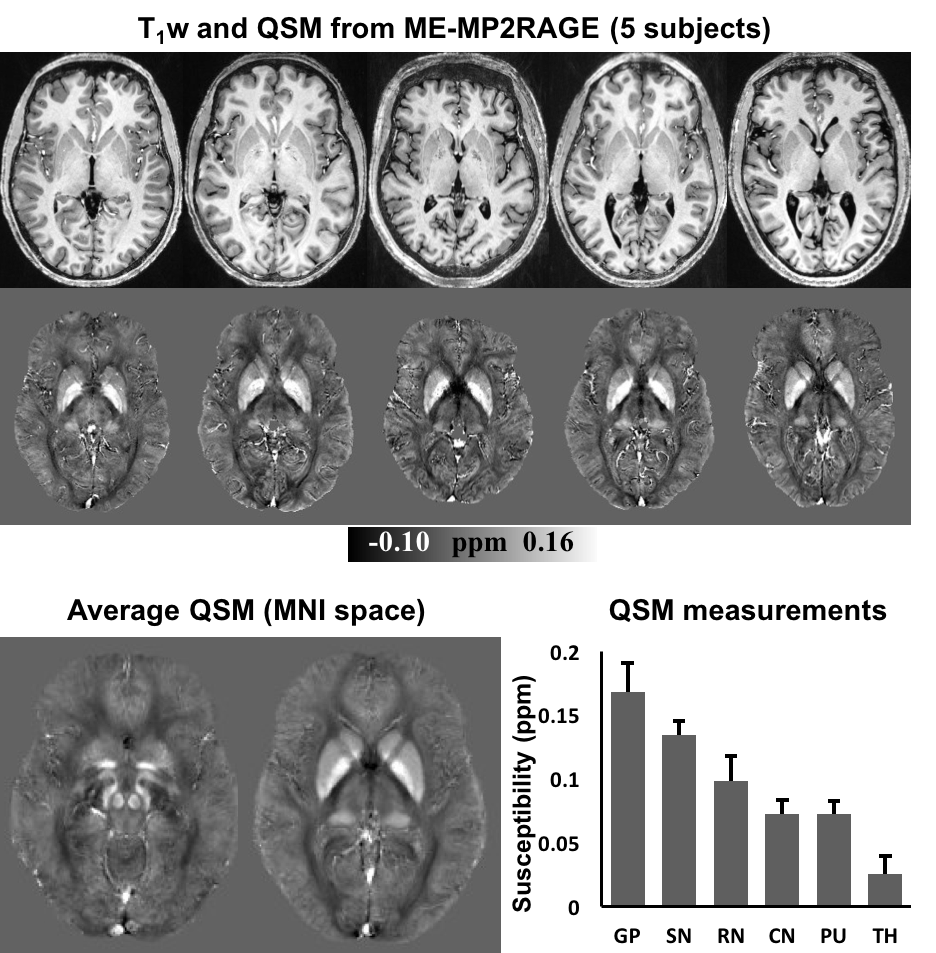
T1w images and the corresponding QSMs from the 5 subjects are displayed in Figure 4 in central axial slices containing iron-rich deep grey matter structures. The average QSM images of the 5 subjects are produced by using the transformation matrix from the T1w images to the MNI template using FNIRT. Automated 3D segmentations and measurements of deep grey matter susceptibilities are plotted using the means and standard deviations.
Conclusion
We demonstrate tuned sequence parameters and reconstruction pipelines for QSM from ME-MP2RAGE with an acquisition time shorter than the total of a single-echo MP2RAGE and a GRE sequence (Table 1). After performing POEM phase combination, making use of the multiple echoes, we achieve high-resolution QSM similar to a standalone GRE acquisition, with the benefit of “free” outputs of T1-weighted anatomical, T1 map and T2* map. The simultaneous outputs of T1w and QSM images also eliminate the need for registration and interpolation of two separate scans. The combination of the two contrasts may enable more accurate brain segmentations using advanced methods [7, 8], where QSM provides complimentary deep grey matter contrast, compared to standard T1w images, in regions of dentate nucleus, red nucleus, substantial nigra, putamen and thalamus.Acknowledgements
Alberta Innovates: Health Solutions
RHISE HBI-Melbourne Trainee Research Exchange
University of Melbourne McKenzie fellowship
NHMRC Peter Doherty Fellowship
National Imaging Facility (Australian government NCRIS program)
High-performance computing support provided by the Multi-modal Australian ScienceS Imaging and Visualisation Environment (MASSIVE)
Canadian Institutesof Health Research
Campus Alberta Innovates Program
References
[1] Marques JP, Kober T, Krueger G, van der Zwaag W, Van de Moortele PF, Gruetter R. MP2RAGE, a self bias-field corrected sequence for improved segmentation and T1-mapping at high field. Neuroimage. 2010 Jan 15;49(2):1271-81.
[2] Metere R, Kober T, Möller HE, Schäfer A. Simultaneous Quantitative MRI Mapping of T1, T2* and Magnetic Susceptibility with Multi-Echo MP2RAGE. PLoS One. 2017 Jan 12;12(1):e0169265.
[3] Sun H, MacDonald ME, Pike GB; Phase Correction of a Bipolar Gradient-Echo Acquisition for Quantitative Susceptibility Mapping; ISMRM; Singapore; 2016.
[4] Abdul-Rahman HS, Gdeisat MA, Burton DR, Lalor MJ, Lilley F, Moore CJ. Fast and robust three-dimensional best path phase unwrapping algorithm. Appl Opt. 2007 Sep 10;46(26):6623-35.
[5] Sun H, Wilman AH. Background field removal using spherical mean value filtering and Tikhonov regularization. Magn Reson Med. 2014 Mar;71(3):1151-7.
[6] Li W, Wang N, Yu F, Han H, Cao W, Romero R, Tantiwongkosi B, Duong TQ, Liu C. A method for estimating and removing streaking artifacts in quantitative susceptibility mapping. Neuroimage. 2015 Mar;108:111-22.
[7] Cobzas D, Sun H, Walsh AJ, Lebel RM, Blevins G, Wilman AH. Subcortical gray matter segmentation and voxel-based analysis using transverse relaxation and quantitative susceptibility mapping with application to multiple sclerosis. J Magn Reson Imaging. 2015 Dec;42(6):1601-10.
[8] Feng X, Deistung A, Dwyer MG, Hagemeier J, Polak P, Lebenberg J, Frouin F, Zivadinov R, Reichenbach JR, Schweser F. An improved FSL-FIRST pipeline for subcortical gray matter segmentation to study abnormal brain anatomy using quantitative susceptibility mapping (QSM). Magn Reson Imaging. 2017 Jun;39:110-122.
Figures