4992
An assessment of the ‘Prescan-Normalize Adaptive Combine’ approach to combining phase images from multi-channel coils at 3T1High Field Magnetic Resonance Centre, Department of Biomedical Imaging and Image-guided Therapy, Medical University of Vienna, Vienna, Austria
Synopsis
The combination of data acquired with array coils often leads to phase artifacts. The recently-introduced method ‘Prescan-Normalize Adaptive Combine’ (PN-AC) is assessed in terms of non-ΔB0-related contributions and reproducibility with different head positions and compared with a robust multi-echo phase combination approach (called ASPIRE) which yields only ΔB0-related phase. PN-AC was found to generate low noise phase images but introduce non-ΔB0-related contributions to the combined phase. It was robust to motion between the prescan and the main acquisition other than the introduction of arbitrary background phase.
Purpose
To assess the effectiveness of the phase combination method Prescan-Normalize Adaptive Combine (PN-AC) [1], considering the possible presence of i) open-ended fringelines (which would indicate signal nulling) ii) non-ΔB0-related contributions to the combined phase iii) consistency between acquisitions in different head positions iv) robustness where there is motion between the prescan and the scan to be reconstructed.Introduction
The PN-AC method is an approach to combining phase images from phased array coils which references single-channel phases to the body coil phase acquired in a prescan prior to adaptive combination [1]. It was developed as an improvement over Adaptive Combine [2], which was highly prone to phase artifacts such as open-ended fringelines. To verify the improvement in PN-AC and to investigate remaining phase artifacts, it was compared with the phase combination method ASPIRE [3] that uses a multi-echo acquisition with $$$TE_2=2\cdot{TE_1}$$$ to calculate and remove all non-ΔB0-related phase contributions.Methods
A healthy volunteer was measured with a 3T MR whole body Siemens PRISMA scanner and a 64-channel Siemens head coil with 52 activated elements. The scan to be reconstructed was a monopolar 3D MEGE acquisition of the brain with 3 echoes at TE=5,10,15 ms, FOV 215 mm x 215 mm x 176 mm, voxel size of 0.5 mm x 0.5 mm x 1.1 mm, receiver bandwidth 300 Hz/pixel, GRAPPA 2 acceleration, slice and phase partial Fourier factors of 6/8, and a scan time of 481 s.
Three scans were acquired:
Scan 1: head position at isocenter of magnet
Scan 2: z-displacement of the head of 2 cm and rotation of 11° about the left-right axis (nod)
Scan 3: prescan with head position as in Scan 1; main acquisition with z-displacement of 2.5 cm and 4° rotation about the left-right axis
In the analysis, the Hermitian Inner Product (HIP) [4] between two echoes was taken to be the ground truth for the wrapped phase evolution. The remaining non-ΔB0-related phase was estimated by subtracting the HIP from the phase of the first echo and conversion to a frequency difference. The same approach was taken to assess the phase evolution between combined phase images.
Results
The first two questions were assessed on Scan 1.
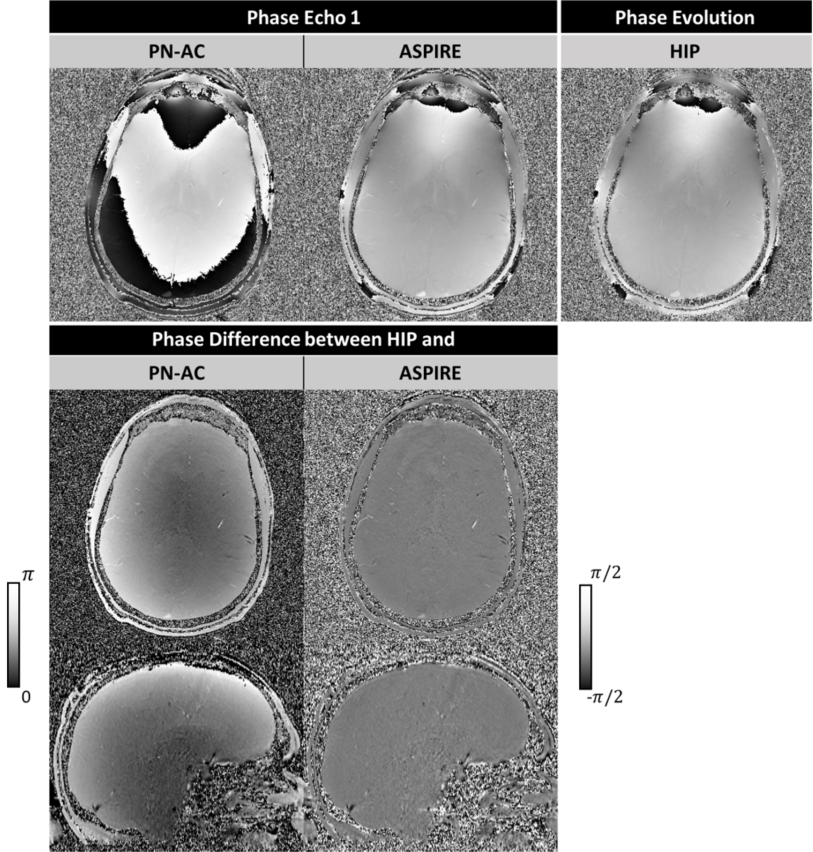
i) No open ended fringelines or signal nulling were present in the PN-AC combined phase images (Fig.1, top left).
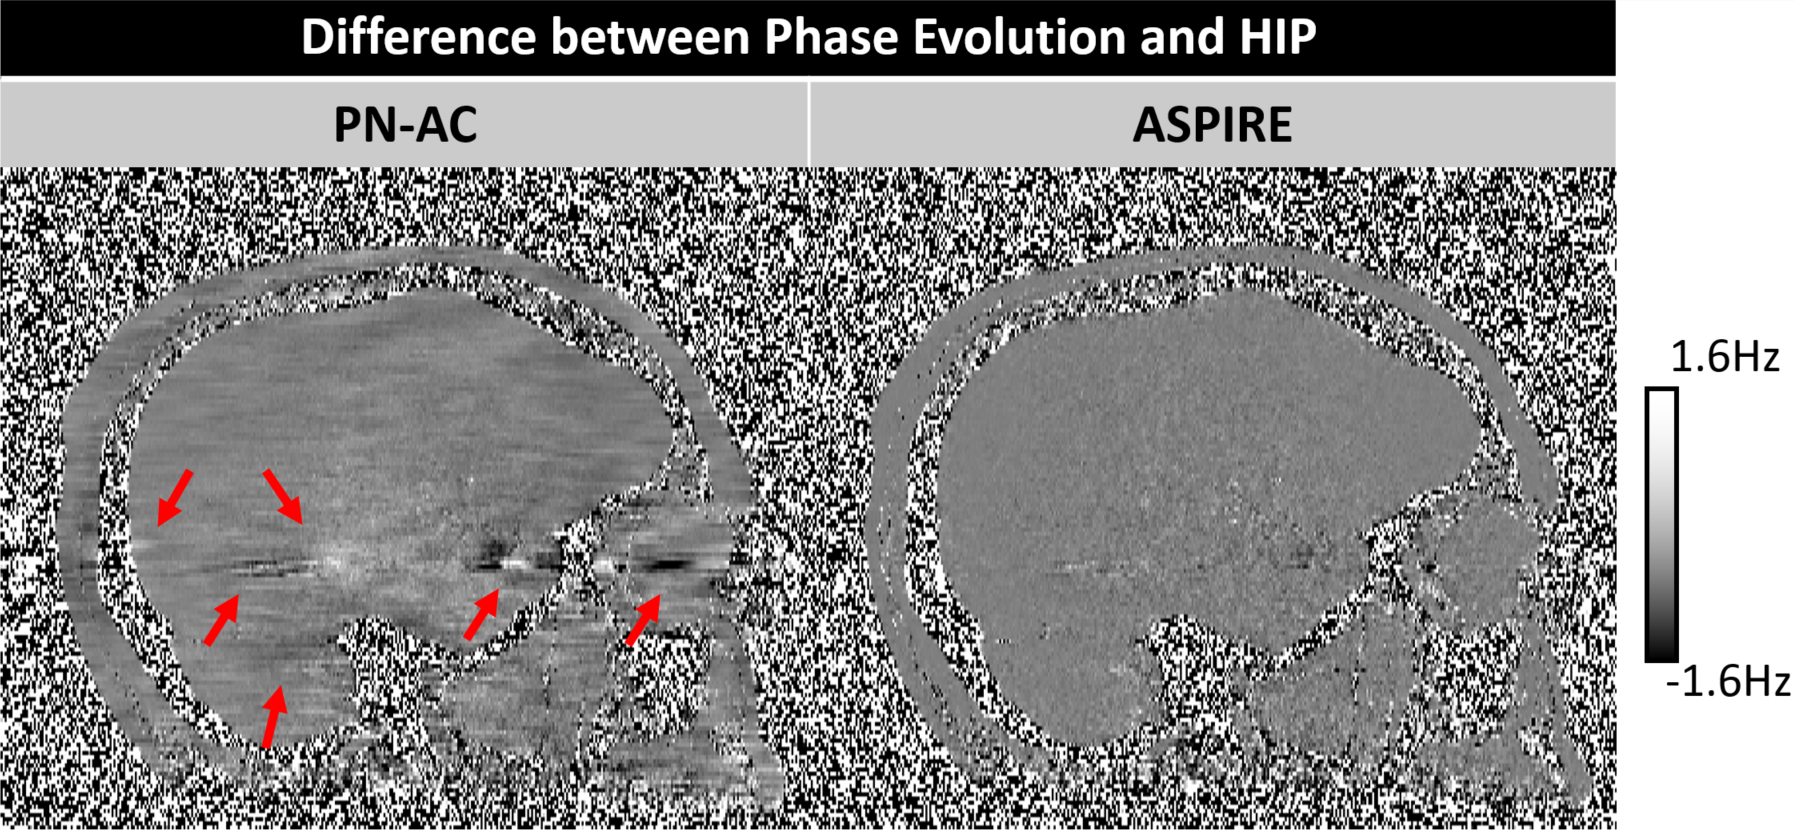
ii) Spatially varying non-ΔB0-related phase of up to π was present in PN-AC (Fig.1, bottom left), which corresponds to 100 Hz of frequency shift. There was no non-B0-related contribution to the combined phase in the comparison method ASPIRE other than in non-flow-compensated vessels. The influence on the calculated phase evolution (B0 fieldmap) is shown in Fig. 2. The deviation from the HIP (ground truth) is generally higher for PN-AC, but still below 1 Hz. Only in the region behind the eyes is the variation higher - up to 4 Hz - probably due to field changes due to eye motion.
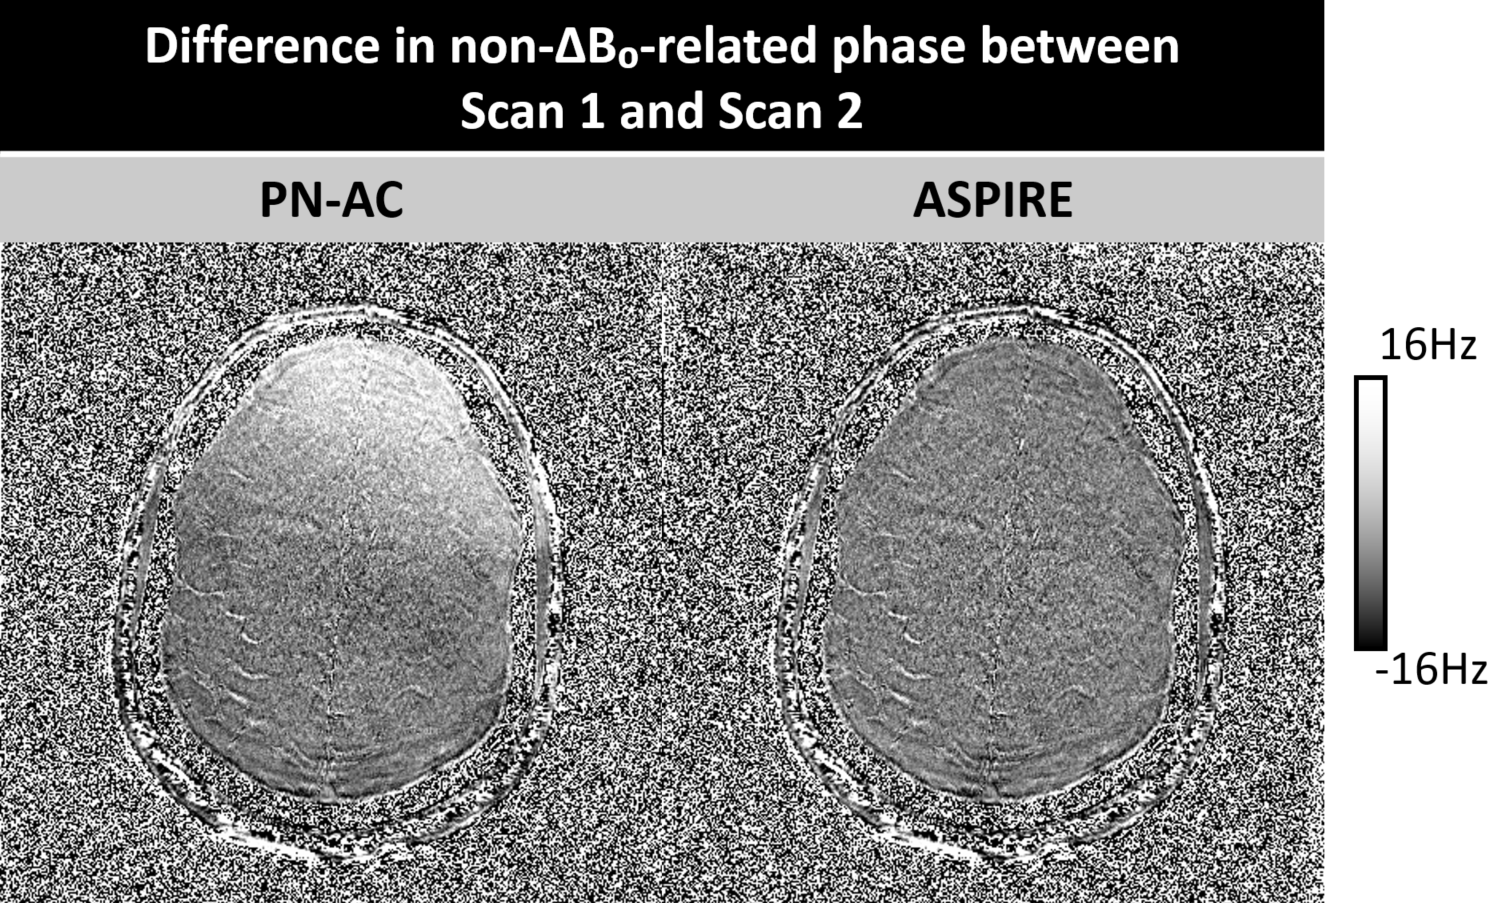
iii) The non-ΔB0-related phase was estimated for a second head position (Scan 2) and after coregistration it was subtracted from the non-ΔB0-related phase of the first head position. A frequency difference of up to 16 Hz was observed, showing a change in phase offset terms for different head positions. The ASPIRE combination was free of phase offset changes.
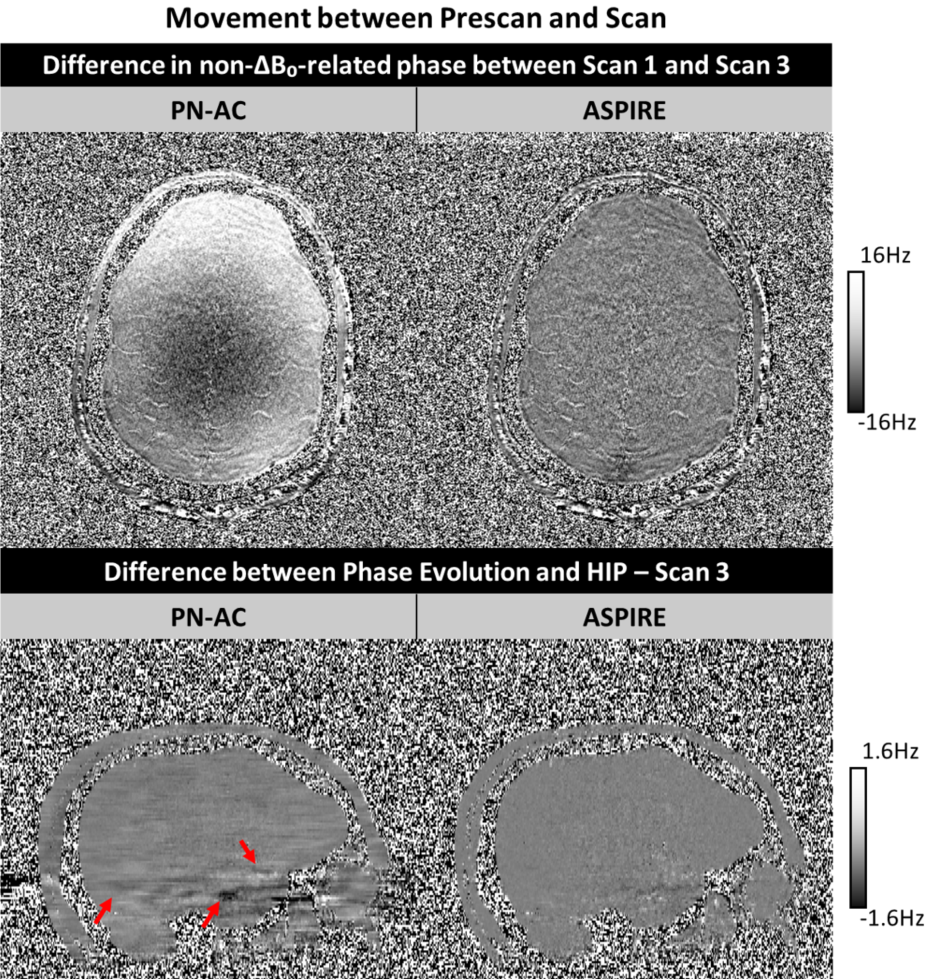
iv) Scan 3, in which there was a change in position between the prescan and the main acquisition is presented in Fig. 4. The change in phase offset terms shows a prominent spatial profile, but the phase evolution shows no adverse effects and has comparable small frequency shifts to Scan 1 without movement.
Discussion
PN-AC generated artifact-free phase images even if there was motion between the prescan and the scan to be reconstructed. It also yielded large phase offset terms in the combined phase images, however, which have been shown to bias some phase-based methods such as QSM [4].
Similar to the Roemer/SENSE combination [5], PN-AC is restricted to systems with a body coil.
A limitation in this assessment was that phase matching quality could not be calculated because corrected single-channel data was not available.
Conclusion
PN-AC is an improvement over Adaptive Combine which yields phase images of the brain without open-ended fringelines. Combined phase images contain phase offsets up to π radians (100 Hz), however, and B0 calculated fieldmaps may contain small artifacts (here, of up to 4 Hz close to the eyes). The phase evolution calculated from PN-AC is reproducible for different head positions, but the arbitrary contributions to the measured phase change.Acknowledgements
This study was supported by funds of the Oesterreichische Nationalbank Anniversary Fund, Project Number 16213.References
1. Jellus V and Kannengiesser S. Adaptive Coil Combination Using a Body Coil Scan as Phase Reference. In Proceedings of the 23th Annual Meeting of the ISMRM, Milan, Italy, 2014. #4406.
2. Walsh DO, Gmitro AF and Marcellin MW. Adaptive reconstruction of phased array MR imagery. Magnetic Resonance in Medicine, 2000;43(5):682–690.
3. Eckstein K, Dymerska B, Bachrata B, Bogner W, Poljanc K, Trattnig S and Robinson SD. Computationally Efficient Combination of Multi-channel Phase Data From Multi-echo Acquisitions (ASPIRE), Magnetic Resonance in Medicine, 2017; doi: 10.1002/mrm.26963.
4. Schweser F, Atterbury M, Deistung A, Lehr B, Sommer K and Reichenbach JR. Harmonic phase subtraction methods are prone to B1 background components. In Proceedings of the 19th Annual Meeting of the ISMRM, Montréal, Québec, Canada, 2011. #188.
5. Roemer PB, Edelstein WA, Hayes CE, Souza SP, Mueller OM. The NMR phased array. Magnetic Resonance in Medicine, 1990;16(2):192-225
Figures