4989
Bone Marrow Susceptibility as a Marker of Bone Mineral Density in Spondyloarthritis1Department of Medical Physics and Biomedical Engineering, University College London, London, United Kingdom, 2Centre for Medical Imaging, University College London, London, United Kingdom, 3Arthritis Research UK Centre for Adolescent Rheumatology, University College London, London, United Kingdom, 4Department of Medical Physics, University College London Hospitals, London, United Kingdom
Synopsis
New bone formation (causing spinal fusion) and bone loss are both key features of spondyloarthritis, and contribute to significant morbidity and disability. However, these processes are difficult to monitor using conventional MRI, which provides minimal information about bone mineral density (BMD). Here, we show that bone marrow susceptibility can be used as a marker of BMD, using data from a fat-water-bone phantom and from subjects with spondyloarthritis. Susceptibility values are significantly increased in areas of fat metaplasia compared to normal marrow, suggesting that this lesion represents a form of local bone loss, which could be monitored using susceptibility mapping.
Purpose
The spondyloarthritides are a group of inflammatory diseases involving the spine, lower limb joints, and entheses1. New bone formation (in the form of spinal fusion) and bone loss are both key features of spondyloarthritis2, and contribute to morbidity and disability in these patients. However, the T1-weighted and T2-weighted short tau inversion recovery (STIR) images which are currently used in clinical practice3-6 provide minimal information on bone density, making this aspect of disease difficult to monitor. Previously, Bray et al. have proposed R2* as a quantitative biomarker of trabecular bone mineral density (BMD) as the diamagnetic nature of bony trabeculae is expected to increase the rate of signal decay7. They found a correlation between BMD and R2* in a fat-water-bone phantom (a mixture of peanut oil, agar solution, and granules of bovine bone matrix), and also significantly reduced R2* in areas of fat metaplasia in patients with sacroiliitis (sacroiliac joint inflammation). However, R2* measurements cannot differentiate between para- and diamagnetic structures8. Moreover, R2* measurements might be confounded by bone fat content as fat has been repeatedly found to be more paramagnetic than water-based tissue9-11. Here we extend the aforementioned study using susceptibility mapping8,12,13 in the phantom and patient images acquired by Bray et al. to evaluate susceptibility as a more accurate biomarker of BMD.Methods
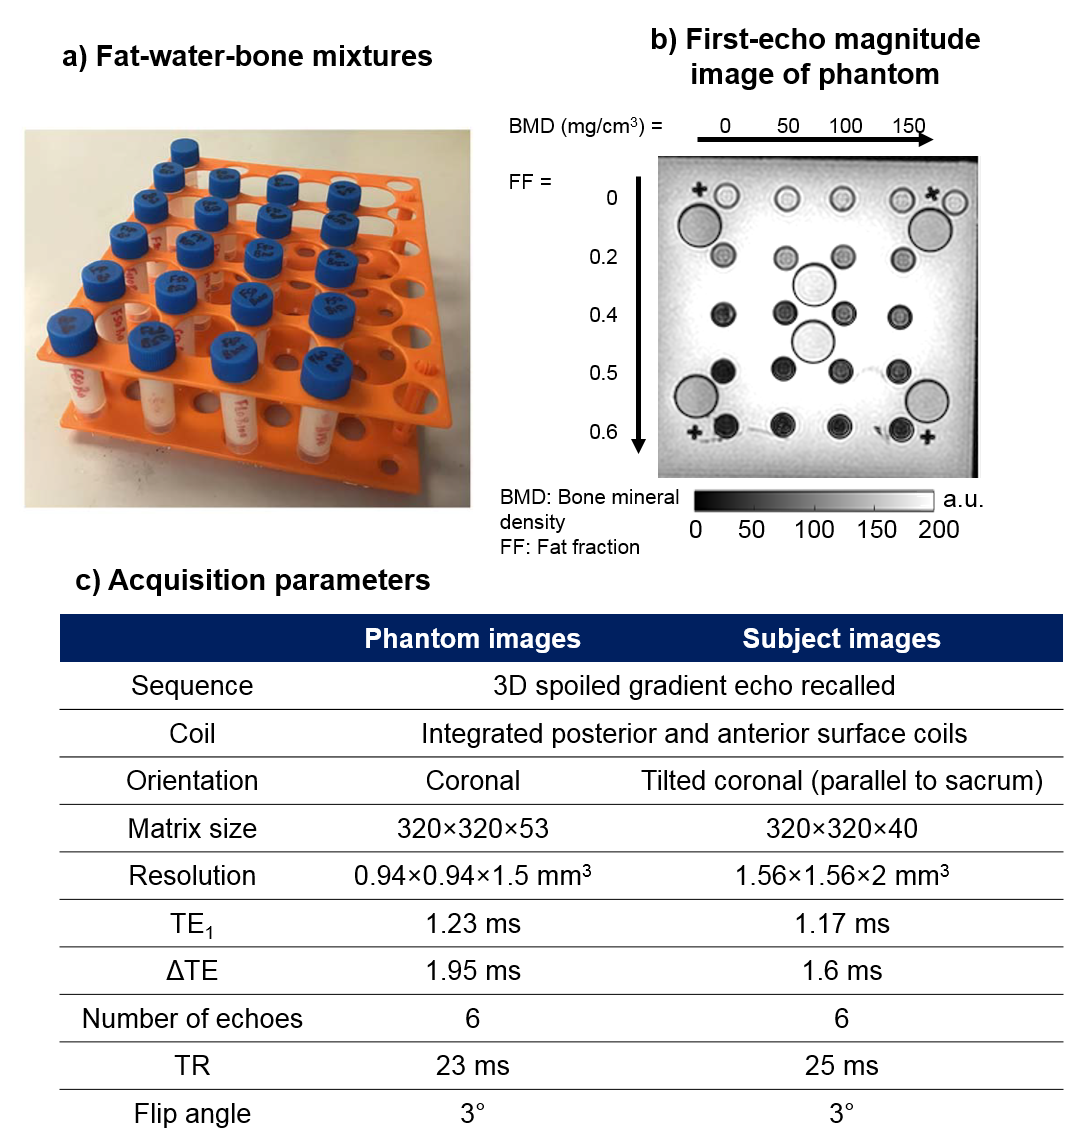
The fat-water-bone phantom (Figure 1a,b) and 19 subjects (10 patients with sacroiliitis and 9 healthy controls) were scanned using chemical shift encoded MRI on a 3-Tesla (Philips, Ingenia) clinical system7 with parameters shown in Figure 1c. Susceptibility maps were obtained using: 1. 3-point Dixon method14 to estimate a field map without fat-water chemical shift effects, 2. Laplacian phase unwrapping15, 3. Projection onto dipole fields16 to remove background fields, and 4. k-space inversion using Tikhonov regularisation17 to calculate the susceptibility maps. Masks were obtained in each case by thresholding the inverse noise map calculated from the multi-echo magnitude images17,18 except in bony voxels that were not excluded from the tissue masks despite their low signal. Artifact-inducing structures were manually segmented and excluded from the phantom mask.
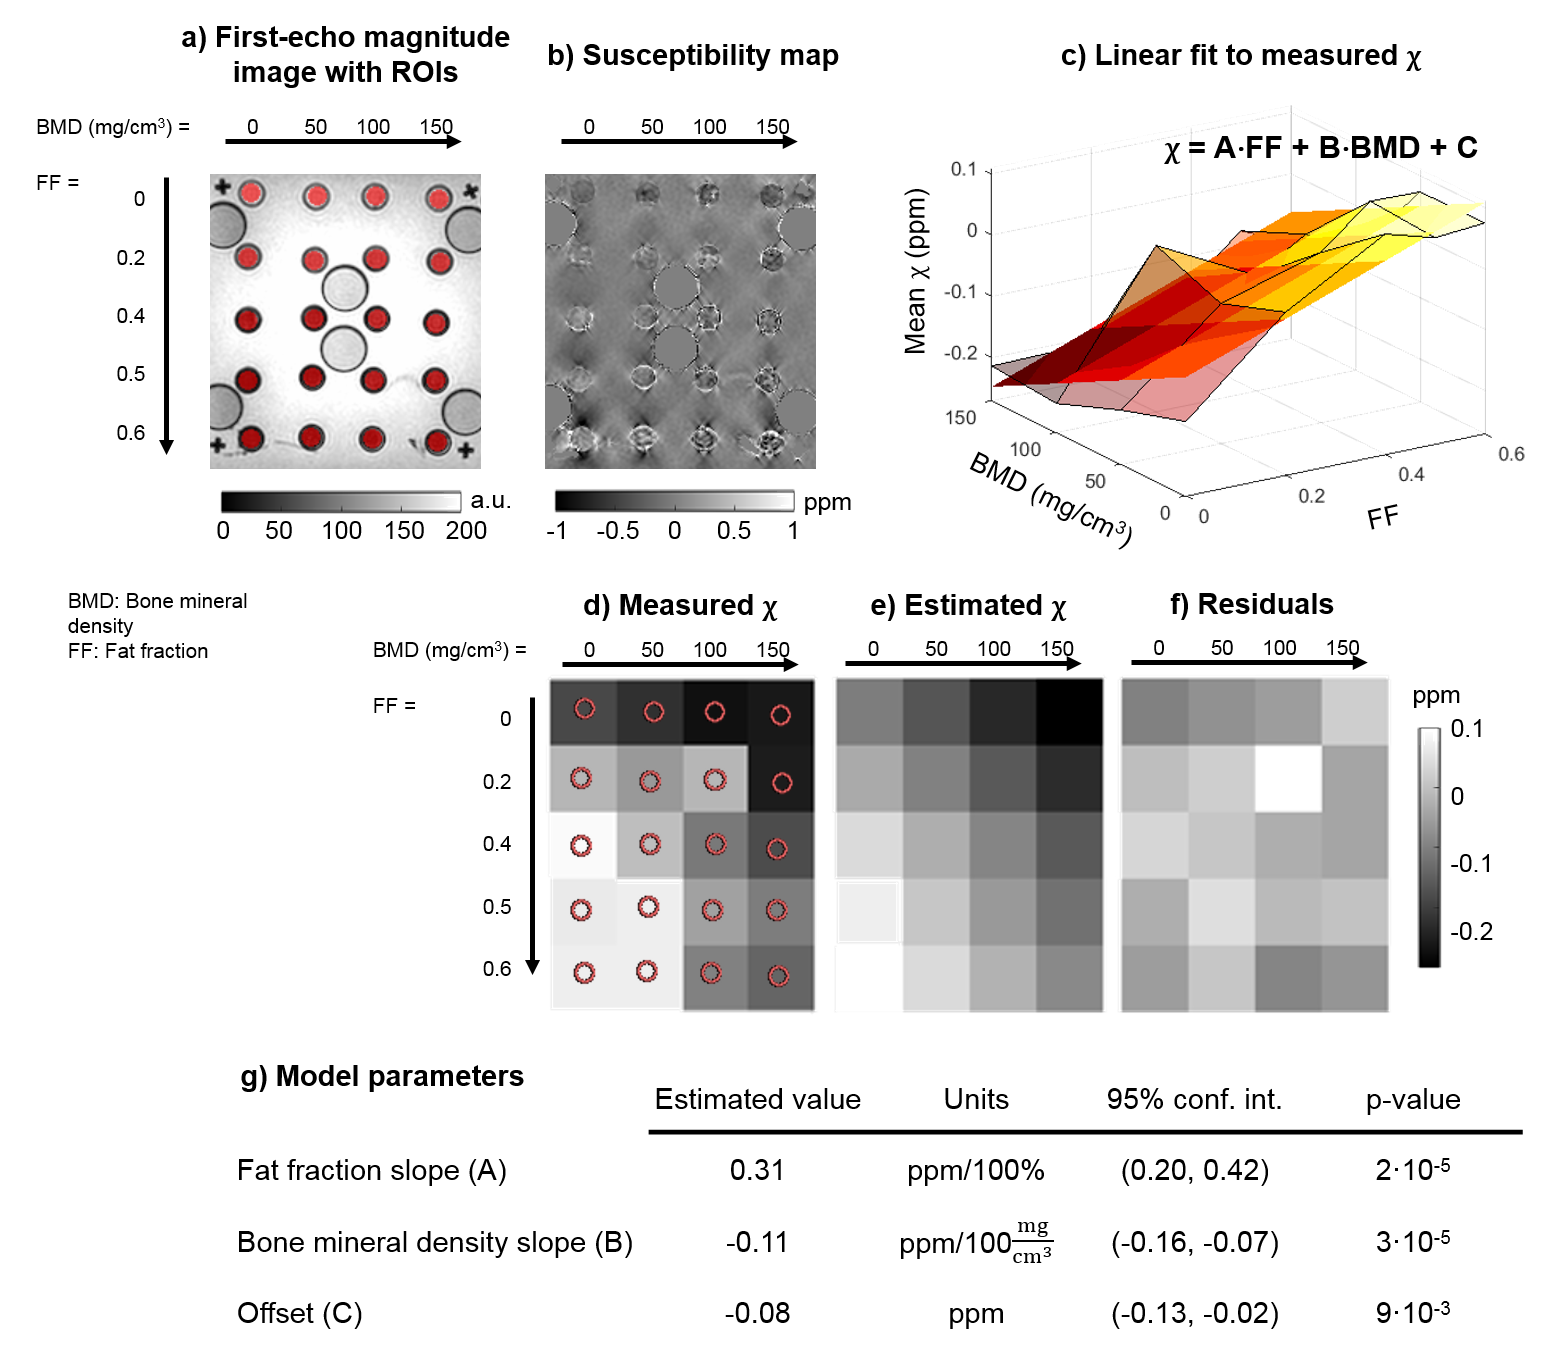
For the phantom, regions of interest (ROIs) were manually drawn on the first-echo magnitude image (Figure 2a). For the subjects, areas of normal bone marrow, oedema, and fat metaplasia were manually segmented on T2-weighted STIR and T1-weighted images and then transferred to fat fraction (FF) and susceptibility maps by an experienced radiology resident (T.J.P.B.). Mean susceptibilities were calculated in all segmented ROIs. A 2D linear function (Figure 2c) was fitted to the susceptibilities measured in the phantom as a function of FF and BMD. Multi-level mixed-effects linear regression was used to determine whether there are significant differences in susceptibilities measured in normal bone marrow, oedema, and fat metaplasia. ROIs which were very close to fat-water chemical shift artifacts in the susceptibility maps were excluded from the analysis (this included all ROIs from two subjects, and two additional ROIs from a third subject).
Results and Discussion
In the fat-water-bone phantom, measured susceptibility increased with increasing FF (as fat is more paramagnetic than water9-11) and decreasing BMD (due to the diamagnetic trabeculae) as expected (Figure 2b-d). The fitted plane (Figure 2c) seemed to model the measured values well (Figure 2c-f), with p-values<0.01 for all model parameters (Figure 2g).
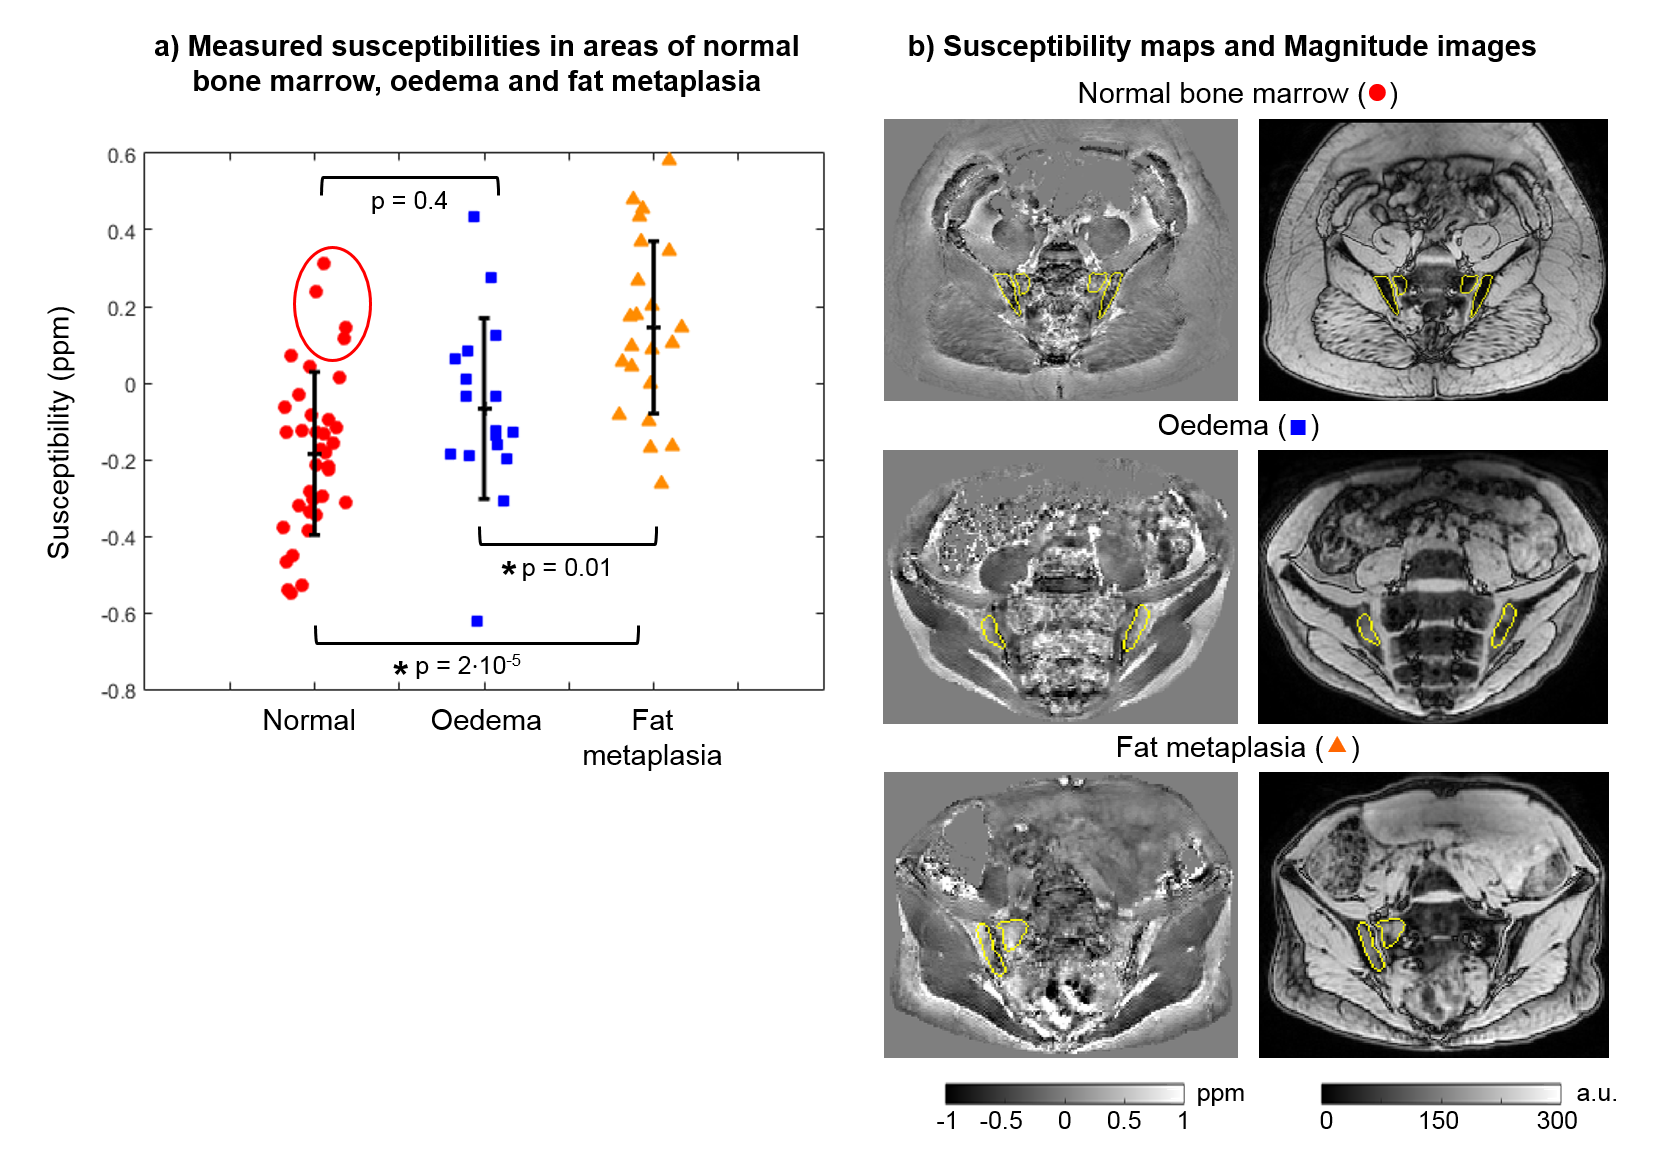
Normal bone marrow had negative susceptibility values (-0.19±0.22 ppm), presumably due to the diamagnetic nature of bony trabeculae (Figure 3a). Areas of fat metaplasia demonstrated significantly increased susceptibility values compared to normal marrow (0.14±0.23 ppm, p=2·10-5), likely due to the presence of paramagnetic fat, whereas there was no significant difference between oedema and normal marrow (p=0.4). Note that the four highest susceptibility values in normal bone (red circle) were measured in the same subject, so these unrealistically high values could be due to a processing issue in this subject. Since both diamagnetic and paramagnetic components were absent in areas of oedema, these appear to be closer to the susceptibility of water/tissue (-0.08±0.24 ppm). Example susceptibility maps and first echo magnitude images are shown in Figure 3b.
Conclusions
Bone marrow susceptibility is increased in areas of fat metaplasia compared to normal marrow, reinforcing previous suggestions that this lesion represents a form of local bone loss. Furthermore, marrow susceptibility is a promising biomarker for monitoring BMD in patients with sacroiliitis. Future work may involve scanning a more realistic fat-water-bone phantom using lard rather than peanut oil and separating the total susceptibility maps into fat- and bone trabeculae-induced susceptibility maps using the FF maps for a more accurate measure of BMD. We also aim to optimise the acquisition parameters for susceptibility mapping.Acknowledgements
Anita Karsa’s work was supported by the EPSRC-funded UCL Centre for Doctoral Training in Medical Imaging (EP/L016478/1) and the Department of Health’s National Institute for Health Research funded Biomedical Research Centre at University College London Hospitals. Timothy J.P. Bray was supported by Arthritis Research UK Grant 21369. Shonit Punwani is receiving support from the Biomedical Research Centre and also from the Cancer Research UK KCL/UCL Cancer Imaging Centre. Margaret A. Hall-Craggs was supported by the Biomedical Research Centre. Karin Shmueli was supported by an EPSRC First Grant (EP/K02746/1).References
1. Braun, Jürgen, and Joachim Sieper. "Ankylosing spondylitis." The Lancet 369.9570 (2007): 1379-1390.
2. Neidhart, Michel, et al. "Expression of cathepsin K and matrix metalloproteinase 1 indicate persistent osteodestructive activity in long-standing ankylosing spondylitis." Annals of the rheumatic diseases 68.8 (2009): 1334-1339.
3. Fisher, Corinne, et al. "Enthesitis related arthritis; a new era of understanding." Ann Paediatr Rheum 1.1 (2012): 8-16.
4. Maksymowych, Walter P., et al. "Spondyloarthritis research Consortium of Canada magnetic resonance imaging index for assessment of sacroiliac joint inflammation in ankylosing spondylitis." Arthritis Care & Research 53.5 (2005): 703-709.
5. Maksymowych, Walter P., et al. "Development and preliminary validation of the spondyloarthritis research consortium of Canada magnetic resonance imaging sacroiliac joint structural score." The Journal of rheumatology 42.1 (2015): 79-86.
6. Rudwaleit, M., et al. "MRI in predicting a major clinical response to anti-tumour necrosis factor treatment in ankylosing spondylitis." Annals of the rheumatic diseases 67.9 (2008): 1276-1281.
7. Bray, Timothy JP, et al. "Simultaneous Quantification of Bone Edema/Adiposity and Structure in Inflamed Bone Using Chemical Shift‐Encoded MRI in Spondyloarthritis." Magnetic Resonance in Medicine (2017).
8. Shmueli, Karin, et al. "Magnetic susceptibility mapping of brain tissue in vivo using MRI phase data." Magnetic resonance in medicine 62.6 (2009): 1510-1522.
9. Sharma, Samir D., et al. "MRI‐based quantitative susceptibility mapping (QSM) and R2* mapping of liver iron overload: Comparison with SQUID‐based biomagnetic liver susceptometry." Magnetic resonance in medicine 78.1 (2017): 264-270.
10. Dong, Jianwu, et al. "Simultaneous phase unwrapping and removal of chemical shift (SPURS) using graph cuts: application in quantitative susceptibility mapping." IEEE transactions on medical imaging 34.2 (2015): 531-540.
11. Dimov, Alexey V., et al. "Joint estimation of chemical shift and quantitative susceptibility mapping (chemical QSM)." Magnetic resonance in medicine 73.6 (2015): 2100-2110.
12. Reichenbach, J. R., et al. "Quantitative susceptibility mapping: concepts and applications." Clinical neuroradiology 25.2 (2015): 225-230.
13. Eskreis‐Winkler, Sarah, et al. "The clinical utility of QSM: disease diagnosis, medical management, and surgical planning." NMR in Biomedicine 30.4 (2017).
14. Berglund, Johan, et al. "Three‐point dixon method enables whole‐body water and fat imaging of obese subjects." Magnetic Resonance in Medicine 63.6 (2010): 1659-1668.
15. Schweser, Ferdinand, et al. "Toward online reconstruction of quantitative susceptibility maps: superfast dipole inversion." Magnetic resonance in medicine 69.6 (2013): 1581-1593.
16. Liu, Tian, et al. "A novel background field removal method for MRI using projection onto dipole fields." NMR in Biomedicine 24.9 (2011): 1129-1136.
17. Kressler, Bryan, et al. "Nonlinear regularization for per voxel estimation of magnetic susceptibility distributions from MRI field maps." IEEE transactions on medical imaging 29.2 (2010): 273.
18. MEDI toolbox: http://weill.cornell.edu/mri/pages/qsm.html
Figures