4988
Fat Correction of MRI Phase Images for Accurate Susceptibility Mapping in the Head and Neck1Department of Medical Physics and Biomedical Engineering, University College London, London, United Kingdom, 2Centre for Medical Imaging, University College London, London, United Kingdom
Synopsis
Susceptibility Mapping (QSM) is increasingly applied in parts of the body where fatty tissue is present. QSM uses the phase of the complex MRI signal which contains both susceptibility-, and chemical-shift-induced components. For accurate QSM, the latter need to be suppressed. Here we compared a range of different fat-correction strategies for QSM in head-and-neck images. Techniques providing reliable fat-fraction maps also gave similar susceptibility values in fatty fascia. However, some of these methods were not robust to the choice of echo times. In-phase imaging was found to be the best candidate for robust fat-correction in QSM of the head-and-neck.
Purpose
Susceptibility mapping (QSM) is a recent technique that calculates tissue magnetic susceptibility from MRI phase images1-2. It is increasingly applied in parts of the body other than the brain where fatty tissue is present3-5. The chemical shift (CS) between fat and water appears as variations in the phase maps that are not susceptibility-induced. These can lead to different contrast between fat- and water-based tissues in the susceptibility map for images acquired at different echo times. Therefore, for accurate QSM, it is essential to remove CS-induced phase variations. In this work, we compared a range of different fat-correction techniques in head-and-neck images of healthy volunteers in terms of field and susceptibility map quality, susceptibility of fatty fascia, and robustness to variable echo timing.Methods
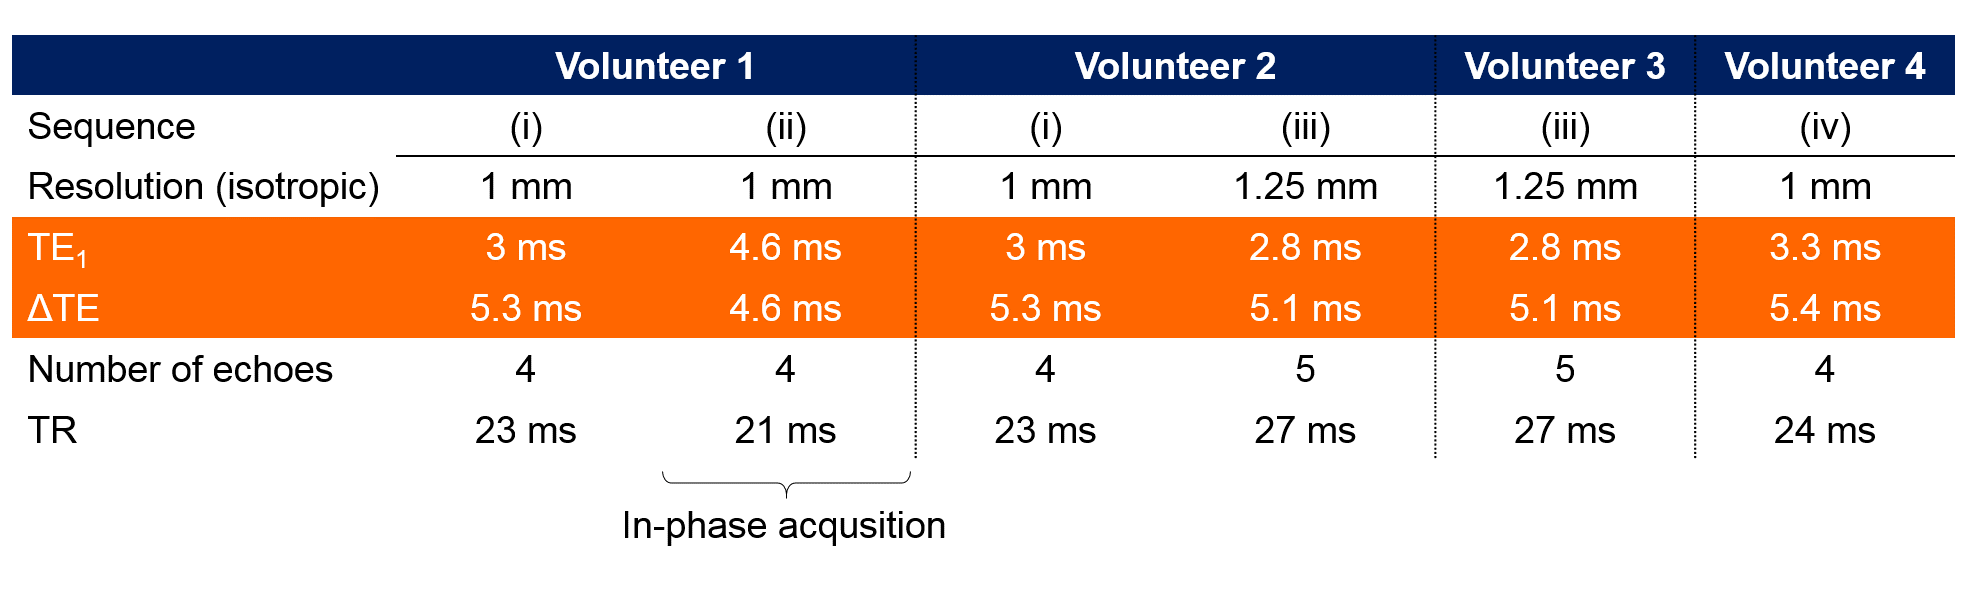
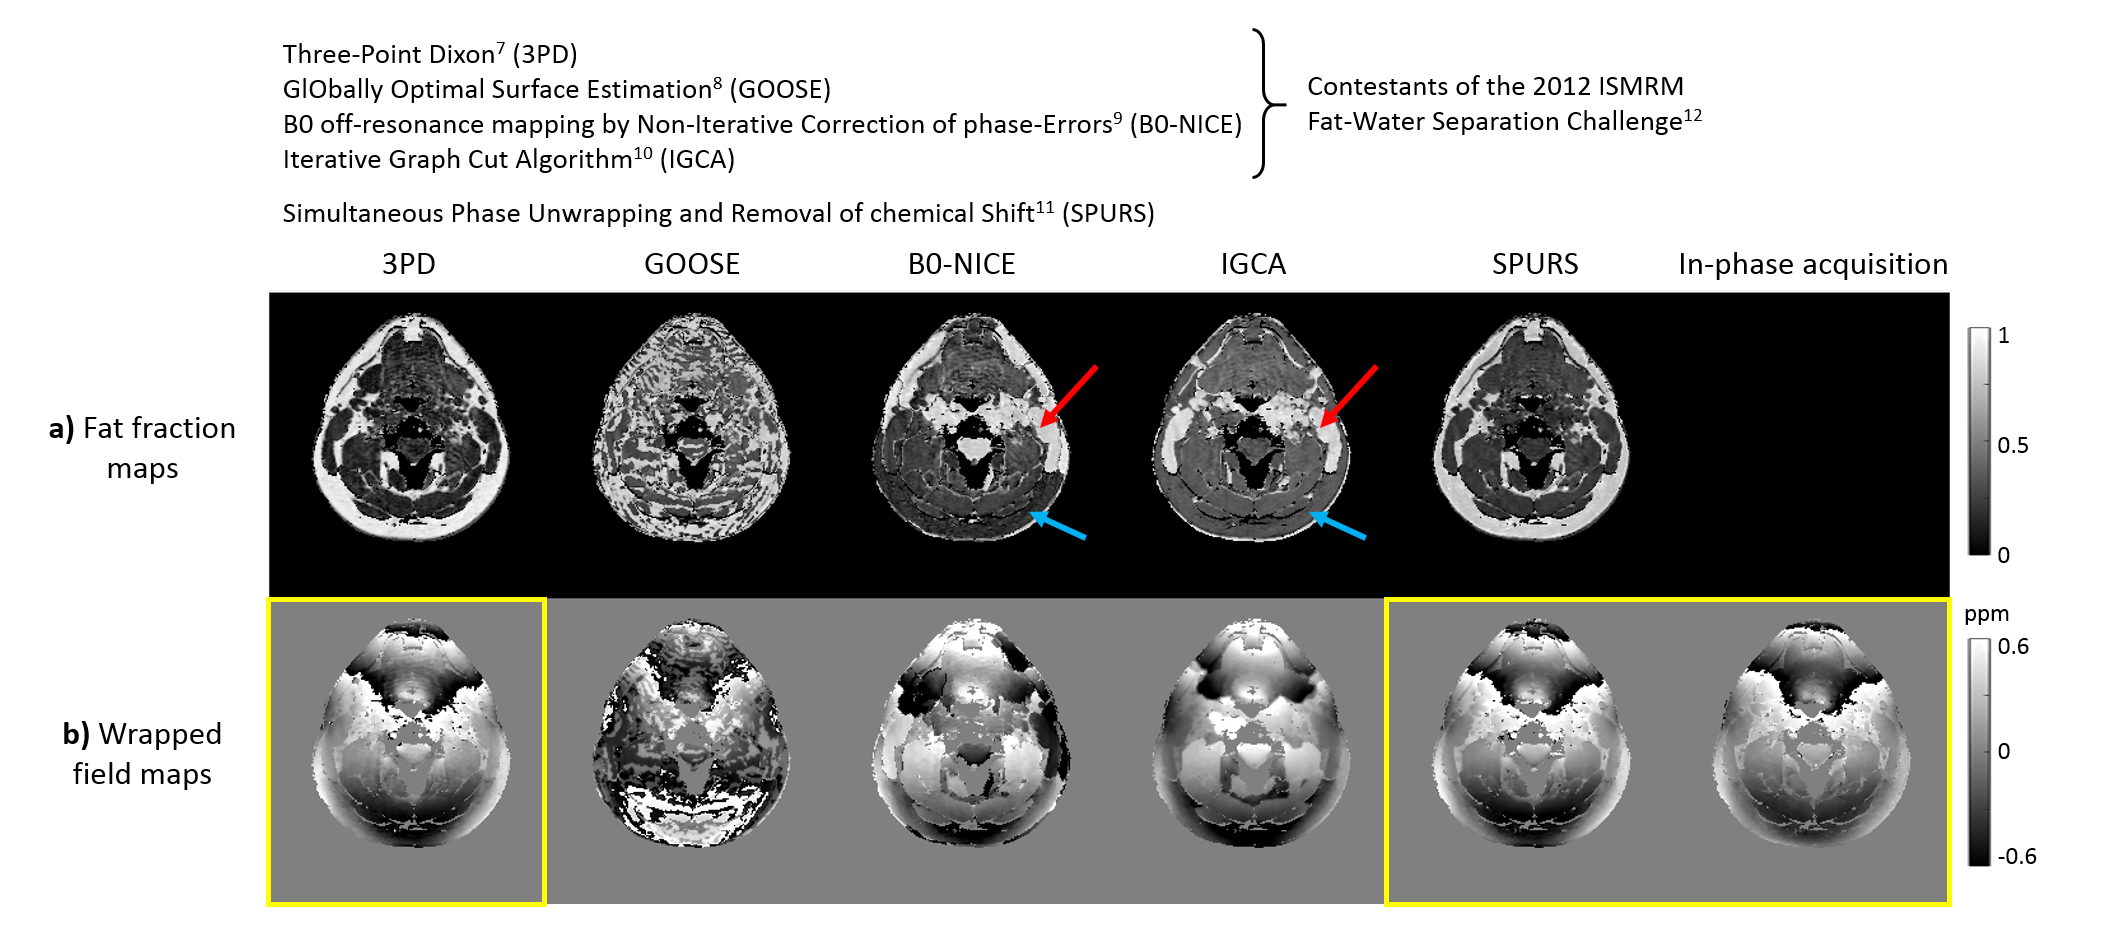
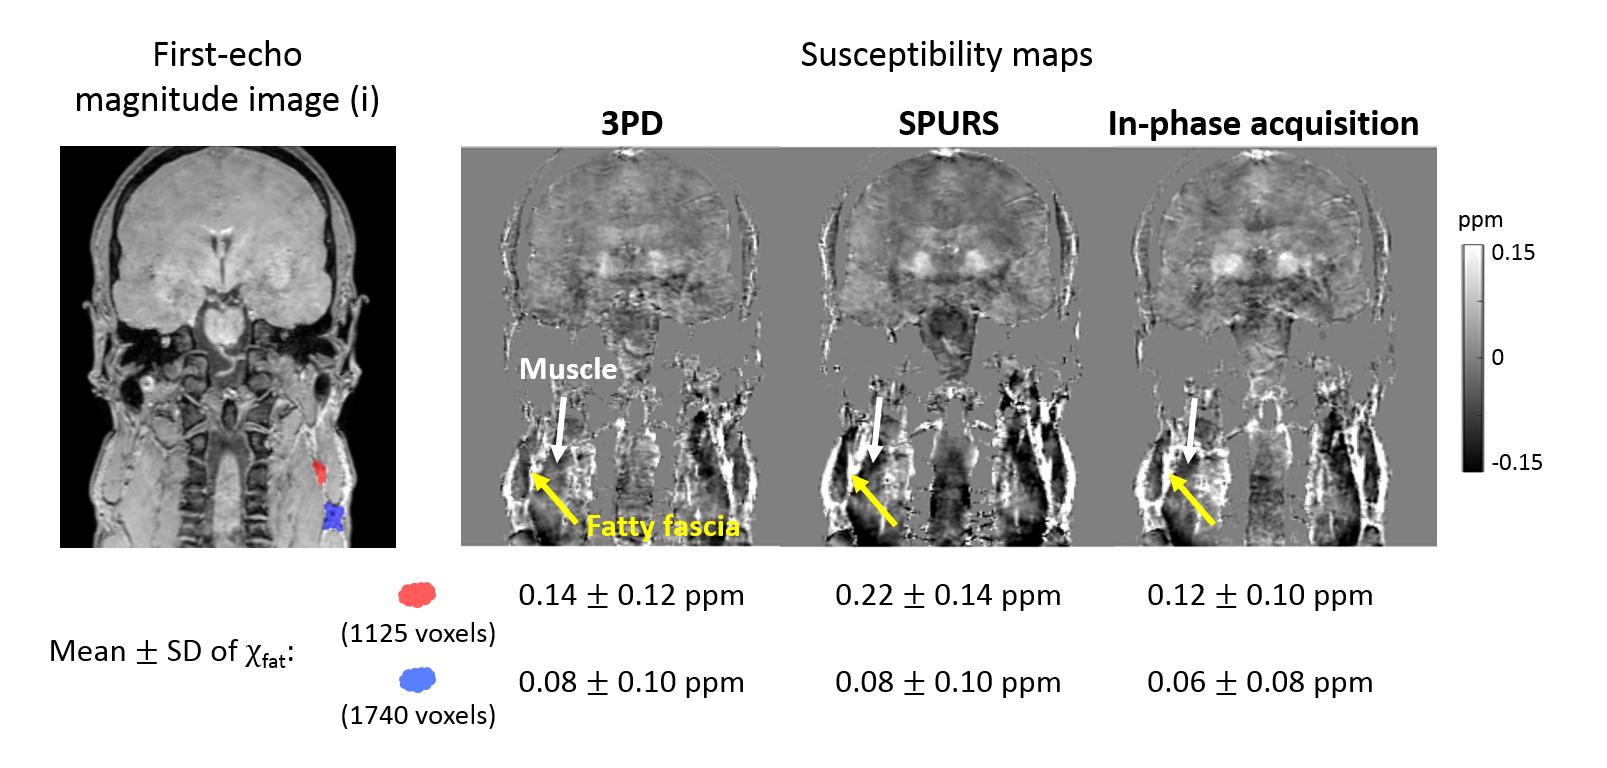
Multi-echo head-and-neck images were acquired in a healthy volunteer (Volunteer 1) on a 3T Philips Achieva (Best, NL) scanner using a 16-channel head-and-neck coil with parameters shown in Figure 1, Volunteer 1 (i). In-phase images6 were also acquired in the same volunteer (Figure 1, (ii)). Fat-fraction and fat-corrected field maps were calculated for Volunteer 1 (i) using five different fat-correction techniques: one designed for QSM (SPURS11) and the rest from the 2012 ISMRM fat-water separation challenge12 (Figure 2). A field map was also calculated from (ii) using non-linear field fitting13-14 on the multi-echo complex images. A head-and-neck tissue mask was calculated by thresholding the inverse noise map14-15. Susceptibility maps were calculated from the in-phase field map and all field maps with reliable fat-fraction maps (Figure 2, yellow boxes) using: 1. Laplacian phase unwrapping16 (except for the SPURS field map which was already unwrapped), 2. Projection onto Dipole Fields17, 3. Iterative fitting with Tikhonov regularisation15. Two 3D ROIs were drawn manually (Figure 3, magnitude image) in the fatty fascia on the first-echo magnitude image of (i) in ITK-SNAP18-19. The same regions were segmented in (ii) by rigidly registering the first-echo magnitude images using NiftyReg20 and applying the resulting transformation to the ROIs. The mean and standard deviation (SD) of the susceptibility in the ROIs were calculated in each case. SPURS and 3PD were also tested in head-and-neck images acquired in three more healthy volunteers using slightly different echo timings (Figure 1).Results and Discussion
Figure 2 shows a comparison between the six fat-correction strategies. GOOSE failed to provide an accurate fat-fraction map. B0-NICE and IGCA estimated high fat-fraction in the water-based sternocleidomastoid muscle (red arrows), and low fat-fraction in the subcutaneous fat (blue arrows). Fat-fraction maps provided by 3PD and SPURS were similar and in accordance with the known anatomy. Moreover, the 3PD, SPURS, and in-phase acquisition field maps were also very similar. Figure 3 shows susceptibility maps calculated from these three field maps. All three susceptibility maps had very similar fat/muscle contrast (yellow/white arrows). The susceptibility values of fat measured in two ROIs containing fatty tissue (see magnitude image) are in good agreement for the three fat-correction strategies.
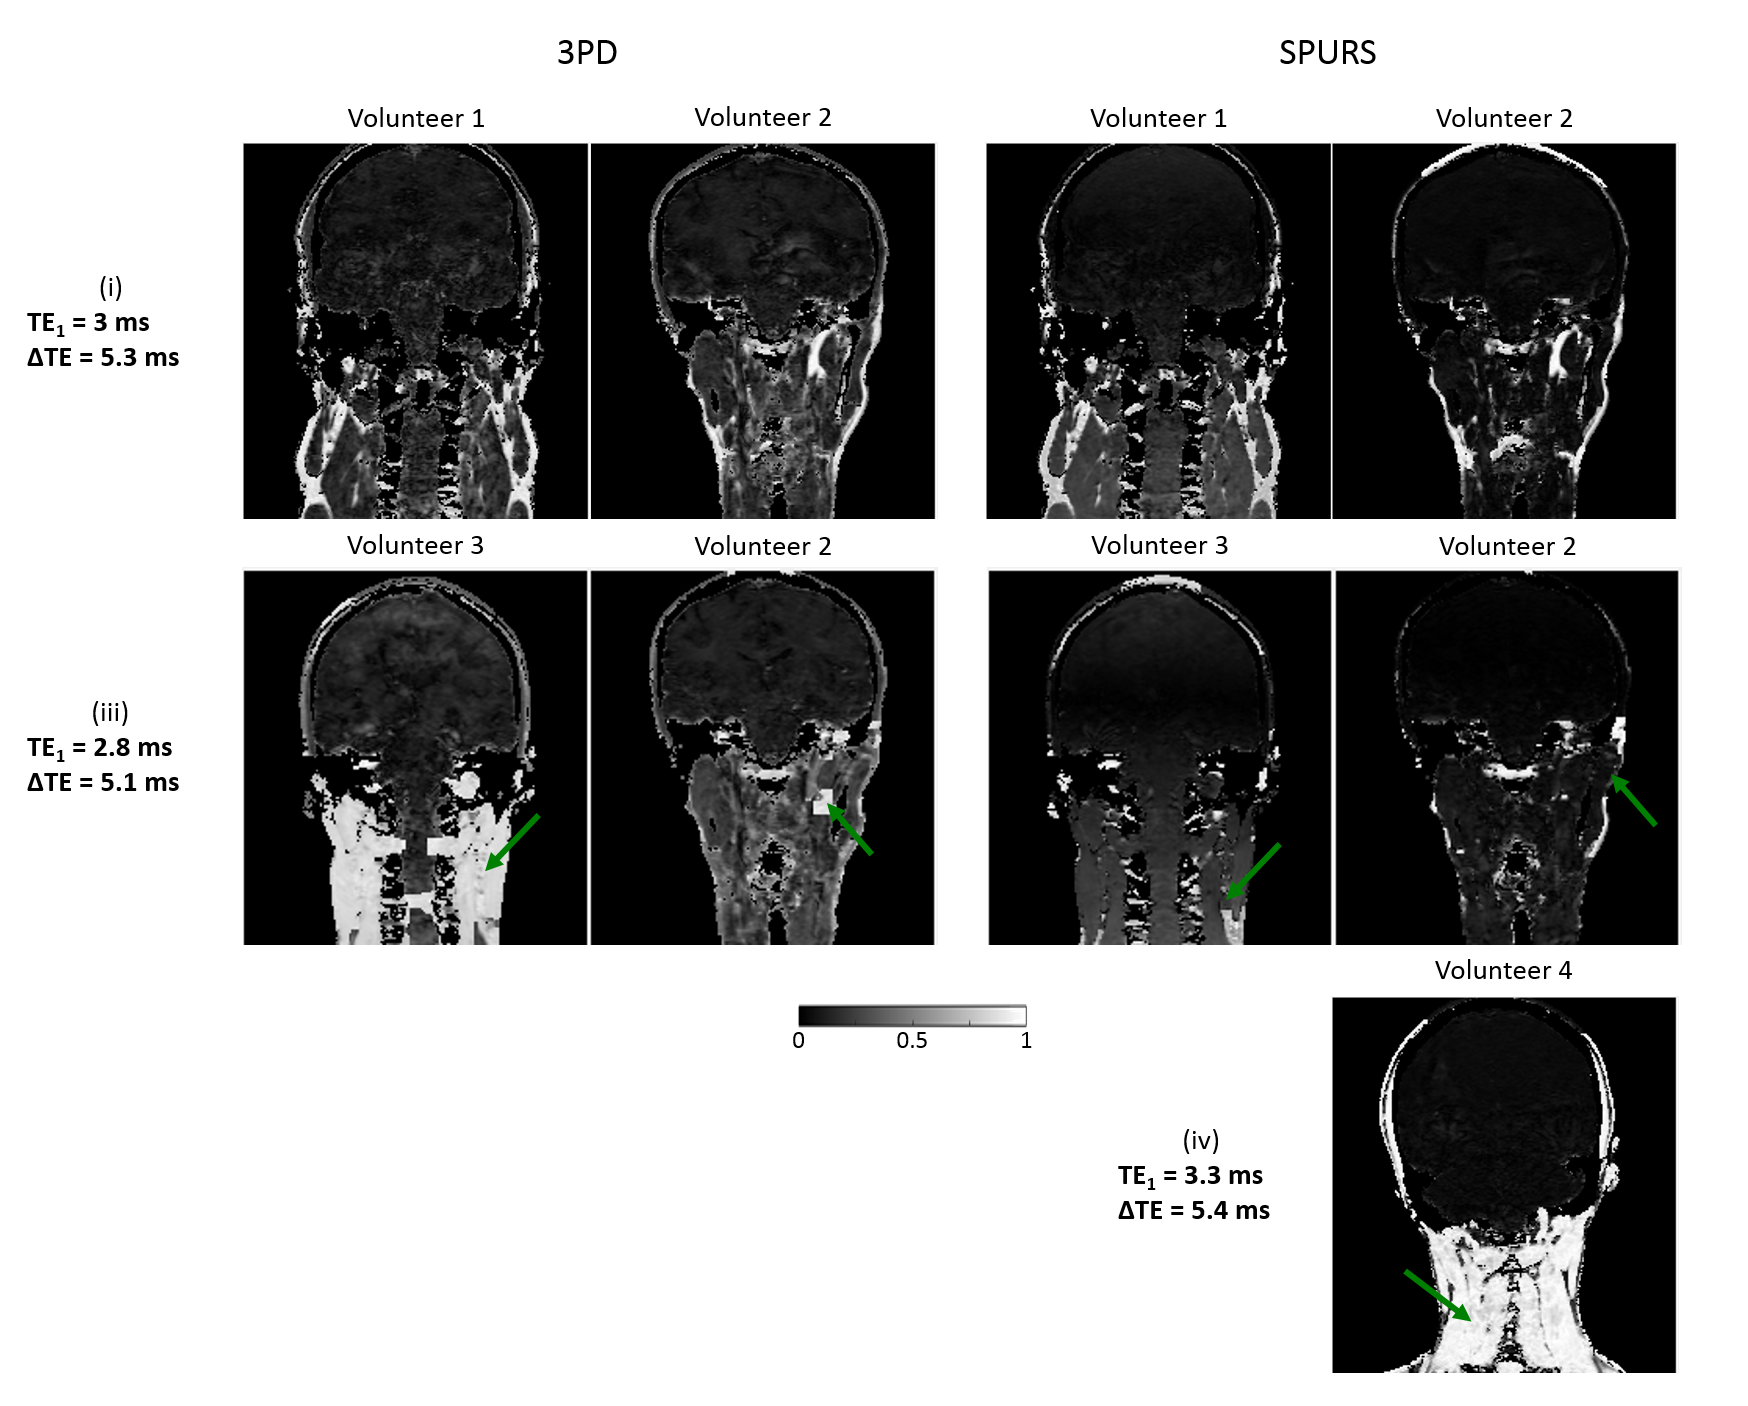
Figure 4 shows fat-fraction maps in four different volunteers, acquired with three different echo-timings (Figure 1), calculated using 3PD and SPURS. Both fat-correction techniques provided realistic fat-fraction maps in Volunteers 1 and 2 when the images were acquired with (i). However, these techniques failed for images of slightly different echo timings ((iii) and (iv)). Both algorithms include a step when the water and fat signals are determined in each voxel using region-growing methods that assume spatial smoothness. When this step fails, fat-water swaps can occur in the images (Figure 4, arrows). 3PD consistently failed for the (iii) echo timing, but performed well for (i) in both volunteers. According to the guidelines in Berglund et al.7, the echo timing in (iii) is not suitable for accurate water-fat separation at 3T, but the timing in (i) is close to optimal. However, there is only a 0.2 ms difference in both TE1s and ΔTEs between (i) and (iii). Consequently, a slightly different magnetic field or chemical shift could easily lead to similar errors. Therefore, 3PD cannot be expected to perform robustly in a multi-centre study. SPURS also failed for slightly different echo timings ((iii) and (iv)), therefore it is not robust to echo-timing either. In-phase imaging (ii) is a built-in option in most scanners. It suppresses CS effects on a voxel-by-voxel basis without performing any spatial, region-growing techniques. Therefore, it is a good candidate for robust fat-correction in head-and-neck images for accurate QSM.
Conclusions
We found in-phase imaging to be the most robust, fat-correction strategy for head-and-neck images. Future work will involve investigating the repeatability of head-and-neck susceptibility maps using in-phase imaging to suppress chemical shift effects.Acknowledgements
Anita Karsa’s work was supported by the EPSRC-funded UCL Centre for Doctoral Training in Medical Imaging (EP/L016478/1) and the Department of Health’s National Institute for Health Research funded Biomedical Research Centre at University College London Hospitals. Karin Shmueli was supported by an EPSRC First Grant (EP/K02746/1). Shonit Punwani is receiving support from the Biomedical Research Centre and also from the Cancer Research UK KCL/UCL Cancer Imaging Centre. We would like to thank Alexey Dimov (Weill Cornell Medical College, Cornell University, New York) for his help with the SPURS function.References
1. Reichenbach, J. R., et al. "Quantitative susceptibility mapping: concepts and applications." Clinical neuroradiology 25.2 (2015): 225-230.
2. Eskreis‐Winkler, Sarah, et al. "The clinical utility of QSM: disease diagnosis, medical management, and surgical planning." NMR in Biomedicine 30.4 (2017).
3. Sharma, Samir D., et al. "MRI‐based quantitative susceptibility mapping (QSM) and R2* mapping of liver iron overload: Comparison with SQUID‐based biomagnetic liver susceptometry." Magnetic resonance in medicine 78.1 (2017): 264-270.
4. Hernando, Diego, et al. "Quantification of liver iron with MRI: state of the art and remaining challenges." Journal of Magnetic Resonance Imaging 40.5 (2014): 1003-1021.
5. Dimov, Alexey V., et al. "Joint estimation of chemical shift and quantitative susceptibility mapping (chemical QSM)." Magnetic resonance in medicine73.6 (2015): 2100-2110.
6. Disler, D. G., et al. "In-phase and out-of-phase MR imaging of bone marrow: prediction of neoplasia based on the detection of coexistent fat and water." AJR. American journal of roentgenology 169.5 (1997): 1439-1447.
7. Berglund, Johan, et al. "Three‐point dixon method enables whole‐body water and fat imaging of obese subjects." Magnetic Resonance in Medicine 63.6 (2010): 1659-1668.
8. Cui, Chen, et al. "Fat water decomposition using globally optimal surface estimation (GOOSE) algorithm." Magnetic resonance in medicine 73.3 (2015): 1289-1299.
9. Liu, Junmin, and Maria Drangova. "Method for B0 off‐resonance mapping by non‐iterative correction of phase‐errors (B0‐NICE)." Magnetic resonance in medicine 74.4 (2015): 1177-1188.
10. Hernando, Diego, et al. "Robust water/fat separation in the presence of large field inhomogeneities using a graph cut algorithm." Magnetic resonance in medicine 63.1 (2010): 79-90.
11. Dong, Jianwu, et al. "Simultaneous phase unwrapping and removal of chemical shift (SPURS) using graph cuts: application in quantitative susceptibility mapping." IEEE transactions on medical imaging 34.2 (2015): 531-540.
12. The 2012 ISMRM Fat-Water Separation Challenge: http://challenge.ismrm.org/node/18
13. Liu, Tian, et al. "Nonlinear formulation of the magnetic field to source relationship for robust quantitative susceptibility mapping." Magnetic resonance in medicine 69.2 (2013): 467-476.
14. MEDI toolbox: http://weill.cornell.edu/mri/pages/qsm.html
15. Kressler, Bryan, et al. "Nonlinear regularization for per voxel estimation of magnetic susceptibility distributions from MRI field maps." IEEE transactions on medical imaging 29.2 (2010): 273.
16. Schweser, Ferdinand, et al. "Toward online reconstruction of quantitative susceptibility maps: superfast dipole inversion." Magnetic resonance in medicine 69.6 (2013): 1581-1593.
17. Liu, Tian, et al. "A novel background field removal method for MRI using projection onto dipole fields." NMR in Biomedicine 24.9 (2011): 1129-1136.
18. Yushkevich, Paul A., et al. "User-guided 3D active contour segmentation of anatomical structures: significantly improved efficiency and reliability." Neuroimage 31.3 (2006): 1116-1128.
19. ITK-SNAP: www.itksnap.org
20. Modat, Marc, et al. "Fast free-form deformation using graphics processing units." Computer methods and programs in biomedicine 98.3 (2010): 278-284.
Figures