4987
Quantitative MRI and laser ablation-inductively coupled plasma-mass spectrometry imaging of iron in post-mortem frontal cortex of Alzheimer patients1Radiology, LUMC, Leiden, Netherlands, 2Percuros BV, Leiden, Netherlands, 3Netherlands Forensic Institute, The Hague, Netherlands
Synopsis
Previous imaging studies reported iron-induced T2* or phase contrast changes in the cortex of post-mortem brain tissue of patients with Alzheimer’s disease (AD), but comparison with a gold standard is lacking. This study used laser ablation-inductively coupled plasma-mass spectrometry (LA-ICP-MS) as a gold standard for iron in post-mortem brain tissue of controls and AD patients and investigated the correlation between LA-ICP-MS, quantitative MRI (R2*, phase, and QSM) and histology. R2* and QSM showed the highest correlation with iron content; the correlation of phase with iron was weaker, probably due to its high orientation dependence.
Introduction
Previous ex vivo studies, using high-field T2*-weighted MRI sequences, reported iron-induced intensity changes in the cortex of post-mortem brain tissue of patients with Alzheimer’s disease (AD)1,2. Histology-MRI correlation analysis showed that the observed MRI contrast in AD is best explained by increased iron accumulation and changes in cortical myelin1. However, immunohistochemistry techniques to stain for iron are qualitative and susceptible to variation due to differences in protocols, labs and tissue preparation. A gold standard for iron detection is laser ablation-inductively coupled plasma-mass spectrometry (LA-ICP-MS), which is highly specific and can detect iron levels below the typical biological concentrations3.
Therefore, this study investigated the correlation between iron measured by LA-ICP-MS, MRI, and histology to confirm iron as the underlying source of T2*-weighted, phase or QSM contrast. In addition, we compared cortical iron levels between controls and AD patients.
Methods
Post-mortem tissue samples of the medial frontal gyrus from AD patients (N=6) and controls (N=3) were obtained from the Netherlands Brain Bank. MRI scans were acquired on a 7T Bruker system (Bruker Biospin, Ettlingen, Germany) using a Multiple Gradient Echo sequence (TR = 75.0 ms, TE = 12.5, 23.2, 33.9 and 44.6 ms, 100 µm isotropic resolution). R2* maps were calculated using an in-house written MatLab pipeline. Phase images were unwrapped using temporal fitting and Laplacian-based phase unwrapping. QSM maps were calculated using temporal fitting, Laplacian‐based phase unwrapping, V‐SHARP and MEDI dipole inversion. For each subject, regions of interest of the white (WM) and gray matter (GM) were manually drawn.
The same brain samples as used for MRI were serially cut (20 um) and used for LA-ICP-MS and a histological iron staining. After automatic non-linear registration using t-SNE based registration4 of the LA-ICP-MS iron map and the histological iron staining to MRI, the ROIs were propagated to all imaging modalities to calculate mean ICP-MS iron, iron histology intensity, R2*, phase, and QSM values per region.
Tissue blocks of 13 additional AD patients and 8 controls were scanned using the same MRI protocol. The cortex was manually annotated and mean R2*, phase, and QSM values were calculated.
Results
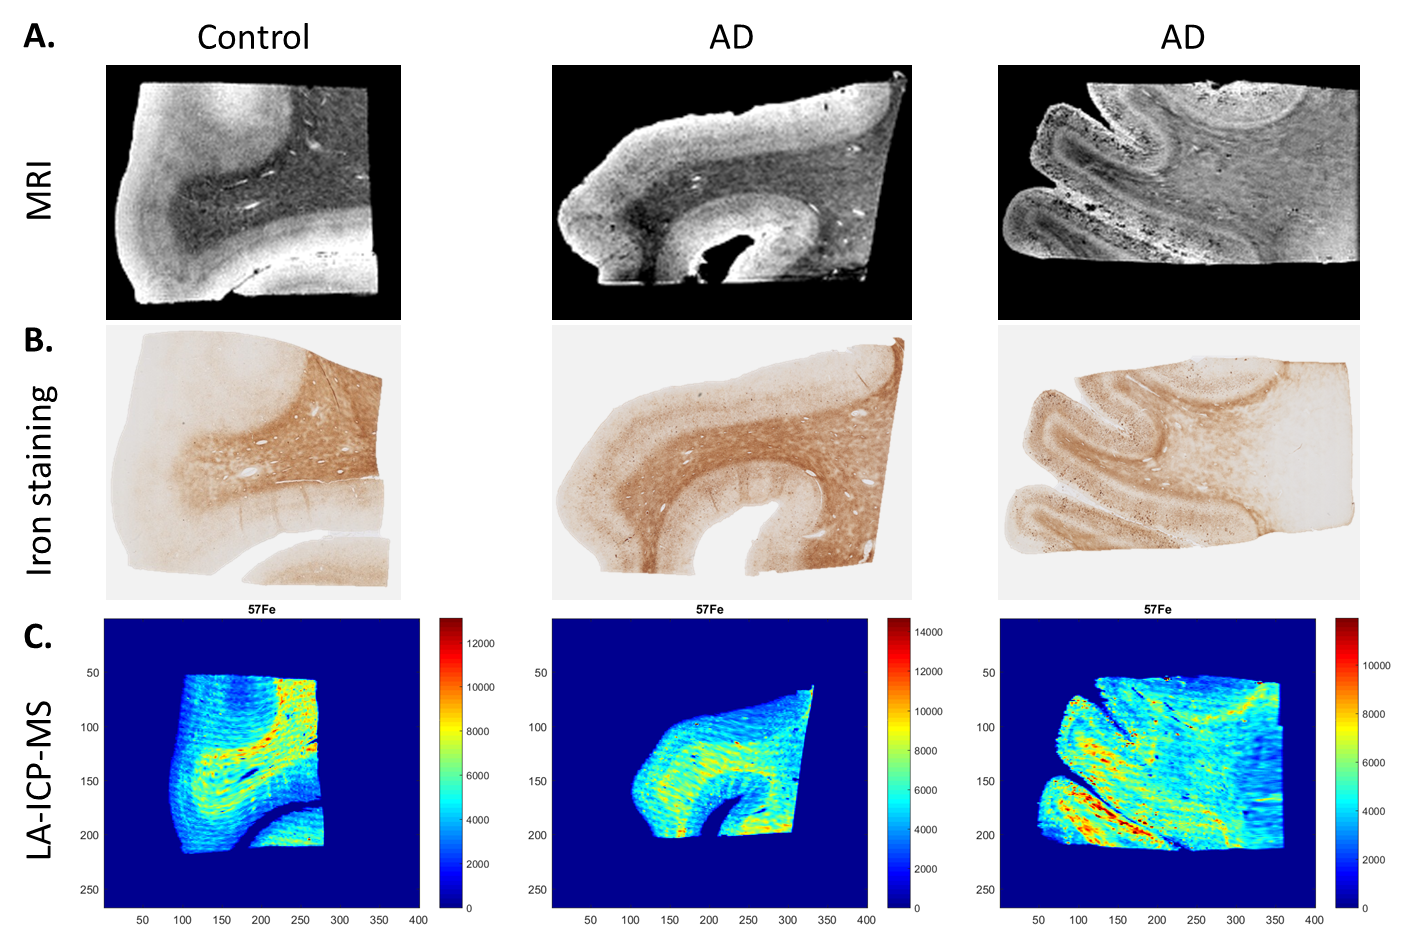
The magnitude images showed lowest signal amplitude in the myelin-rich areas of the WM and lines of Baillarger (Fig. 1A). Similar contrast patterns were found in the iron staining, LA-ICP-MS iron maps (Fig. 1B,C) and quantitative MRI images (not shown).
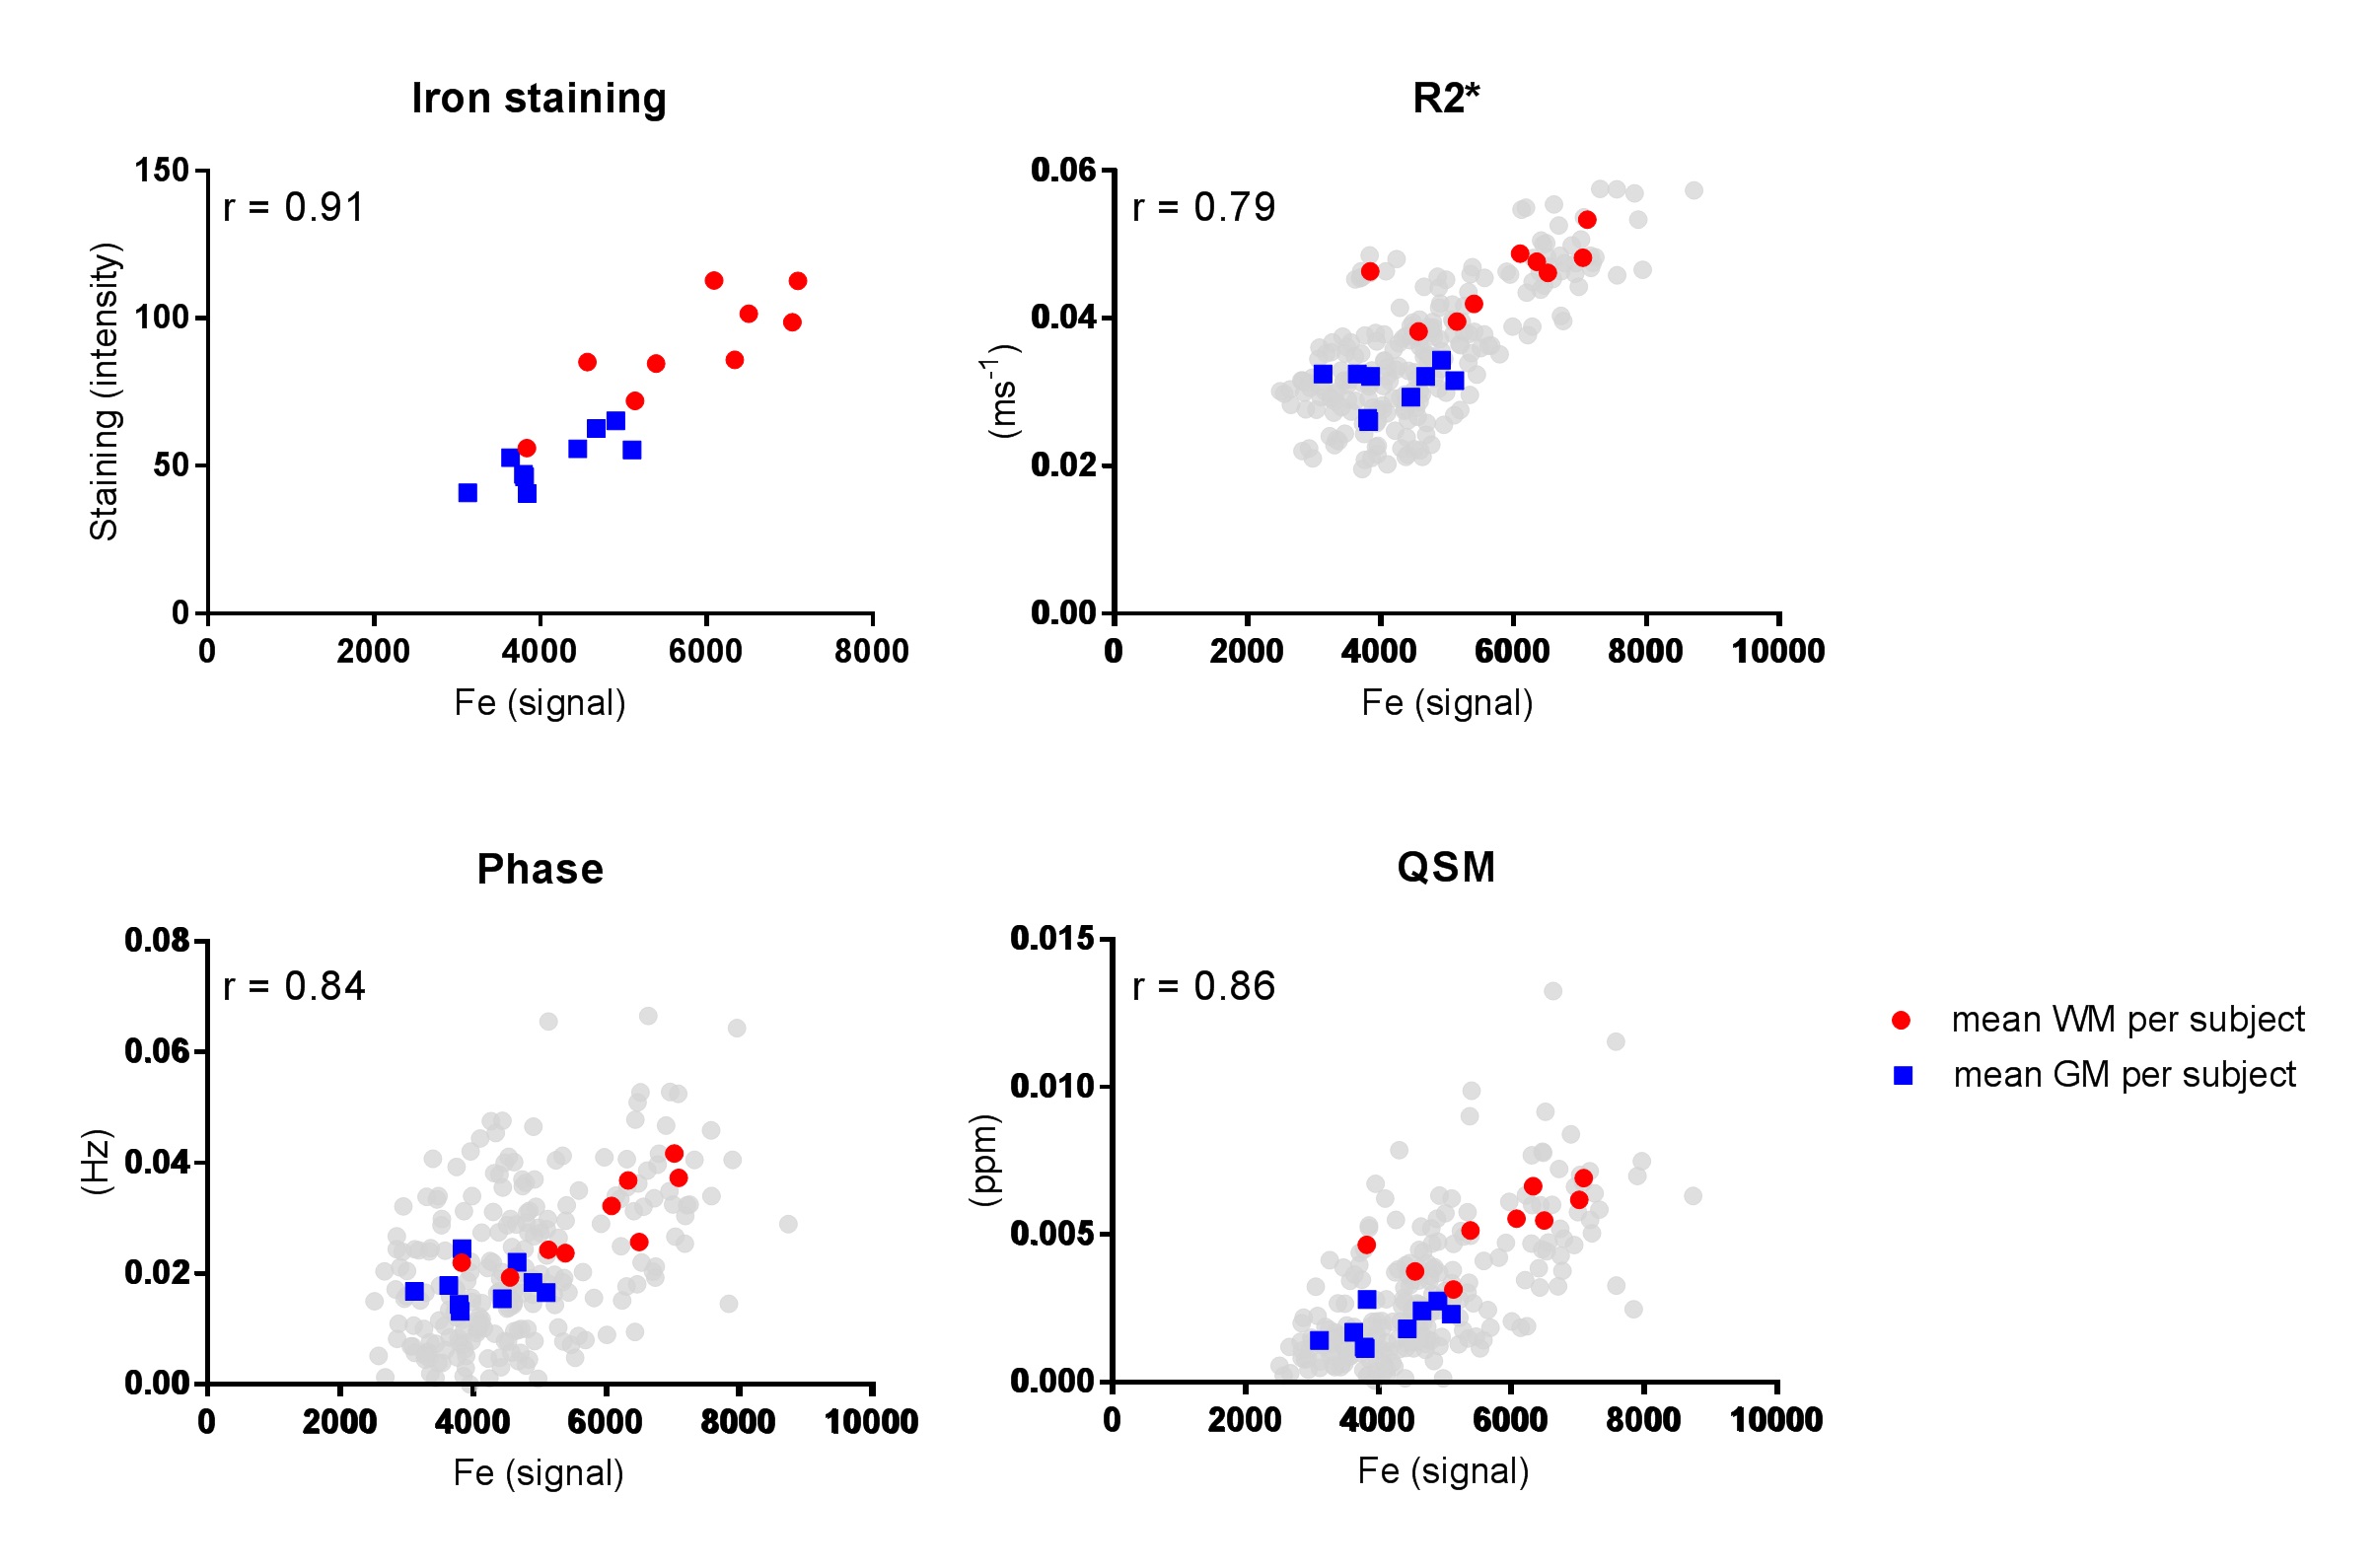
Iron measured by LA-ICP-MS showed a significant positive correlation with the histology staining intensities (Fig. 2). Significant positive correlations were also found between LA-ICP-MS and all three quantitative MRI measurements (Fig. 2, black dots). Correlation plots of mean LA-ICP-MS and mean MRI values of GM and WM per sample showed even higher significant correlations (Fig. 2, coloured dots).
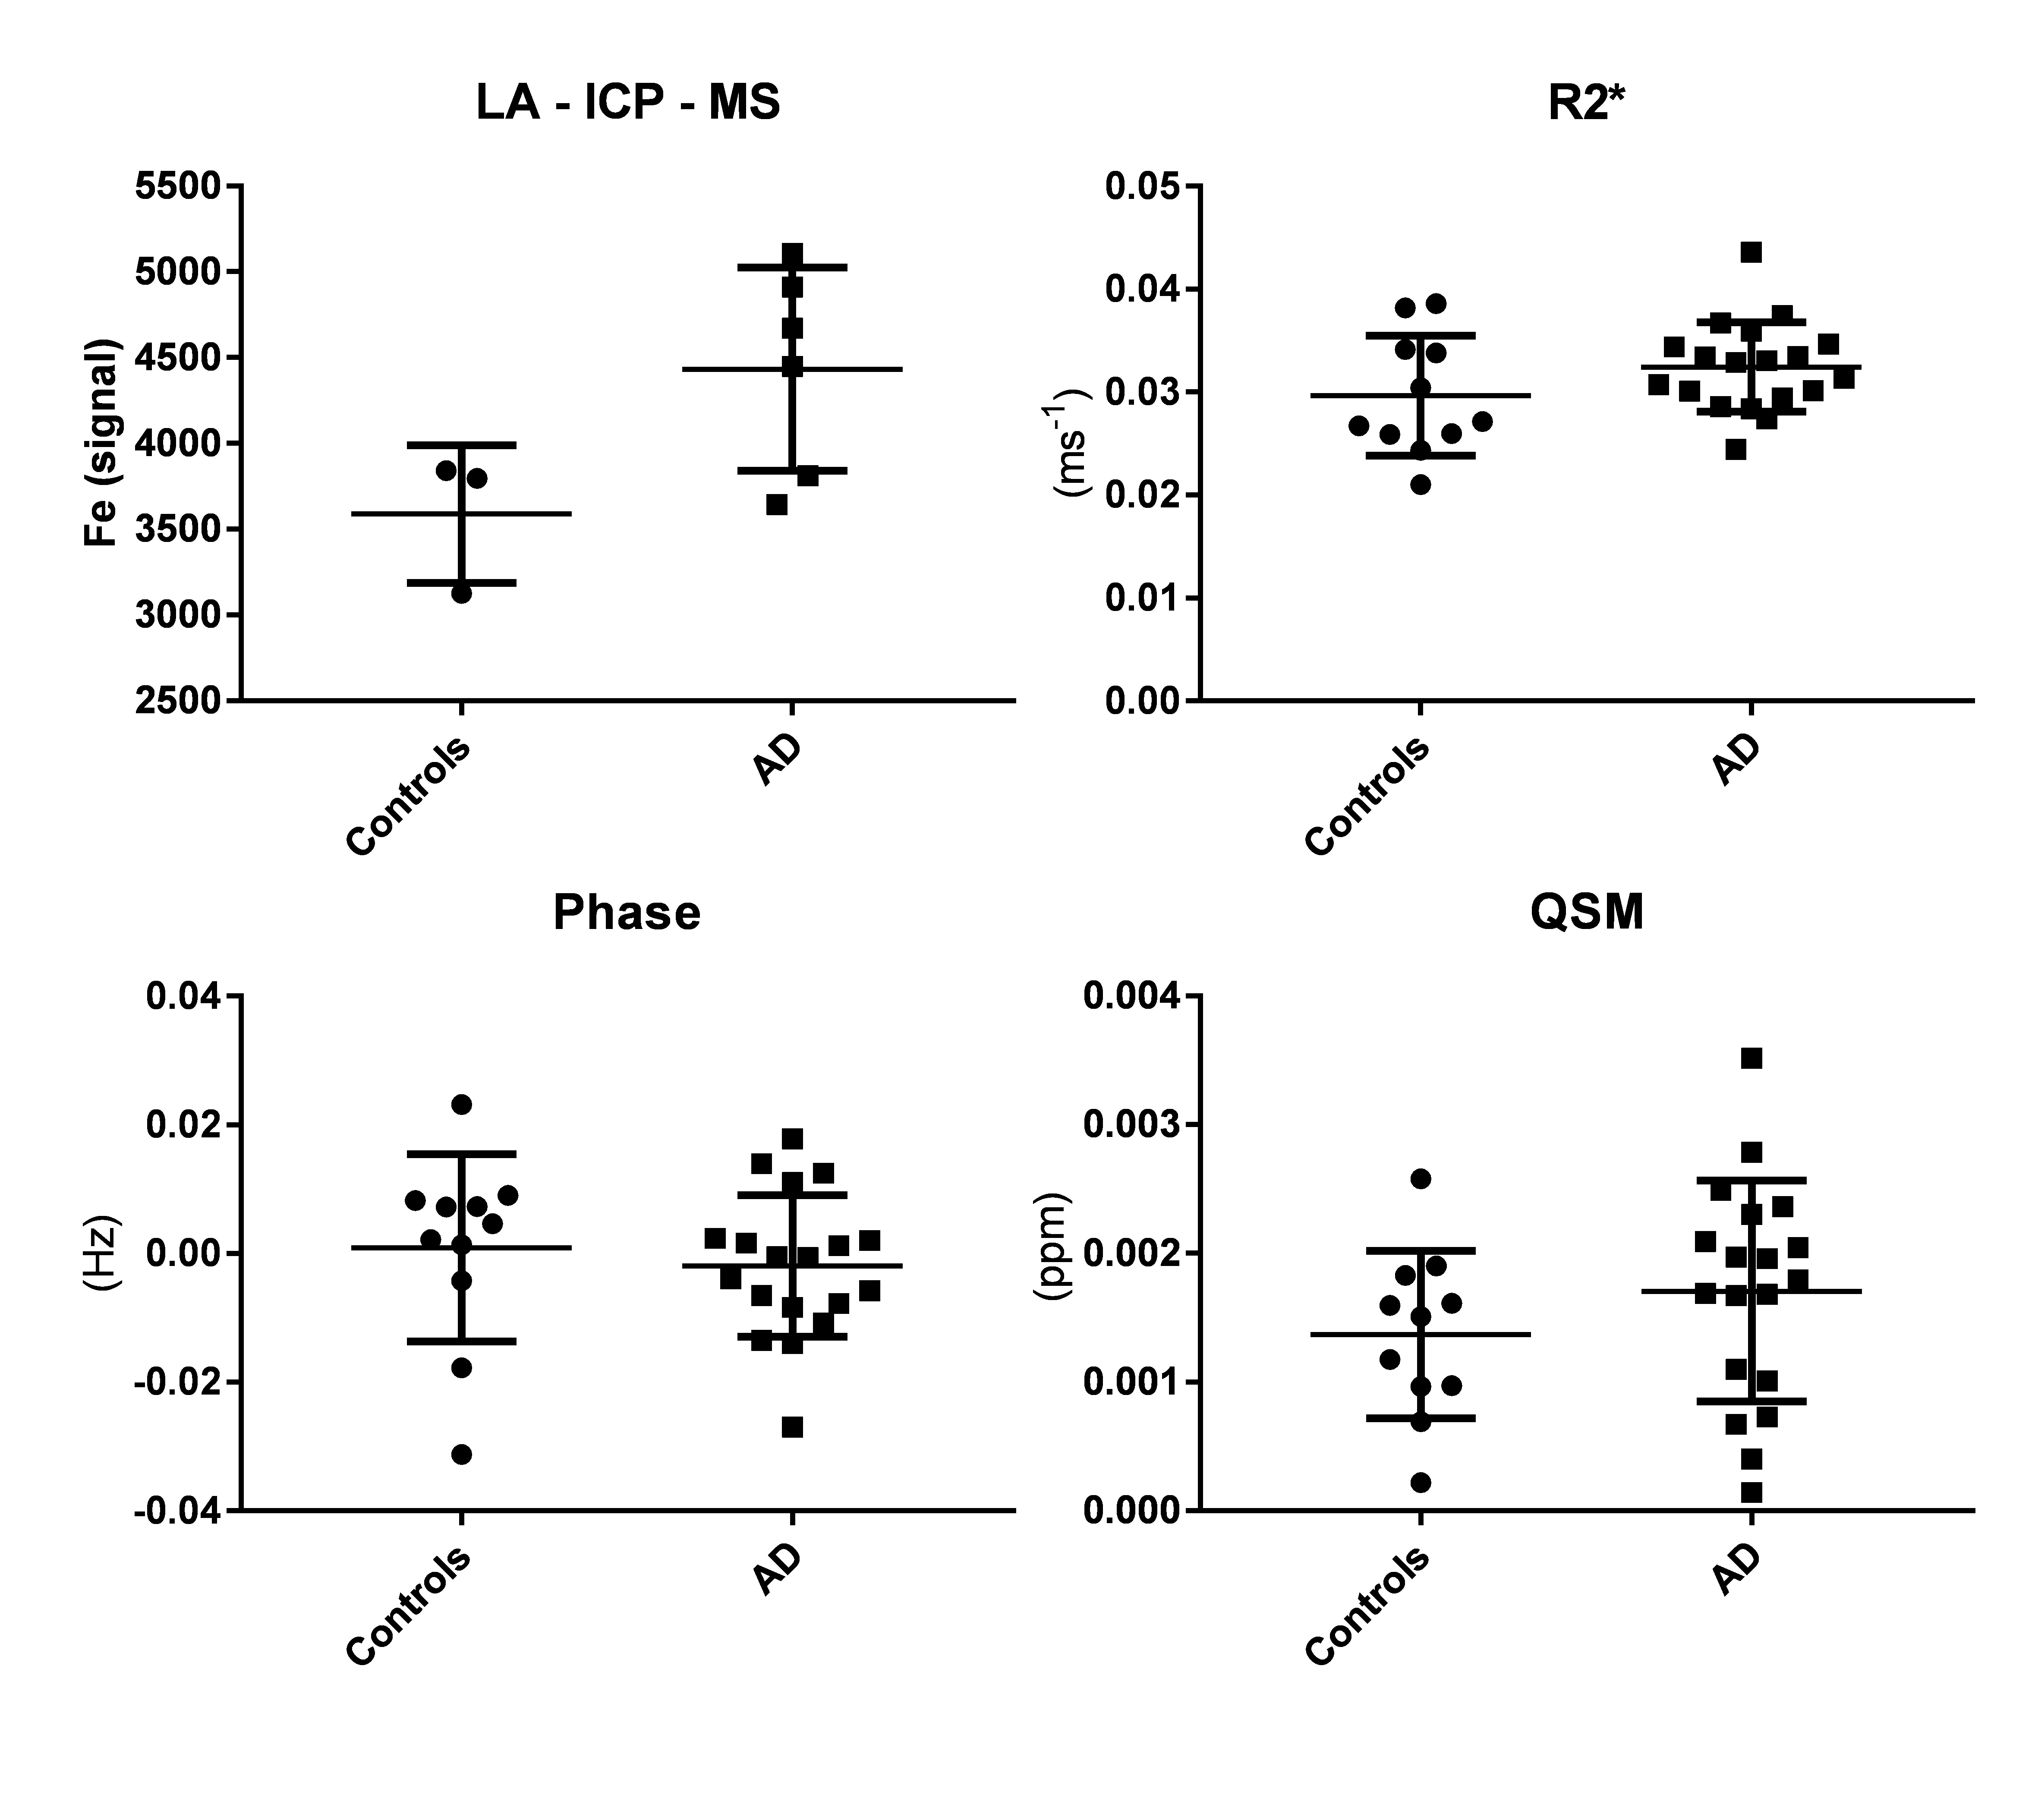
Comparison of gray matter LA-ICP-MS iron values showed a slight increase in AD patients (Fig. 3). No significant differences were found in GM R2*, phase, or QSM values between controls and AD patients.
Discussion
We found a high correlation between iron measured by LA-ICP-MS and the iron staining. This indicates that although the iron staining is a qualitative measure of iron, it is a reliable technique to visualize iron in post-mortem brain tissue. For all three MRI modalities a high correlation was found with LA-ICP-MS in both AD and controls, however the phase measurements showed a high variation. This might be caused due to the known influence of orientation with respect to the main magnetic field, which is eliminated in QSM5.
In contrast to previous studies, we did not find differences in overall iron load in the frontal cortex between controls and AD patients. Nevertheless, earlier work demonstrated that the iron distribution within the cortex is changed in AD , defined as a diffuse mid-cortical hypointense band and visible on LA-ICP-MS (this study), MRI, and histology1.
Conclusion
Based on our results R2* and QSM are reliable measures of iron content in the cortex. These results support existing MRI studies focussing on iron distributions in both healthy and diseased brain. Using highly sensitive and quantitative imaging sequences iron can be non-invasively imaged and quantified in the brain.Acknowledgements
This work was financially supported by a grant from the European Union 7th Framework Program: BrainPath (PIAPP-GA-2013–612360).References
1. Bulk, M., et al., Post-mortem MRI and histology demonstrate differential iron accumulation and cortical myelin organization in early and late onset Alzheimer's disease. Neurobiology of Aging, 2017.
2. van Rooden, S., et al., Cerebral amyloidosis: postmortem detection with human 7.0-T MR imaging system. Radiology, 2009. 253(3): p. 788-96.
3. O'Reilly, J., et al., A novel calibration strategy for the quantitative imaging of iron in biological tissues by LA-ICP-MS using matrix-matched standards and internal standardisation. Journal of Analytical Atomic Spectrometry, 2014. 29(8): p. 1378-1384.
4. Abdelmoula, W., et al, Automatic generic registration of mass spectrometry imaging data to histology using nonlinear stochastic embedding. Analytical chemistry, 2014. 86(18), p. 9204-9211.
5. Schweser, F., et al., Quantitative imaging of intrinsic magnetic tissue properties using MRI signal phase: an approach to in vivo brain iron metabolism? Neuroimage, 2011. 54(4): p. 2789-807.
Figures