4985
Atlas-based and voxel-based symptom mapping to explore anatomical substrates of functional recovery after stroke in the mouse1Department of Experimental Neurology and Center for Stroke Research Berlin, Charité – Universitätsmedizin Berlin, corporate member of Freie Universität Berlin, Humboldt-Universität zu Berlin, and Berlin Institute of Health, Berlin, Germany, 2Cluster of Excellence NeuroCure and Charité Core Facility 7T Experimental MRIs, Charité - Universitätsmedizin Berlin, Berlin, Germany, 3Institute of Pathology, Charité – Universitätsmedizin Berlin, Berlin, Germany, 4School of Life Sciences, University of Nottingham, Nottingham, United Kingdom
Synopsis
Post-stroke functional recovery remains a poorly understood process. We aimed to identify anatomical regions that statistically explain a deficit in the staircase test after stroke in the mouse using two animal models (MCAO, photothrombosis). MATLAB toolboxes are presented for co-registration of MRI and histology data to the Allen brain atlas and implementation of atlas region-wise or voxel-wise mapping of behavioral deficits. Automatic techniques are shown for validation of MRI results on stained tissue sections.
Introduction
Post-stroke functional recovery remains a poorly understood process. Here, we introduce techniques adapted from voxel-based lesion symptom mapping1 in order to identify anatomical regions whose damage statistically explain a functional deficit and thus would be of highest interest for a targeted therapeutic intervention. To this end, we present custom MATLAB toolboxes for Allen atlas registration of MRI and histology data allowing brain region-based and voxel-based correlation of behavioral deficits to tissue damage after stroke in the mouse.Methods
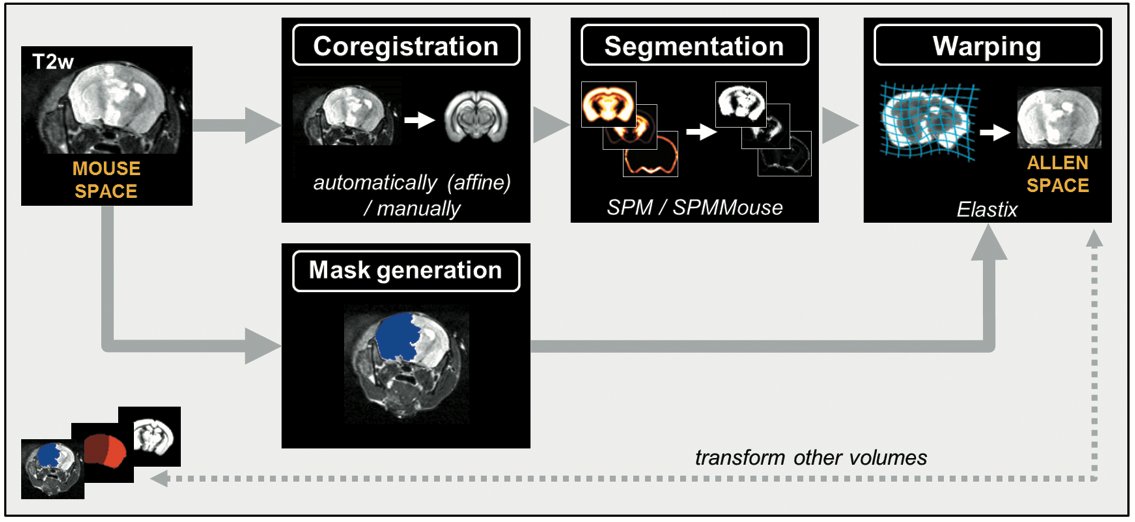
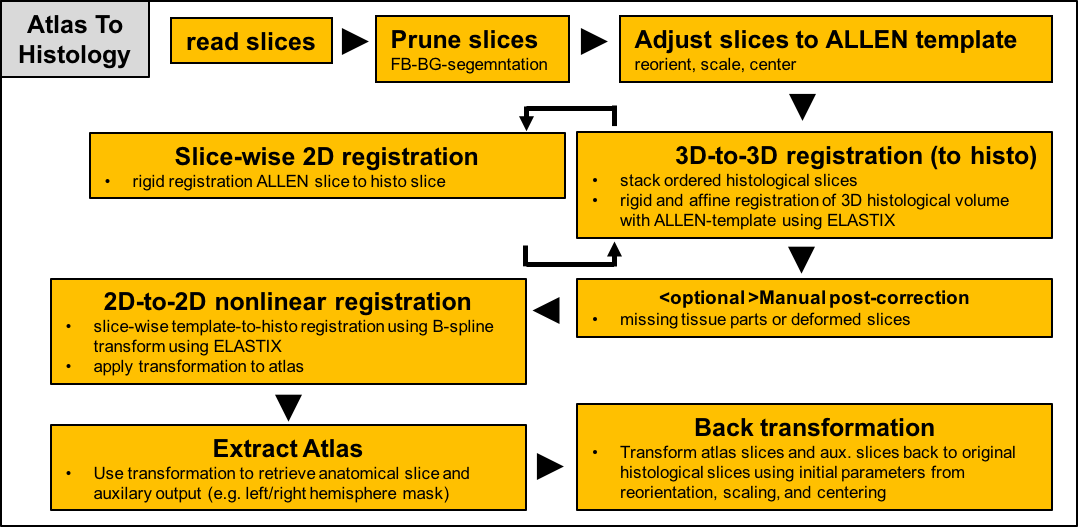
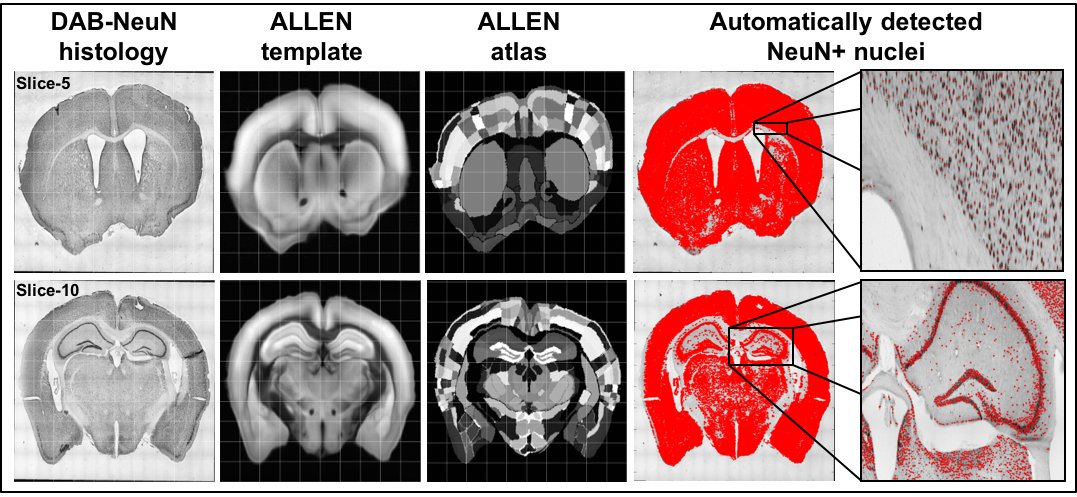
C57/Bl6 mice (n=60) were trained in the staircase test2 and randomized to undergo either 45 min middle cerebral artery occlusion (MCAO, final n=17), sham surgery (n=17) or photothrombosis (PT, n=9). n=13 (MCAO) died before endpoint, n=1 (MCAO) did not learn the task, and n=1/1 (MCAO/PT) did not have a lesion. Experiments and analysis were performed blinded to the condition of animals. 24 h after surgery, animals underwent T2-weighted (T2w) MRI (RARE, 32 contiguous 0.5 mm thick slices, FOV=(25.6 mm)2, matrix=256x196 zerofilled to 2562, TR/TEeff=4.2 s/36 ms, RARE factor 4,4 averages, TA=6:43 min) at 7 T (Bruker BioSpin, Ettlingen, Germany) using a 20 mm diameter Tx/Rx volume resonator coil (RAPID, Rimpar, Germany). A lesion mask was drawn by an experienced researcher and images+masks were warped to the Allen-Brain-Atlas using our publicly available MATLAB toolbox ANTX3 (Fig. 1). We correlated the degree of initial deficit (mean performance 2-6 d post surgery) i) region-wise with percent lesion volume in atlas regions or ii) voxel-wise with image intensity in the warped T2w image. 21 d post surgery, animals were sacrificed for histological validation. We performed DAB-enhanced NeuN staining on 20 µm thick slices (400 µm slice distance), center of mass of NeuN nuclei were automatically identified using Cell Profiler (http://cellprofiler.org/), and corresponding slices of the Allen brain atlas were automatically determined and registered to each histological slice using a custom ELASTIX-based (http://elastix.isi.uu.nl/) MATLAB toolbox (Fig. 2).Results
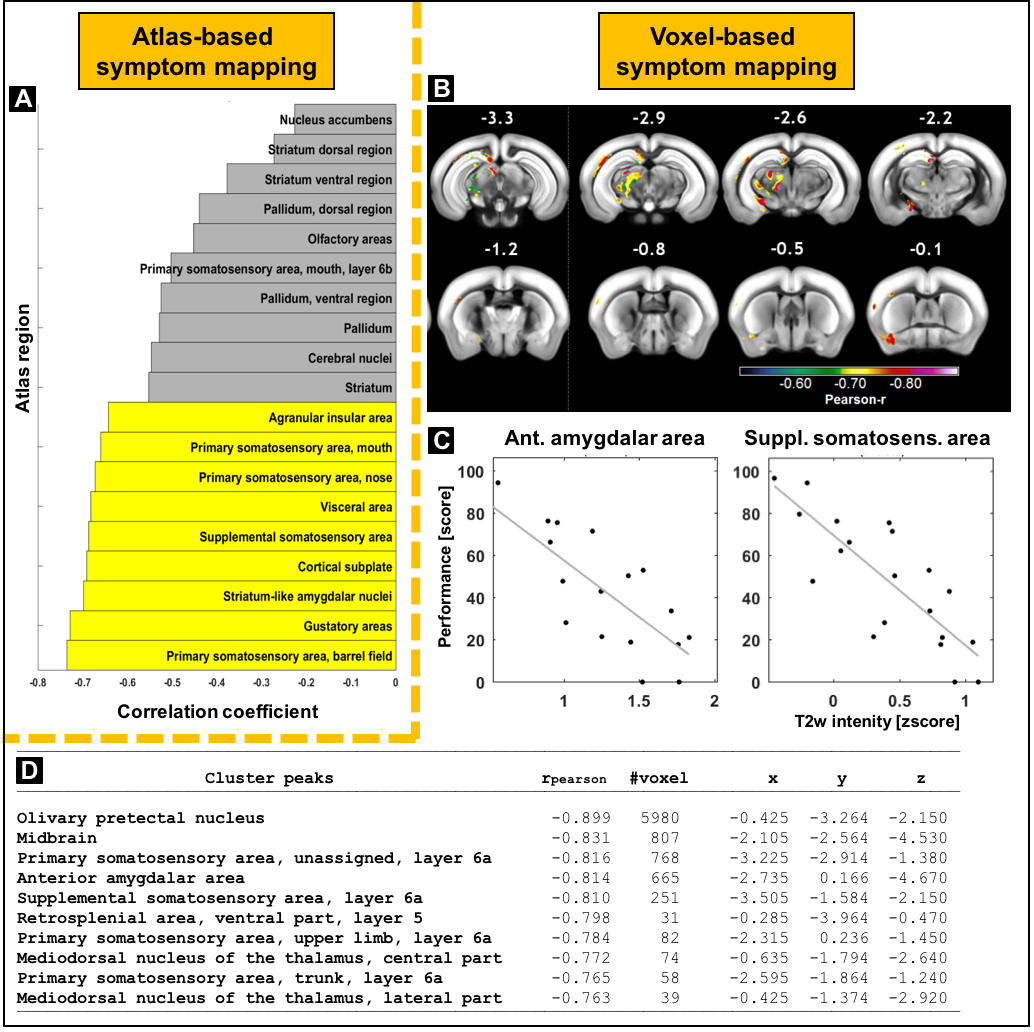
MCAO animals had the largest difference in performance in the staircase test compared to shams (mean difference: 41.2%, (30.7-51.7%), p<0.001) whereas the deficit was smaller for PT animals (mean difference: 19.9% (6.8-33.0%), p=0.0049). We found a trivial correlation of initial deficit and total stroke volume on T2w images at 24 h (R=0.73). However, region-based and voxel-based symptom mapping revealed similarly high correlation in very specific areas involved in somatosensory and fear processing. Damage in more caudal structures (e.g. thalamus and midbrain) also correlated well with the deficit (Fig. 4).Discussion
We developed a set of fully automated tools for data-driven analysis of anatomical substrates of functional recovery after stroke in the mouse. From the fact that lesions in MCAO animals are mainly subcortical and these animals performed worse than PT animals (primarily cortical damage), we conclude that the subcortex is important to perform well in a behavioral test of somatosensory and motor function. Region-based and voxel-based symptom mapping was used to explore and quantify the importance of anatomical lesion location, a comprehensive validation of these findings through correlation with neuronal cell densities is work in progress but the necessary tools have been established. One limitation of our study is the exclusion of animals that underwent MRI but died before the final endpoint, a systematic strategy to statistically deal with this cohort is work in progress. Another limitation is that correlation of a behavioral deficit with damage, e.g. in more caudal brain regions, may simply be due to effects related to overall lesion volume and not to loss of the specific function of the region. Therefore, in order to gain a more mechanistic insight, we aim to target most prominent candidates with pharmacogenetic excitation/inhibition in future studies.Conclusion
Atlas-based and voxel-based symptom mapping in the mouse is a powerful tool to explore mechanisms of functional recovery after stroke.Acknowledgements
Work was supported by the Federal Ministry of Education and Research (BMBF) (grant number 01EO0801, Center for Stroke Research Berlin) and Deutsche Forschungsgemeinschaft (DFG) (Excellence Cluster NeuroCure).References
1 Bates E, Wilson SM, Saygin AP, Dick F, Sereno MI, Knight RT et al. Voxel-based lesion-symptom mapping. Nat Neurosci 2003; 6: 448–50.
2 Emmrich J V, Neher JJ, Boehm-Sturm P, Endres M, Dirnagl U, Harms C. Stage 1 Registered Report: Effect of deficient phagocytosis on neuronal survival and neurological outcome after temporary middle cerebral artery occlusion (tMCAo) [version 1; referees: 2 approved]. F1000Research 2017; 6. doi:10.12688/f1000research.12537.1.
3 Koch S, Mueller S, Foddis M, Bienert T, von Elverfeldt D, Knab F et al. Atlas registration for edema-corrected MRI lesion volume in mouse stroke models. J Cereb Blood Flow Metab 2017; : 0271678X1772663. https://github.com/philippboehmsturm/antx
Figures