4984
Protein Aggregation in Mouse Brain with Alzheimer's Disease Revealed by Saturation Transfer MRI1Department of Electronic Science, Xiamen University, Xiamen, China, 2F.M. Kirby Research Center for Functional Brain Imaging, Kennedy Krieger Research Institute, Baltimore, MD, United States, 3Department of Radiology and Radiological Science, Johns Hopkins University, Baltimore, MD, United States, 4Department of Mechanical and Biomedical Engineering, City University of Hong Kong, Hong Kong, China, 5Department of Pathology, Johns Hopkins University, Baltimore, MD, United States
Synopsis
This study aims to detect the aggregated proteins involved in Alzheimer's Disease (AD) using chemical exchange saturation transfer (CEST) as a potential strategy for early diagnosis of the disease. A radial ultra-short echo time (UTE) image acquisition scheme was applied to map CEST signals with sufficient sensitivity and robustness to motion. Studies on cross-linked bovine serum albumin (BSA) and an AD transgenic model (mutant APP/PS1 mouse) demonstrated that the saturation transfer (ST) signal at -3.6 ppm, which is a combination of relayed nuclear Overhauser enhancement (rNOE)-CEST and a small portion of magnetization transfer contrast (MTC), can be used a potential biomarker for monitoring changes in brains of a mouse model of AD.
Introduction
The accumulation of neuritic plaques comprised of amyloid-beta (Aβ) peptides (1, 2) and neurofibrillary tangles (NFT) of hyperphosphorylated tau (3-6) are the major histopathological hallmarks of AD. Therefore, strategies to detect misfolded proteins involved in AD in living individuals hold promise for the early diagnosis of this disease. The line-shape of the saturation transfer (ST) spectrum (Z-spectrum) of water is sensitive to the molecular size of proteins (spectral broadening with increasing protein size) (7, 8). However, the signal contributions to the Z-spectrum from mobile proteins and lipids are only a few percent of the water signal, and can be easily degraded by the movement introduced by respiratory and cardiac motions. To overcome these limitations, an ultra-short echo time (UTE) based saturation transfer MRI scheme was used to map the Z-spectrum with sufficient sensitivity and robustness to motions. In addition, interfering contributions from semi-solid magnetization transfer contrast (MTC) and water direct saturation (DS) have to be minimized.Methods
The CEST-UTE sequence contains a frequency-selective Gaussian pulse followed by a UTE-based readout using radial acquisition (Fig. 1A). The saturation module is similar to the steady-state pulsed CEST technique (9, 10). Motion artifacts are minimized due to several features: (i) Each spoke of the radial acquisition starts from the center of k-space and traverses radially outward, which results in over-sampling in the k space center; (ii) The short echo time used by UTE sequence can suppress image artifacts introduced by susceptibility differences; and (iii) The self-gating ability of radial acquisition (11, 12). The phase information of the center of k-space was used as navigation to detect any data degraded by bulk motion (Fig. 1B), which will be discarded to further reduce motion artifacts. In order to improve the signal-to-noise ratio of mobile protein signal contributions, the Z-spectral signals at ±3.6 ppm were repeatedly acquired using a dynamic on/off scheme similar to fMRI studies, generating a train of labeled images at ±3.6 ppm interleaved with a train of control images (Fig. 1C). The low-frequency drift in the time series data was corrected using a low-frequency filter (13). Using low B1, MTC and DS contributions to the ST(3.6 ppm) and ST(-3.6 ppm) can be greatly reduced by subtracting the images recorded at ±3.6 ppm from those at 8 ppm, respectively.
Four APPswe;PS1ΔE9 mice (14) (APP mice, 12 months) and four C57BL/6J mice (WT mice, 12 months) were used. To mimic the protein aggregation, BSA solutions were cross-linked using the heat shock (HS) strategy at different temperatures (60°C, 65°C, 70°C and 80°C). MRI experiments were performed on a horizontal bore 11.7 T Bruker Biospec system. A 72mm volume resonator and 2×2 phased array coil was used for animal MRI, and a 23 mm volume coil for phantom studies.
Results and Discussion
The Z-spectra of the native and HS-cross-linked BSA phantoms acquired using the UTE-CEST sequence are shown in Fig. 2. The line-shape of the Z-spectra were broadened significantly after cross-linking (Fig. 2A), which led to reduced amide proton transfer (APT) and rNOE-CEST effects at 3.6 ppm and -3.6 ppm, respectively, and thus reduced ST values at these frequencies (Figs. 2B, C). The degree of cross-linked protein increased with temperature, leading to reduced ST(±3.6 ppm) values as demonstrated in Fig. 2D, indicating that ST(±3.6 ppm) are sensitive to the protein aggregation and might be used as an imaging biomarker. Fig. 3 shows the full Z-spectra of different brain regions in a WT mouse using UTE-CEST with offsets from -15 ppm to 15 ppm. With a low saturation power of 0.9 μT, the MTC can be approximately regarded as constant in the region of -8 to 8 ppm, and the DS can be filtered out (Fig. 3B).Therefore, we used 8 ppm image as the reference image to remove the MTC and DS effect from the resultant ST images. The ST(±3.6 ppm) maps of WT mice (Fig. 4A, C) show overall higher values than those of APP mice (Fig. 4B, D). The regional differences for the ST values between APP and WT mice are plotted in Fig. 5. The ST(-3.6 ppm) values were markedly different in the three brain regions with the highest ST(-3.6 ppm) values in the striatum (8-11%) and the lowest values (4-8%) in the cortex. Importantly, the ST(-3.6 ppm) from APP mice were significantly lower than the corresponding values from WT mice (Fig. 5), but no significant difference was found between their ST(3.6ppm) values.
Conclusion
The ST(-3.6 ppm) signal have potential as an imaging biomarker for monitoring misfolded proteins in brains of a mouse model of AD.Acknowledgements
This work was supported by NIH R01EB015032, P41EB015909 and R01EB019934.References
1. Hardy J, Selkoe DJ. The amyloid hypothesis of Alzheimer's disease: progress and problems on the road to therapeutics. Science. 2002; 297(5580):353-6. doi:10.1126/science.1072994
2. Selkoe D, Kopan R. Notch and Presenilin: regulated intramembrane proteolysis links development and degeneration. Annu Rev Neurosci. 2003; 26:565-97. doi:10.1146/annurev.neuro.26.041002.131334
3. Rojas JC, Boxer AL. Neurodegenerative disease in 2015: Targeting tauopathies for therapeutic translation. Nat Rev Neurol. 2016; 12(2):74-6. doi:10.1038/nrneurol.2016.5
4. Lee VM, Trojanowski JQ. Neurodegenerative tauopathies: human disease and transgenic mouse models. Neuron. 1999; 24(3):507-10.
5. Ballatore C, Lee VM, Trojanowski JQ. Tau-mediated neurodegeneration in Alzheimer's disease and related disorders. Nat Rev Neurosci. 2007; 8(9):663-72. doi:10.1038/nrn2194
6. Li T, Braunstein KE, Zhang J, et al. The neuritic plaque facilitates pathological conversion of tau in an Alzheimer's disease mouse model. Nat Commun. 2016; 7:12082. doi:10.1038/ncomms12082
7. Goerke S, Milde KS, Bukowiecki R, et al. Aggregation-induced changes in the chemical exchange saturation transfer (CEST) signals of proteins. NMR Biomed. 2016. doi:10.1002/nbm.3665
8. Goerke S, Zaiss M, Kunz P, et al. Signature of protein unfolding in chemical exchange saturation transfer imaging. NMR Biomed. 2015; 28(7):906-13. doi:10.1002/nbm.3317
9. Jones CK, Huang A, Xu J, et al. Nuclear Overhauser enhancement (NOE) imaging in the human brain at 7T. NeuroImage. 2013; 77C:114-24. doi:10.1016/j.neuroimage.2013.03.047
10. Dixon WT, Hancu I, Ratnakar SJ, et al. A multislice gradient echo pulse sequence for CEST imaging. Magn Reson Med. 2009:NA-NA. doi:10.1002/mrm.22193
11. Larson AC, White RD, Laub G, et al. Self-gated cardiac cine MRI. Magn. Reson. Med. 2004; 51(1):93-102. doi:10.1002/mrm.10664
12. Yang HJ, Sharif B, Pang J, et al. Free-breathing, motion-corrected, highly efficient whole heart T2 mapping at 3T with hybrid radial-cartesian trajectory. Magn. Reson. Med. 2016; 75(1):126-36. doi:10.1002/mrm.25576
13. Smith AM, Lewis BK, Ruttimann UE, et al. Investigation of low frequency drift in fMRI signal. NeuroImage. 1999; 9(5):526-33.
14. Jankowsky JL, Xu G, Fromholt D, et al. Environmental enrichment exacerbates amyloid plaque formation in a transgenic mouse model of Alzheimer disease. J Neuropathol Exp Neurol. 2003; 62(12):1220-7.
15. Fessler JA, Sutton BP. Nonuniform fast Fourier transforms using min-max interpolation. IEEE Transactions on Signal Processing. 2003; 51(2):560-74. doi:10.1109/TSP.2002.807005
Figures
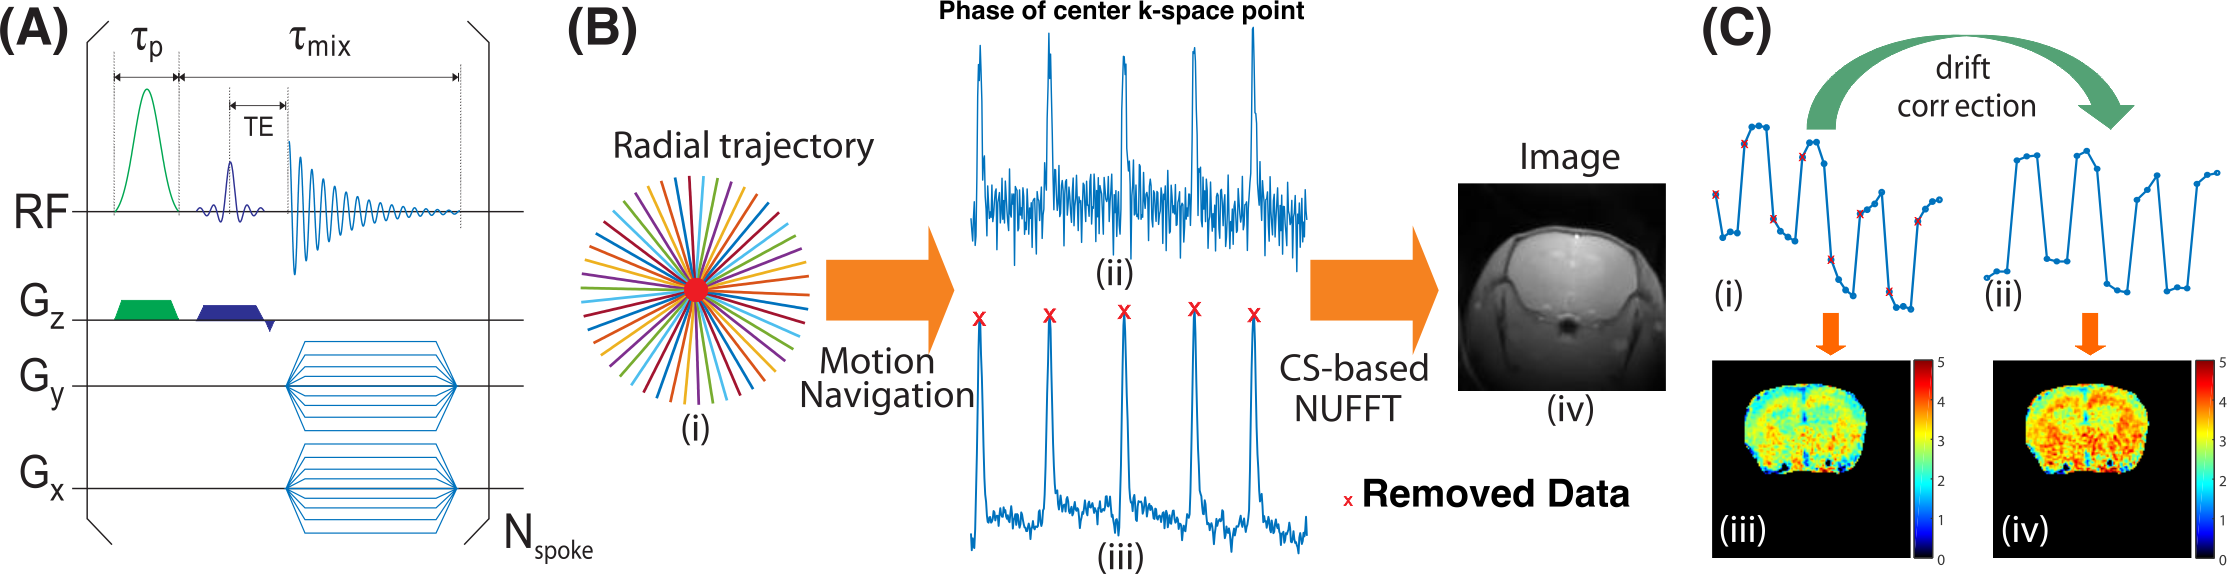
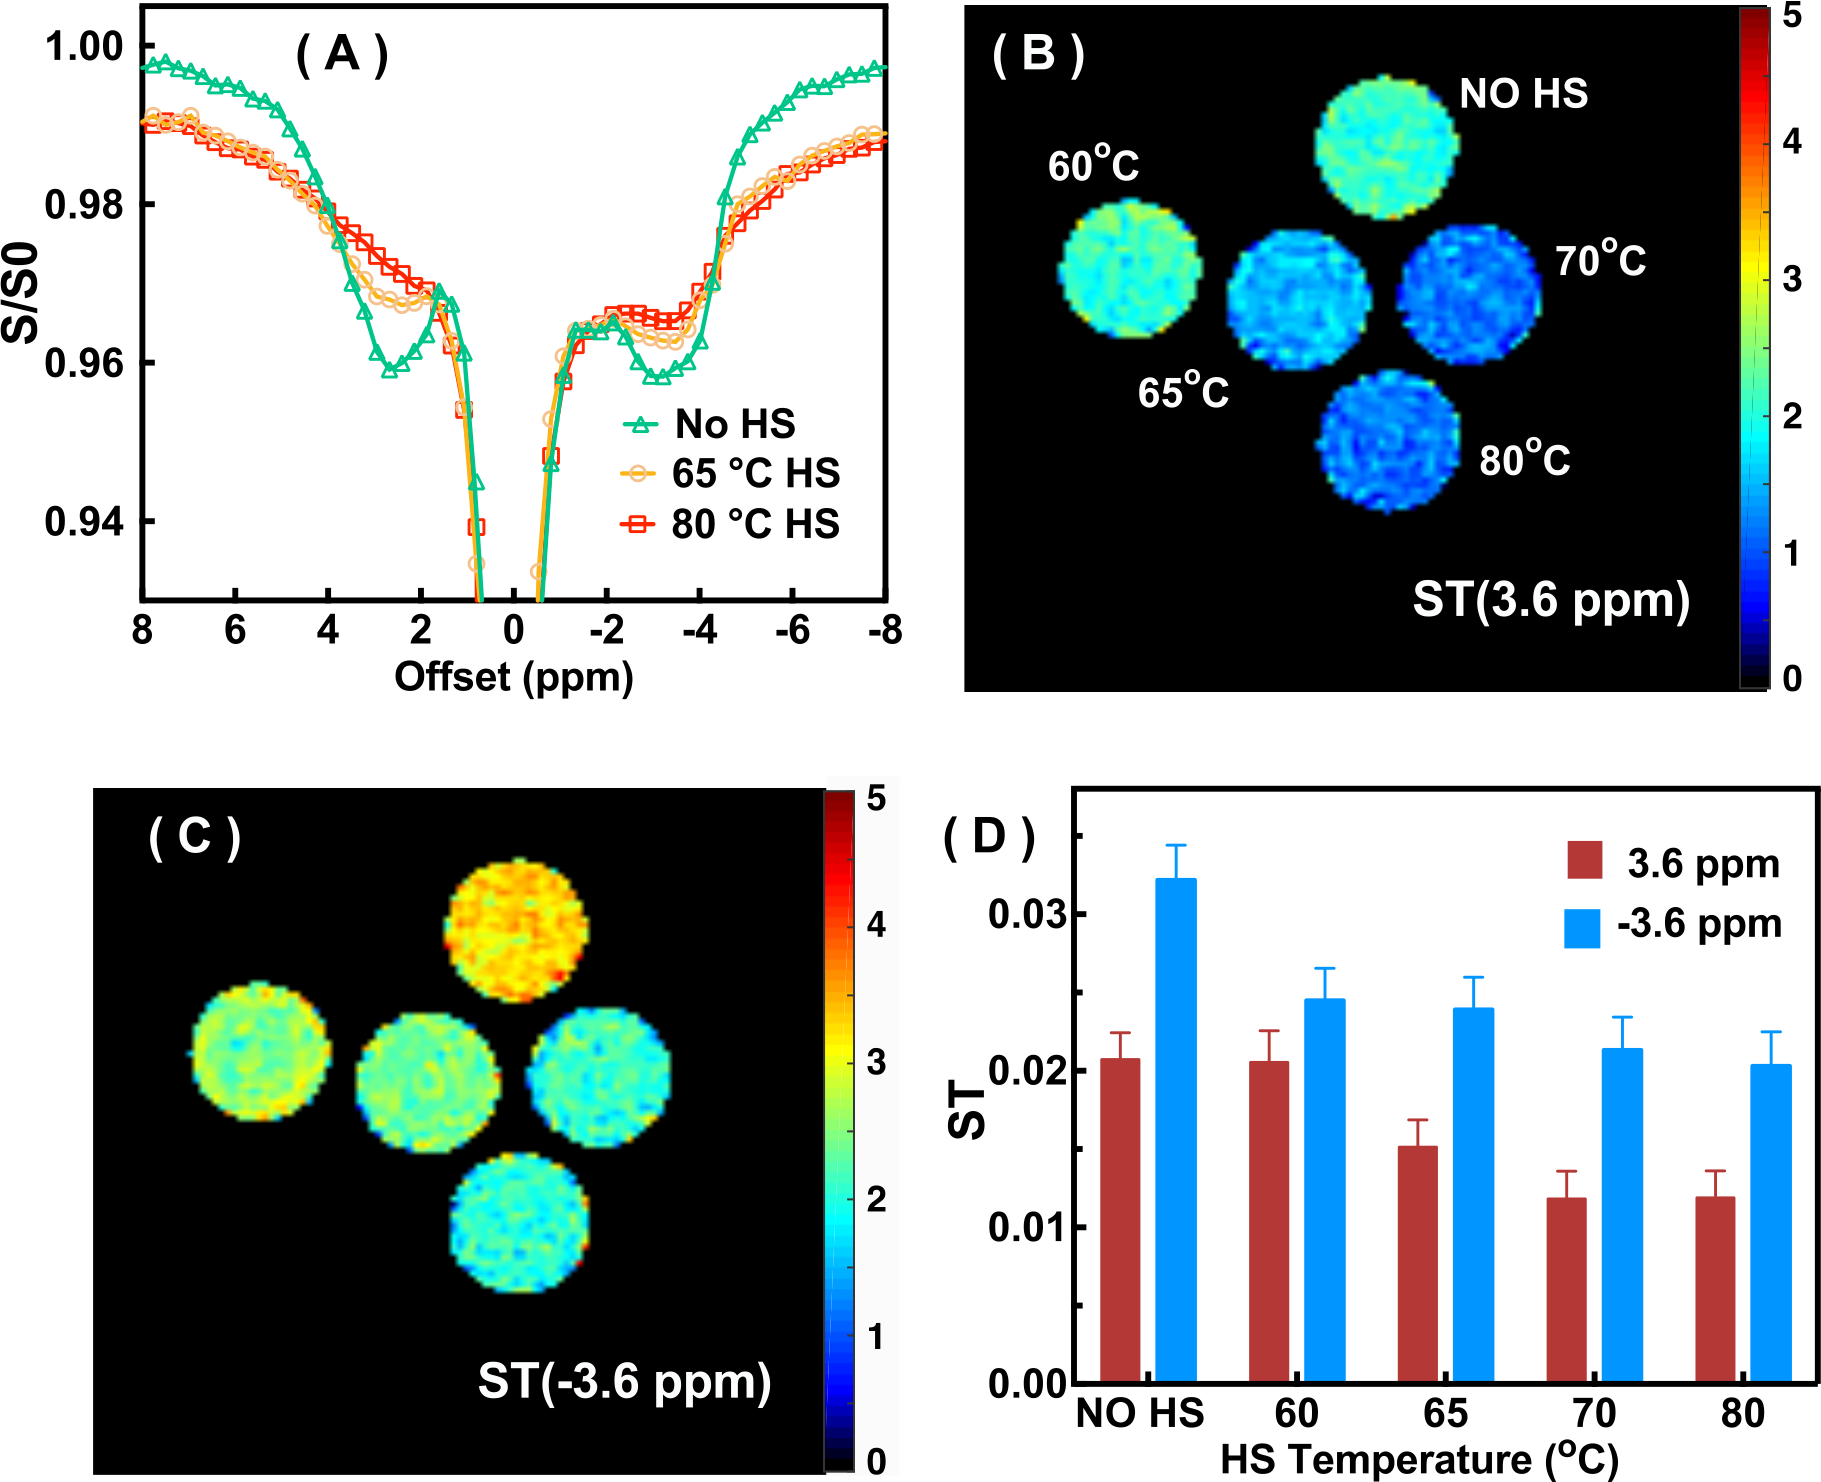
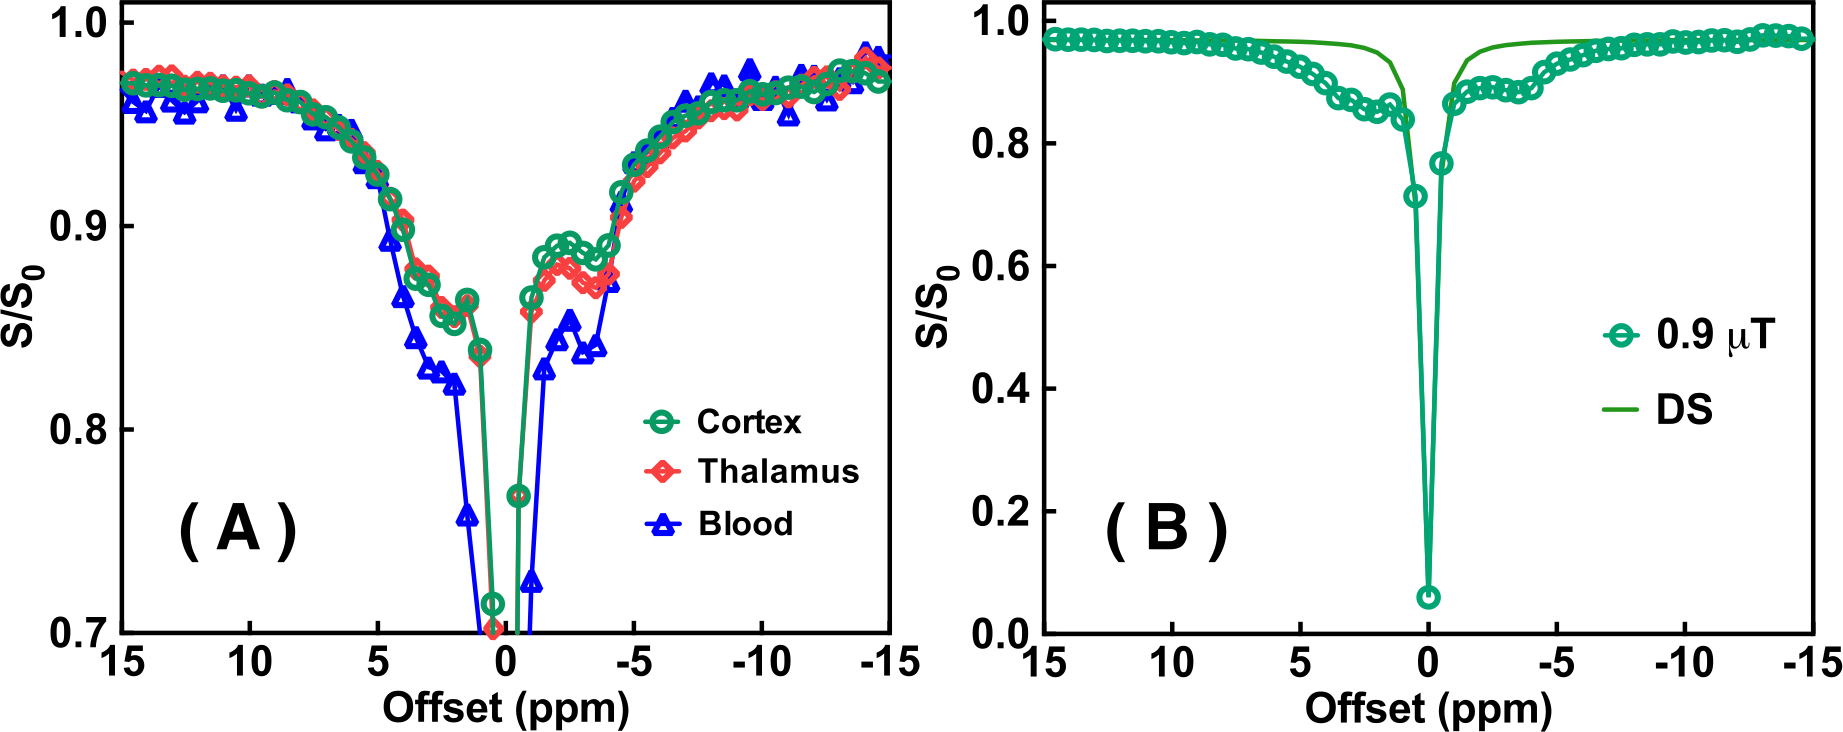
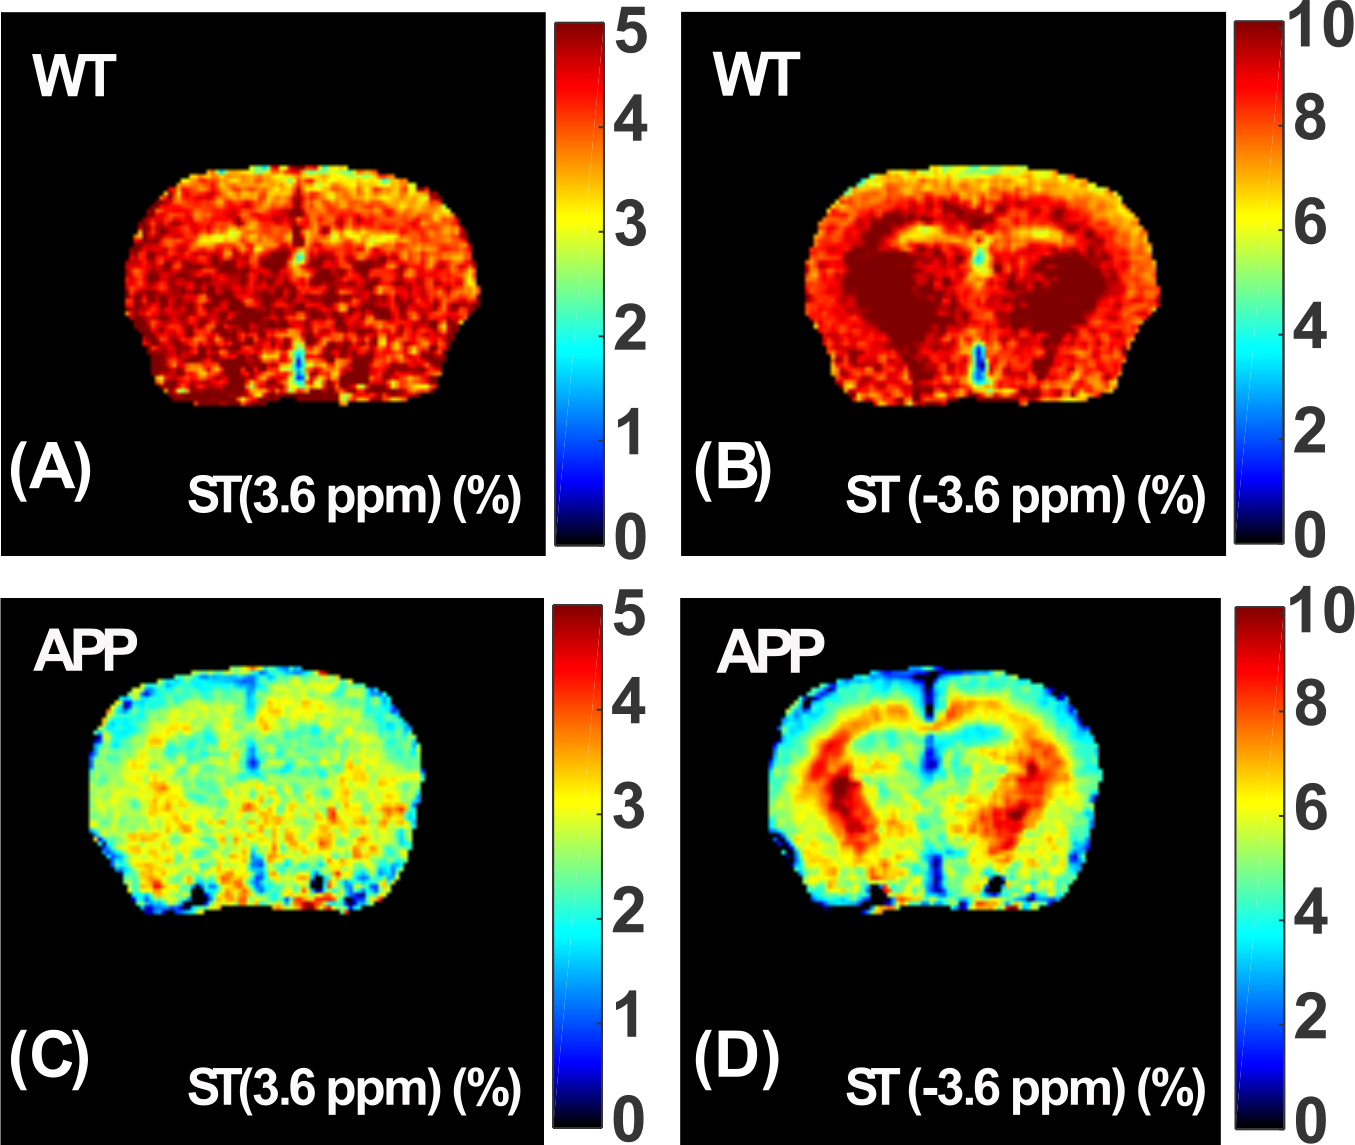

Figure 5. The comparison of ST(±3.6 ppm) between WT and APP mice. The cortex (cx) and striatum (str) are selected.The average ST(3.6 ppm) were 3.8±0.7% (cx) and 4.3±0.8% (str) for the WT mice, while they were 3.1±1% (cx) and 3.7±1% (str) for the APP mouse. The ST(3.6 ppm) for the APP mice were slightly lower than those of WT mice (p=0.3-0.4) with higher variation among subjects. The average ST(-3.6 ppm) were significantly different for the APP and WT mice (p=0.001-0.002). The averaged values are 7.07±0.5% (cx) and 10.19±0.6% (str) for the WT mice, while they are 5.05±0.4% (cx) and 8.75±0.5% (str) for the APP mouse.