4983
Diffusion Basis Spectrum Imaging (DBSI): Successful in vivo Use to Assess Axonal Protection in Mouse Optic Neuritis treated with Fingolimod1Radiology, Washington University School of Medicine, St Louis, MO, United States, 2Radiology, Guangzhou Medical University, Guangzhou, China, 3Radiology, The First Affiliated Hospital of Nanchang University, Nanchang, China, 4Biomedical Engineering, Washington Univerisyt is St. Louis, St Louis, MO, United States, 5Biostatistics, Washington University School of Medicine, St Louis, MO, United States, 6Neurology, Washington University School of Medicine, St Louis, MO, United States, 7Hope Center for Neurological Disorders, Washington University School of Medicine, St Louis, MO, United States
Synopsis
We previously introduced diffusion basis spectrum imaging (DBSI) to noninvasively assess coexisting pathologies in central nervous system (CNS) tissues.Previously, we showed in multiple sclerosis (MS) spinal cord specimens and mice with experimental autoimmune encephalomyelitis (EAE), the main animal model of MS, that DBSI reflected coexisting white matter pathologies in CNS. Fingolimod, a disease-modifying treatment approved for relapsing MS, is thought to preserve axons. In the current study, we employed longitudinal DBSI to noninvasively assess fingolimod treatment efficacy in EAE mouse optic nerve, followed by histological validation.
Introduction
Previously, we
introduced diffusion basis spectrum imaging (DBSI)1 and used it to successfully and noninvasively
assess coexisting pathologies in multiple sclerosis (MS) spinal cord specimens2 and experimental autoimmune
encephalomyelitis (EAE)3 mice, the main animal model of MS. Our
prior data supported the ability of DBSI to reflect central nervous system
(CNS) pathology. Moreover, we previously employed DBSI and post-DBSI histology
to document an early axonal loss, which is correlated with irreversible visual
impairment, at the onset of optic neuritis in EAE-affected mice.3 Fingolimod, an approved disease-modifying treatment
for relapsing MS, is believed to preserve axons in relapsing MS.4 In the current study, we employed longitudinal
DBSI to noninvasively assess the efficacy of fingolimod in optic nerves of EAE-affected
mice, with concurrent optic neuritis (ON), followed by histological validation.
Materials and Methods
Animal model: EAE was induced with an emulsion of MOG35-55 peptide in incomplete Freund's adjuvant in 17 female C57BL/6 mice. After immunization, daily clinical score (CS) and body weight were assessed. Visual Acuity (VA) & treatment strategy: VA was assessed daily after immunization. When VA ≤ 0.25 cycle/degree (defining onset ON)3, EAE mice were treated with saline (n=9) or fingolimod (n=8) in parallel by oral gavage for three months beginning at onset of ON (Fig. 1A). DBSI: A pair of active-decoupled volume and surface coils were used. A 25-direction diffusion-weighted imaging (DWI) was performed at baseline (naïve, before immunization), one, two, and three months after treatment on a 4.7-T Agilent small-animal MR scanner utilizing a multiple-echo spin-echo diffusion-weighted sequence.5 All images were obtained with the following acquisition parameters: TR = 1.5 s, TE = 35 ms, inter-echo delay = 20.7 ms, Δ = 18 ms, δ = 6 ms, maximal b-value = 2,200 s/mm2, with the same FOV = 22.5 × 22.5 mm2, slice thickness = 0.8 mm, and matrix size = 192 × 192 (before zero-filling). Data analysis: A lab-developed DBSI code was performed on DWI data to estimate DBSI derived λǁ, λ┴, restricted (putative cellularity) and non-restricted isotropic (putative edema) diffusion tensor fractions. Histology: mice were perfusion-fixed immediately after the last in vivo MR measurements for immunohistochemistry (IHC) staining of SMI-312, MBP, SMI-31, and DAPI. Statistics: For all the box plots, degrees of freedom were adjusted with Kenward-Rogers method. The associations of histology data with DBSI metrics were analyzed by mixed random effects regression with correlation calculated as the mean of Pearson correlations on left and right sides.Results
Worse VA was
seen in the saline (placebo) group (Fig. 1B), indicating more severe optic
nerve damage than in the fingolimod-treated group. Using DBSI, less non-restricted and restricted
isotropic fractions were seen in optic nerves of the fingolimod group than
saline group (Fig. 2), indicating anti-inflammatory effects of fingolimod. Axonal
volume (Fig. 3 D) was derived by multiplying fiber fraction (Fig. 3 B) by nerve
volume (Fig. 3 C). Significantly reduced DBSI-derived axonal volume was seen in
some saline-treated optic nerves but not in fingolimod-treated group (Fig. 3 D),
suggesting axonal preservation with fingolimod. At months 2 and 3, increased λ⊥ was seen using DBSI in saline-treated optic nerves,
suggesting more demyelination in the saline-treated than fingolimod-treated group
(Fig. 4). Regarding
fingolimod-treated group, significant decreased λǁ and increased λ⊥ were only shown one month after treatment,
suggesting axonal prevention (Fig. 4). Comparing
to fingolimod-treated optic nerves, the IHC results revealed axonal loss (reduced
SMI-312 intensity, Fig.5 A) demyelination (reduced MBP intensity, Fig.5 C), axonal swelling
(Fig. 5, white arrows), axonal injury (reduced SMI-31 intensity, Fig.5 E) in
saline-treated optic nerves and cell infiltration (increased DAPI
intensity, Fig.5 G). The correlations of DBSI metrics and corresponding IHC markers (Fig.5 I - L)
suggested that DBSI metrics correctly reflected coexisting pathologies of ON.Conclusions
Our results indicate that optic nerves of EAE-affected mice treated three months with fingolimod developed relatively mild damage compared to saline-treated mice. This results was shown by DBSI and confirmed with pathological examination. This ‘proof-of-concept’ study demonstrates that it is feasible to use DBSI as a noninvasive imaging biomarker to assess the effect of a drug (in this case fingolimod) on underlying anthologies. DBSI could potentially be used as an outcome measure in human clinical studies to monitor disease progression and validate therapeutic efficacy.Acknowledgements
This work was supported in part by NIH R01-NS047592, P01-NS059560, U01-EY025500, National Multiple Sclerosis Society (NMSS) RG 4549A4/1, RG-1507-05315 and Department of Defense Idea Award W81XWH-12-1-0457.References
1. Wang Y, Wang Q, Haldar JP, et al. Quantification of increased cellularity during inflammatory demyelination. Brain : a journal of neurology 2011;134:3590-3601.
2. Wang Y, Sun P, Wang Q, et al. Differentiation and quantification of inflammation, demyelination and axon injury or loss in multiple sclerosis. Brain : a journal of neurology 2015;138:1223-1238.
3. Lin TH, Chiang CW, Perez-Torres CJ, et al. Diffusion MRI quantifies early axonal loss in the presence of nerve swelling. Journal of neuroinflammation 2017;14:78.
4. Brinkmann V, Billich A, Baumruker T, et al. Fingolimod (FTY720): discovery and development of an oral drug to treat multiple sclerosis. Nature reviews Drug discovery 2010;9:883-897.
5. Tu TW, Budde MD, Xie M, et al. Phase-aligned multiple spin-echo averaging: a simple way to improve signal-to-noise ratio of in vivo mouse spinal cord diffusion tensor image. Magnetic resonance imaging 2014;32:1335-1343.
Figures
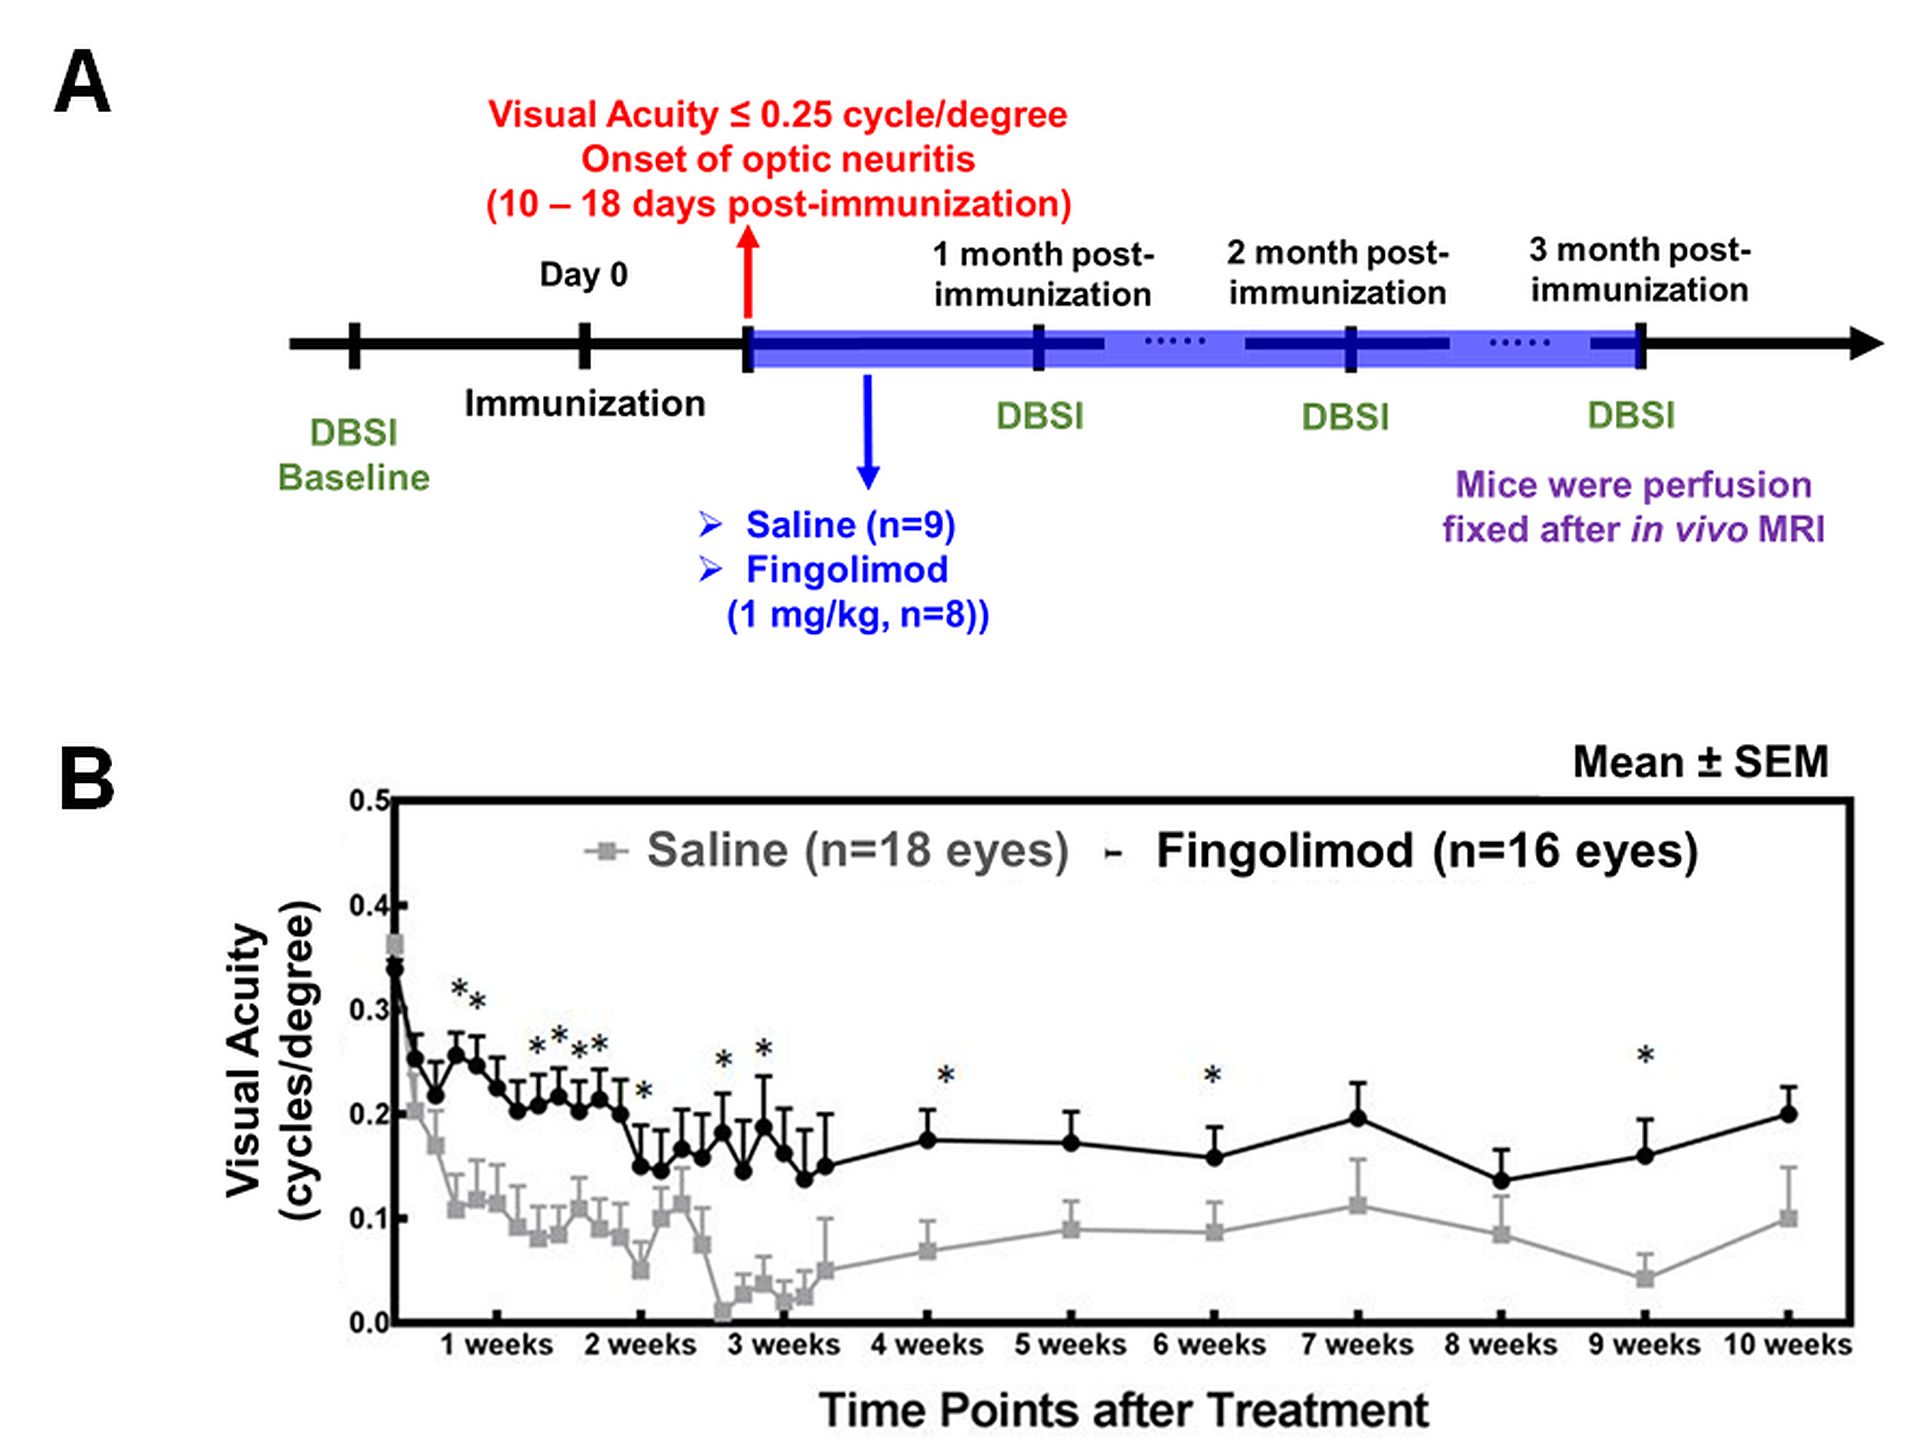
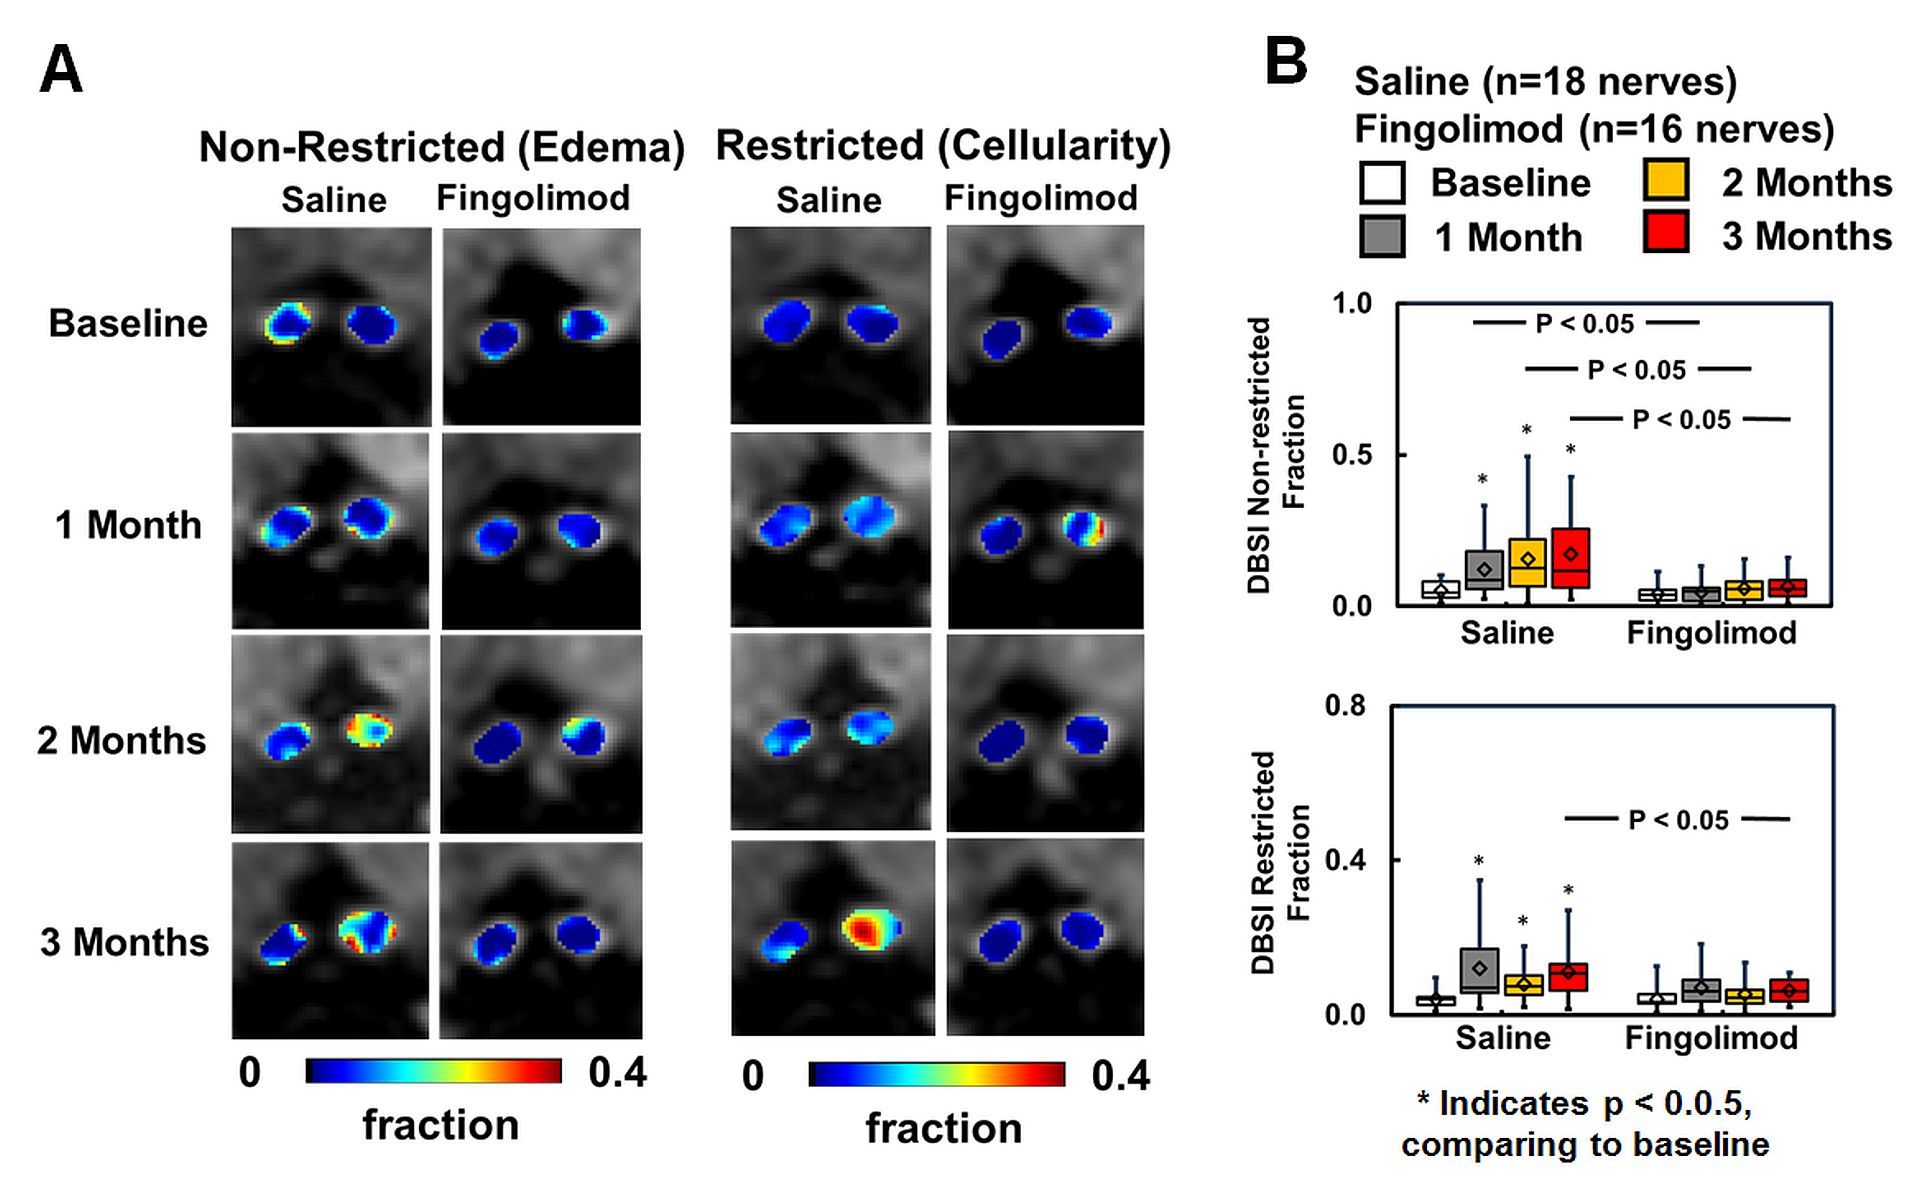
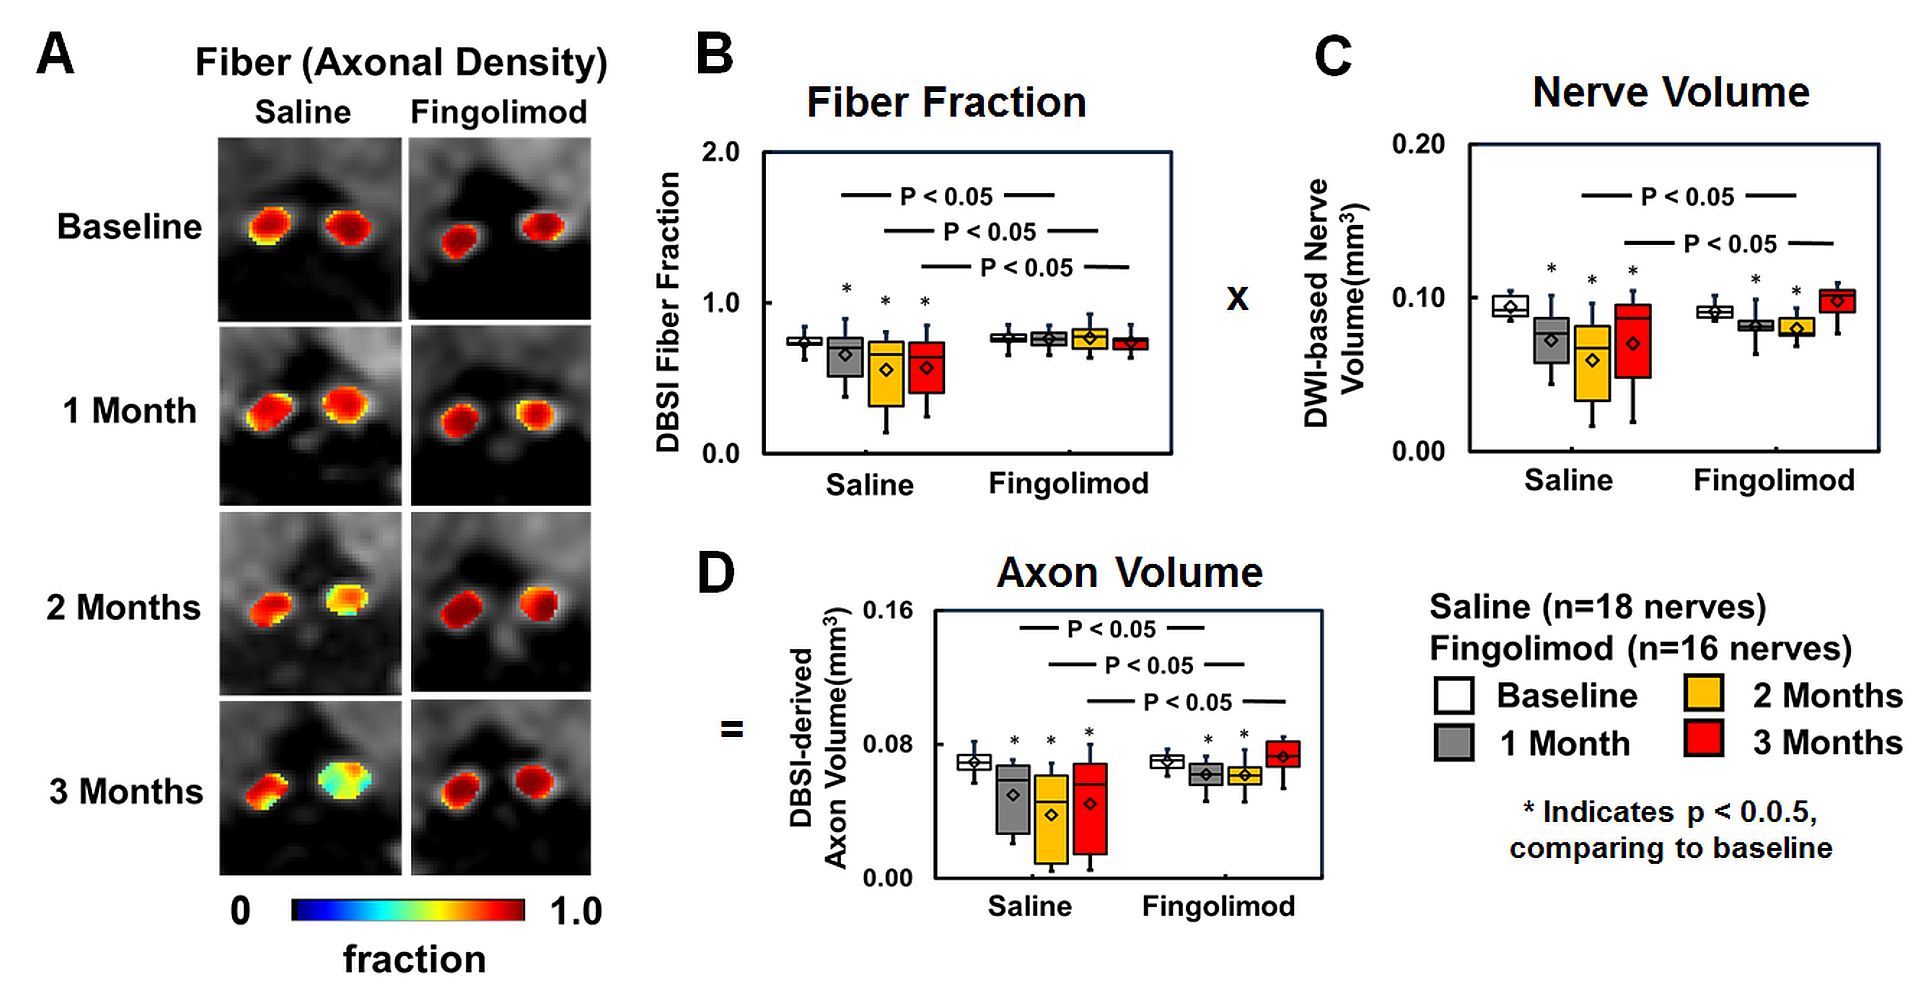
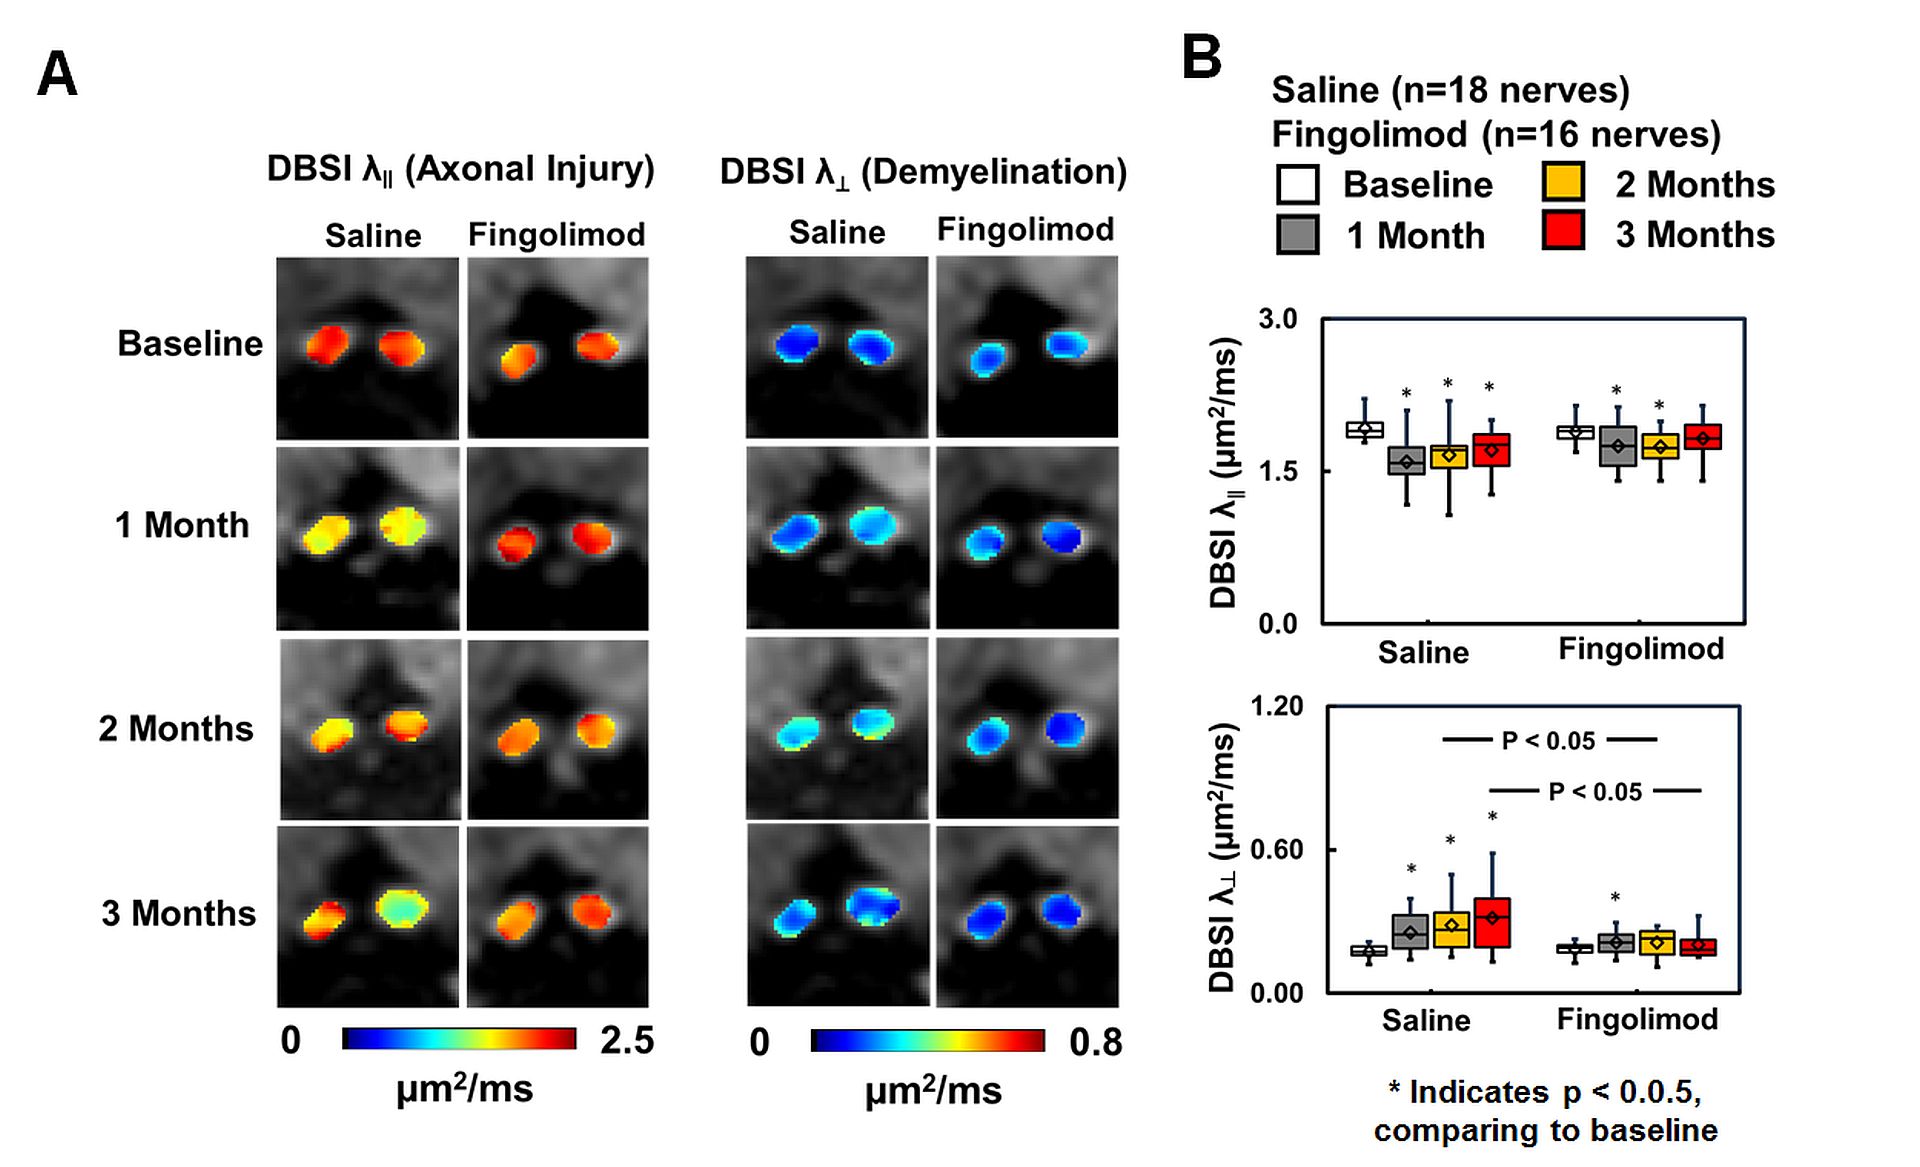
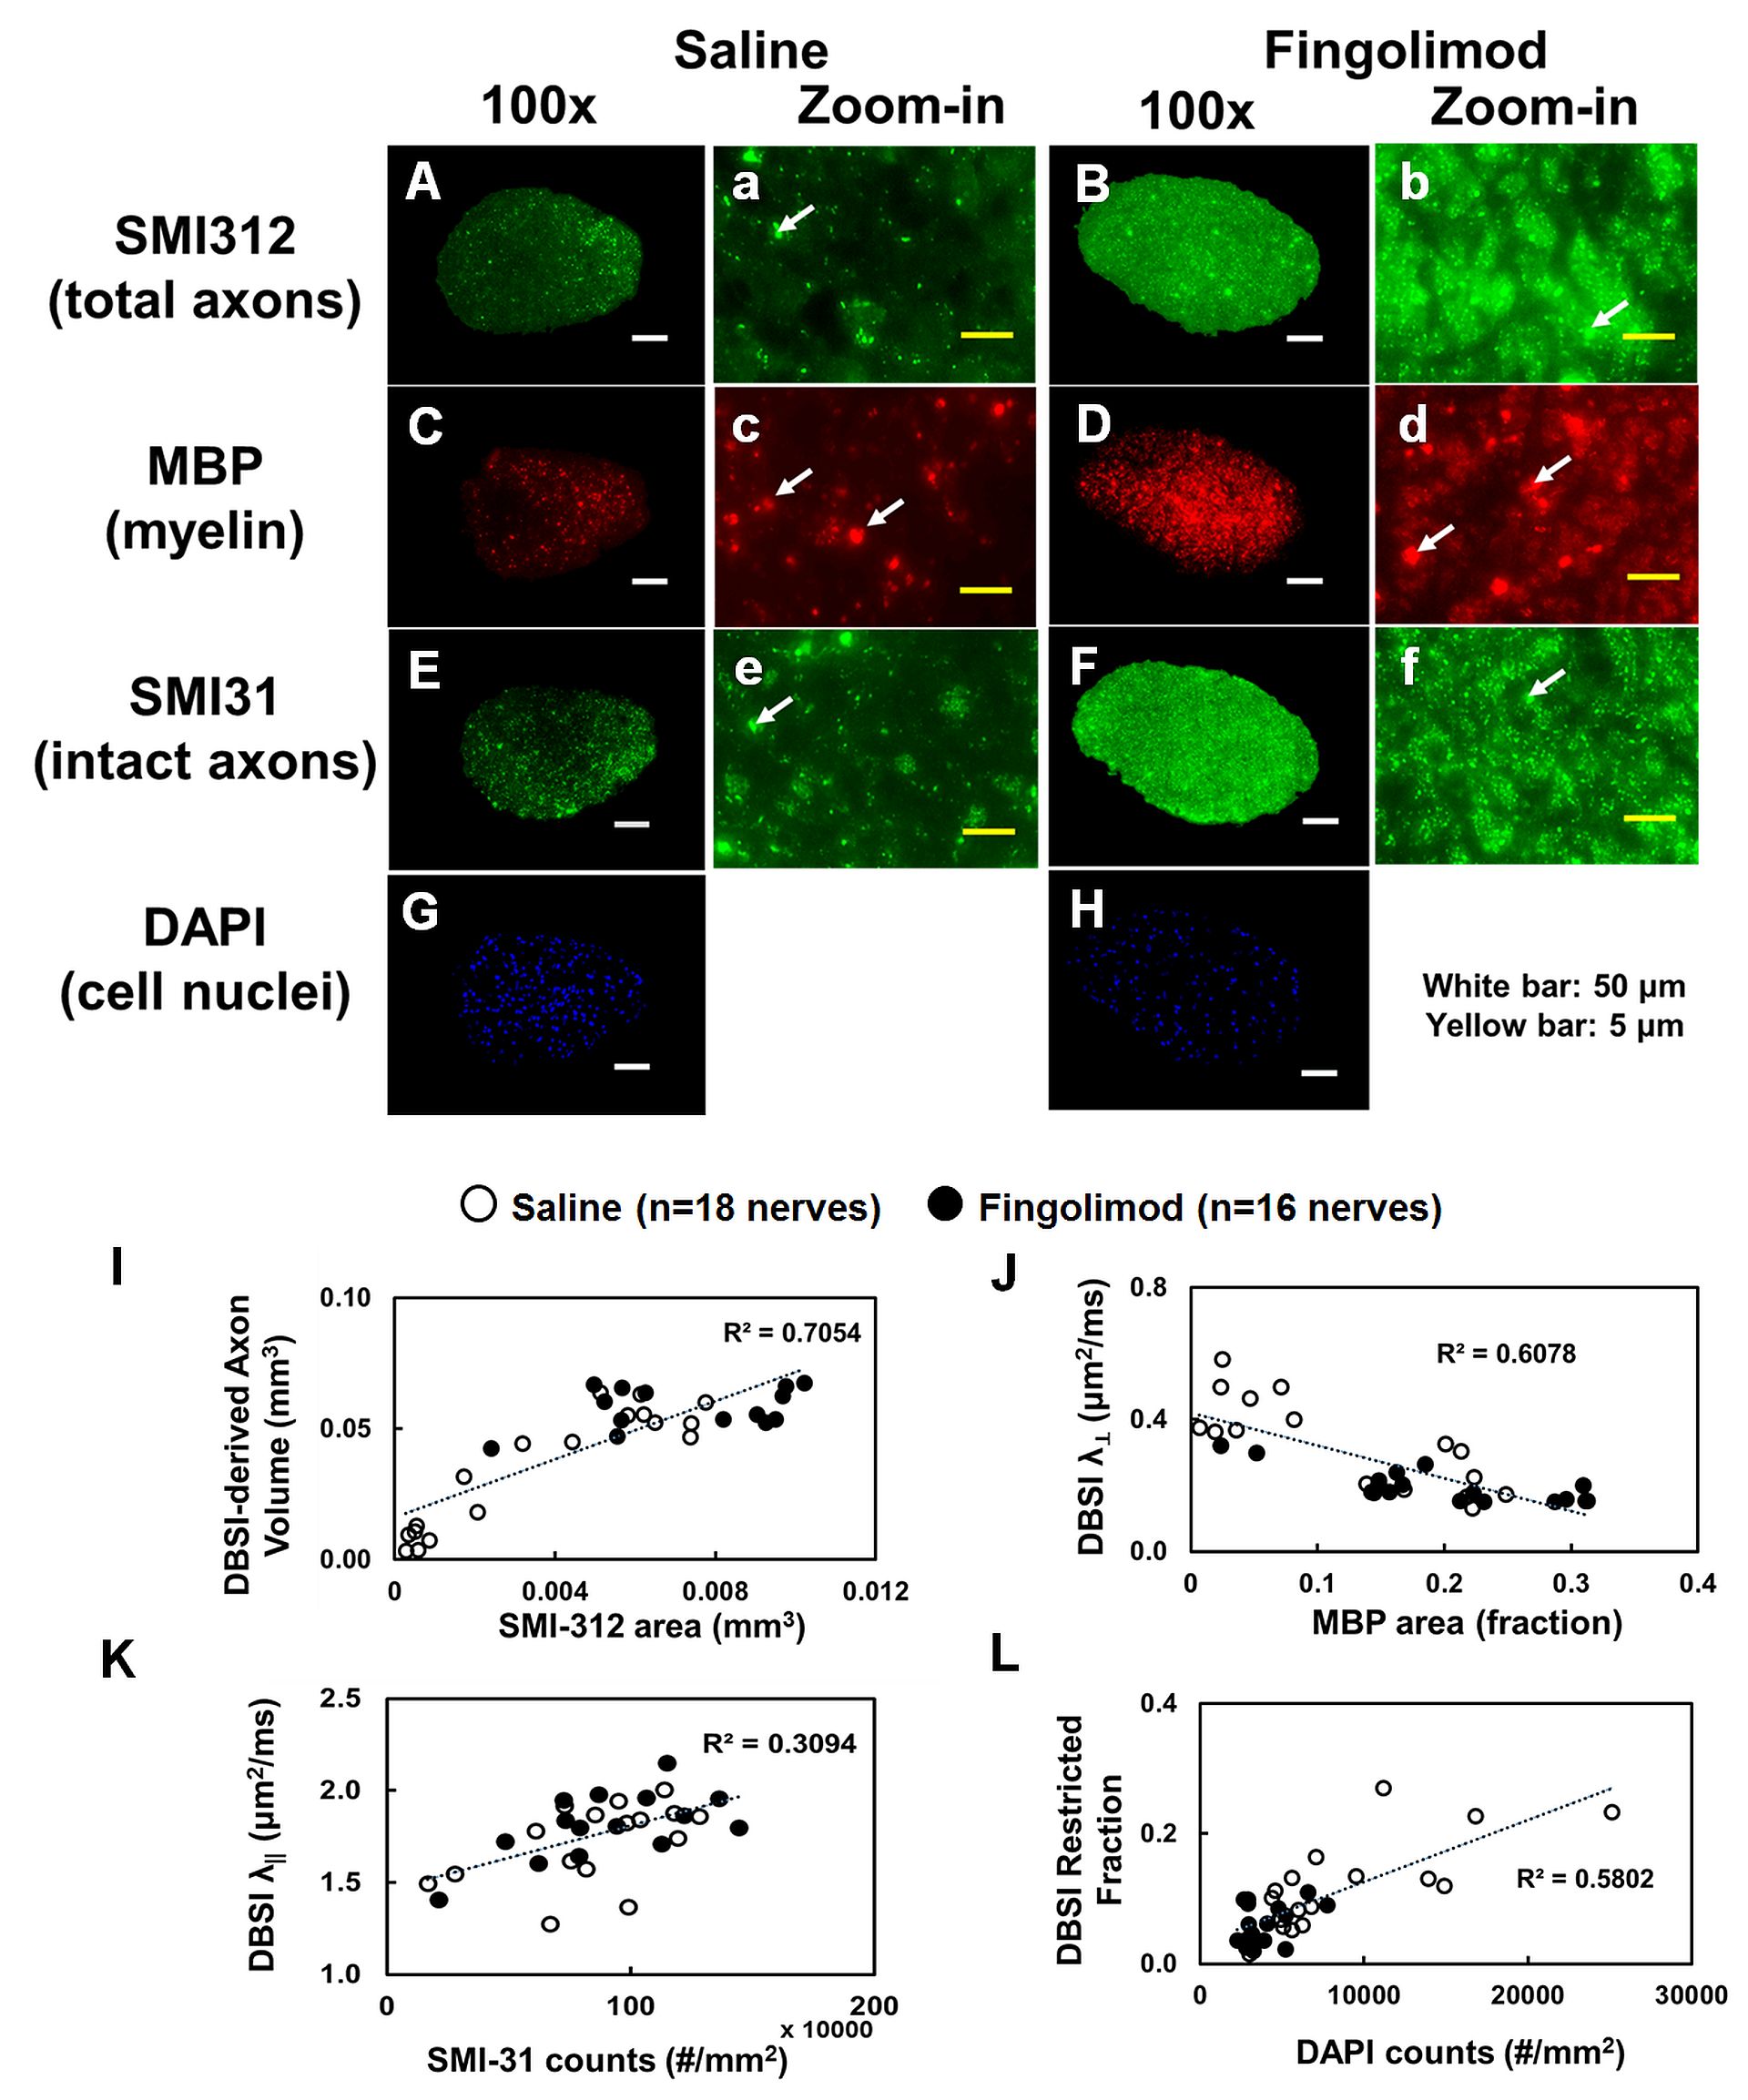
Figure 5 Representative 100x immunohistochemical staining images of total neurofilaments (SMI-312, injured and intact axons), myelin basic protein (MBP, myelin), phosphorylated neurofilament (SMI-31, intact axons), and 4’, 6-dianidino-2-phenylindole (DAPI, nuclei) from saline- and fingolimod-treated optic nerves at three months after treatment. Saline-treated optic nerves showed more severe damages (A, C, E, G). The correlations of SMI-312 volume, MBP and SMI-31 area fractions, and DAPI counts with DBSI-derived axon volume (I), DBSI λ⊥ (J), DBSI λǁ (K), DBSI restricted isotropic fraction (L) suggested that DBSI was able to reflect the severity of axonal loss, demyelination, axonal injury, and cell infiltration, respectively.