4982
Optical Coherent Tomography (OCT) Detected Axonal Loss but Failed to Identify Acute Axonal Injury: A Diffusion Study1Radiology, Washington University School of Medicine, St Louis, MO, United States, 2Ophthalmology & Visual Sciences, Washington University School of Medicine, St Louis, MO, United States, 3Biostatistics, Washington University School of Medicine, St Louis, MO, United States, 4Hope Center for Neurological Disorders, Washington University School of Medicine, St Louis, MO, United States, 5Biomedical Engineering, Washington Univerisyt is St. Louis, St Louis, MO, United States
Synopsis
Optical coherence tomography (OCT) is widely used to noninvasively assess retinal nerve fiber layer (RNFL) thickness to assess optic nerve damage. However, the impact of coexisting pathology on OCT-detected RNFL thickness remains unclear. We have previously developed a diffusion basis spectrum imaging (DBSI) to directly assess coexisting pathologies in mouse models of optic nerve crush (ONC) and optic neuritis. In the current study, we assessed retinal pathology and coexisting pathologies in optic nerve of ONC mice longitudinally, with OCT and DBSI, respectively. Our goal is to determine the relationship between OCT-detected RNFL change and DBSI-derived optic nerve pathologies.
Introduction
Optical coherence tomography (OCT) is widely used to noninvasively assess progressive retinal ganglion cell (RGC) and retinal nerve fiber layer (RNFL) thickness changes in the peripapillary region or optic nerve head reflecting optic nerve damage. OCT assessed RGC/RNFL thickness has been widely used to correlate pre-chiasm optic nerve pathology.1 However, it is unclear whether OCT-detected GRC/RNFL thickness change accurately reflects optic nerve pathology. We have previously developed a diffusion basis spectrum imaging (DBSI)2 to directly assess coexisting pathologies in optic nerve in mouse models of optic nerve crush (ONC)3, 4 and optic neuritis.5, 6 In the current study, we directly assessed RGC/RNFL thickness and coexisting optic nerve pathologies in ONC mice at 7 days, 1 and 3 months post-ONC, with OCT and DBSI, respectively. Our goal is to determine the relationship between OCT-detected GRC/RNFL thickness change and DBSI-derived metrics.Materials and Methods
Optic nerve crush (ONC): C57BL/6 mice underwent ONC (left eye) using a pair of 45-degree-bent micro-forceps at the location approximately 1-2 mm from the eyeball for 20s. Right eye served as control (CTL). Optical Coherence Tomography (OCT): Spectral domain OCT cross-sectional imaging of the peripapillary region (Fig. 1 A) was performed prior to DBSI scans with measurement of the RGC/RNFL thickness at Day 7 (n=5), 1 (n=5) and 3 (n=6) months post-ONC. OCT measurement location was around peripapillary region (red dash lines, S: superior T: temporal I: inferior N: nasal). DBSI: The corresponding DBSI scans were performed on a 4.7-T Agilent small-animal canner with a 25-direction diffusion-weighting scheme utilizing a multiple-echo spin-echo diffusion-weighted sequence.7 All optic nerve images were obtained with the following parameters: TR = 1.5s, TE = 35ms, Δ = 18ms, δ = 6ms, maximal b-value = 2,200 s/mm2, slice thickness = 1.0 mm, FOV = 22.5 × 22.5 mm2, and matrix size = 192 × 192 (in-plane resolution = 117 × 117 µm2 before zero-filling). Data analysis: DBSI-assessed axial diffusivity (λ||, reflecting axonal injury), radial diffusivity (λ⊥, demyelination), axon volume (for axonal loss) and non-restricted fraction (putatively vasogenic edema) and restricted fraction (putatively cellularity) were derived using a lab-developed software. Histology: After in vivo DBSI, tissues were kept for H&E (retina) or immunohistochemistry (optic nerve) staining, including SMI-312, MBP, SMI-31, and DAPI.Results
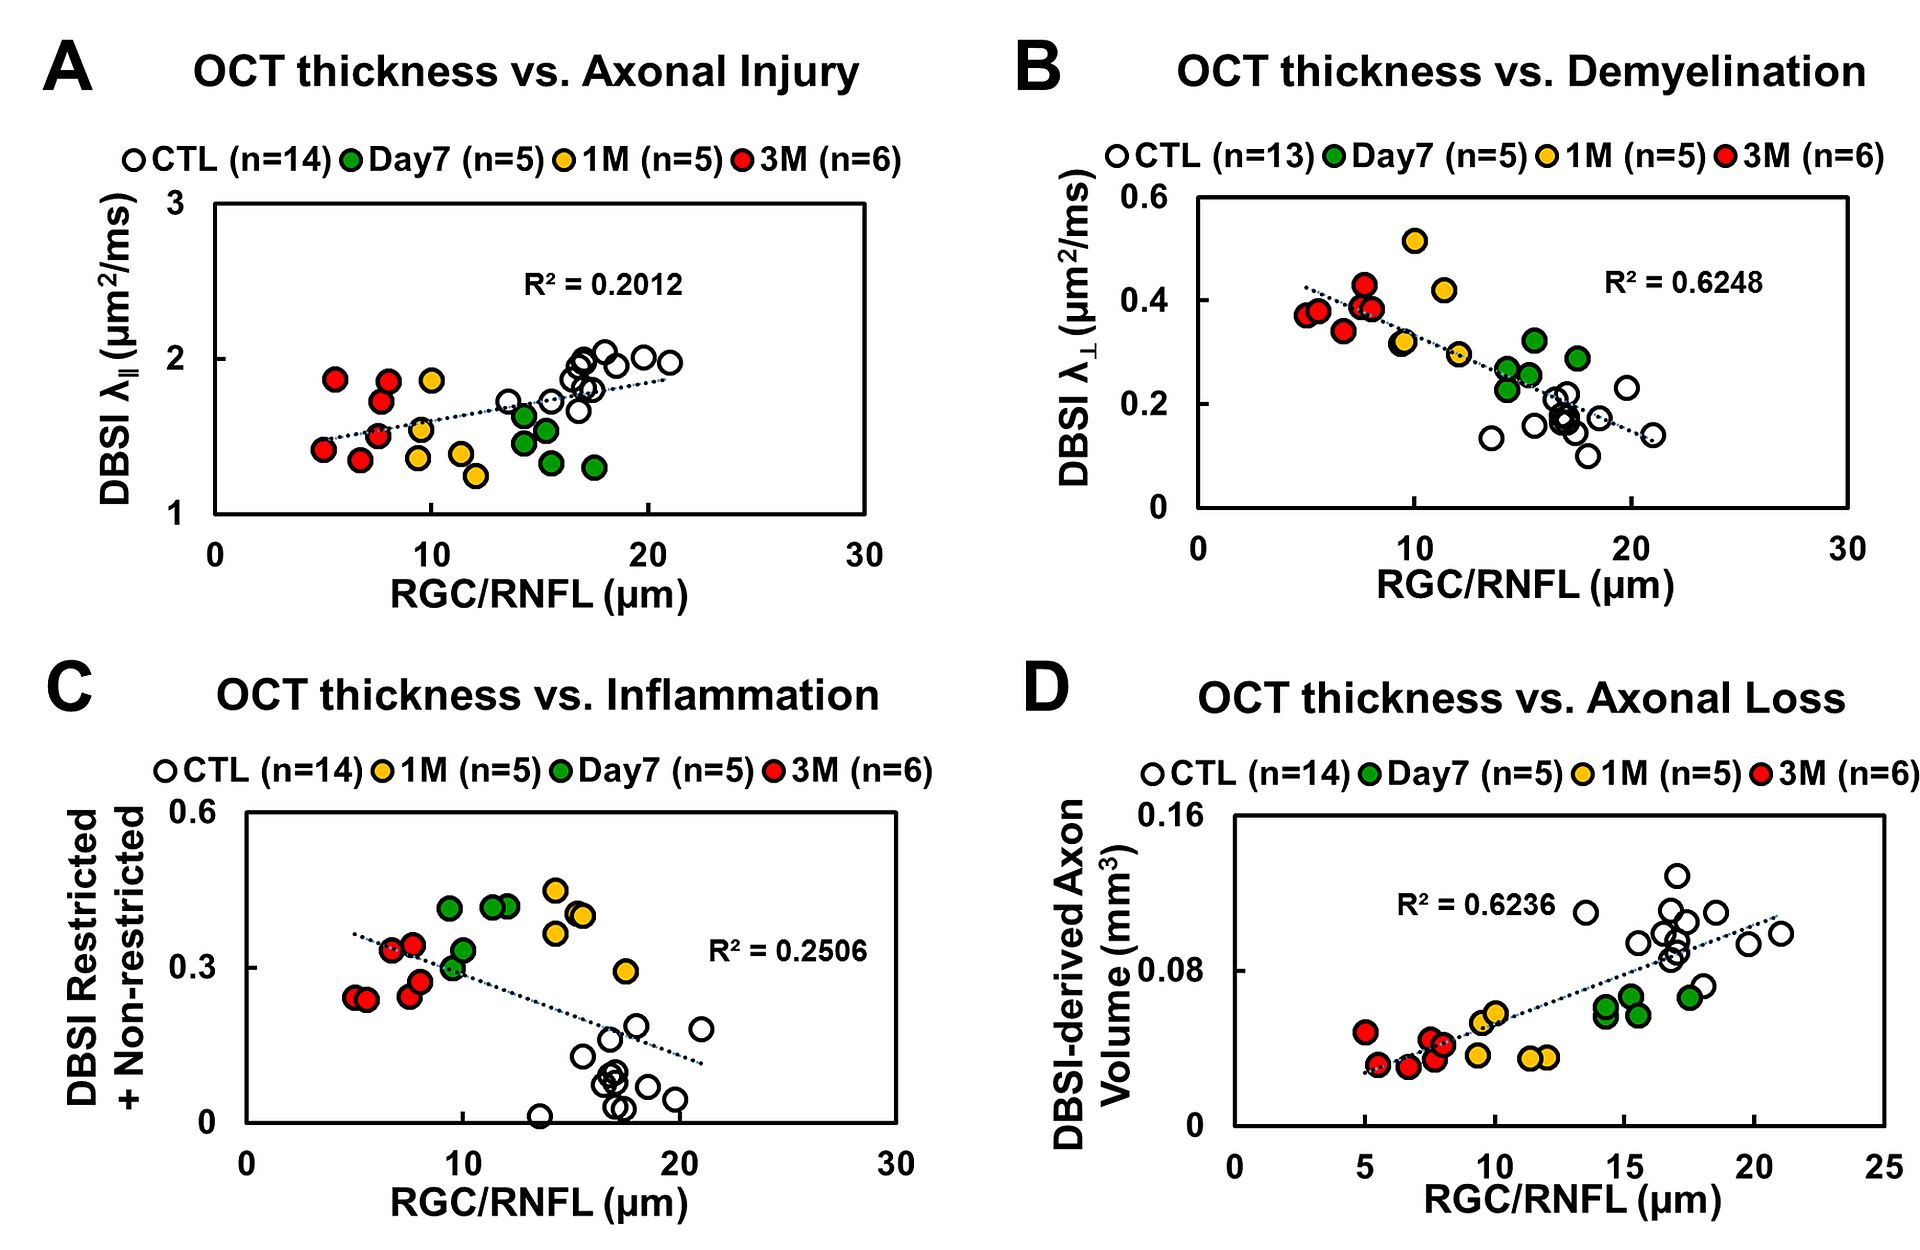
OCT results demonstrated that RGC/RNFL thinning at 7 days, 1 and 3 months post-ONC (Fig. 1 B, p < 0.05). The thickness of the representative retinal H&E was consistent with OCT results (Fig. 1 C). Diffusion-weighted images from 7 days, 1 and 3 months post-ONC suggested progressive optic nerve atrophy (Fig. 2 A). Decreased DBSI λ|| (Fig. 2 B, p < 0.05) and increased DBSI λ⊥ (Fig. 2 C, p < 0.05) was shown in the crushed optic nerves, suggesting axonal injury and demyelination. Increased DBSI non-restricted (starting 1-month post-ONC, Fig. 2 D, p < 0.05) and restricted (Fig.2 E, p < 0.05) fractions were both seen in the crushed optic nerves from 7 days to 3 months post-ONC, suggesting inflammation. DBSI fiber fraction reflects axonal fiber density (Fig. 3 A). DBSI-derived axon volume (Fig. 3D), derived by multiplying DBSI fiber fraction (Fig.3 B) by nerve volume (Fig. 3 C) to remove the confounding effects from inflammation, revealed a 37%, 56%, and 61% reduction at 7 days, 1 and 3 months after ONC (Fig. 3 D). Representative IHC markers reflected different degrees of demyelination (Fig. 4 A-D), axonal injury (Fig. 4 E-H), axonal loss (Fig.4 I-L), axonal beading (Fig. 4, white arrows) and cellularity (Fig. 4 M-P), supporting that DBSI detects and differentiates coexisting pathologies in optic nerves. The correlations of GRC/RNFL thickness and DBSI axial diffusivity and restricted fraction suggested that OCT is not sensitive to axonal injury and inflammation (Fig. 5 A, C). In contrast, OCT-detected RNFL thickness was related with demyelination and axonal loss (Fig. 5 B, D), suggesting demyelination is secondary to traumatic axonal injury (Wallerian degeneration) and chronic axonal loss.Conclusions
Our data suggested that DBSI appropriately reflects coexisting pathologies in pre-chiasm optic nerve. OCT-detected RNFL thinning may be confounded by the axonal injury and inflammation. Our findings suggest that RNFL thinning may not accurately reflect axonal loss in the presence of axonal injury and/or inflammation. Complete histology is being pursed to quantitatively assess the sensitivity of RNFL to axonal pathologies.Acknowledgements
This work was supported in part by NIH R01-NS047592, P01-NS059560, U01-EY025500, National Multiple Sclerosis Society (NMSS) RG 4549A4/1, RG-1507-05315 and Department of Defense Idea Award W81XWH-12-1-0457.References
1. Costello F, Coupland S, Hodge W, et al. Quantifying axonal loss after optic neuritis with optical coherence tomography. Annals of neurology 2006;59:963-969.
2. Wang Y, Wang Q, Haldar JP, et al. Quantification of increased cellularity during inflammatory demyelination. Brain : a journal of neurology 2011;134:3590-3601.
3. Lin TH, Sun P, Wang Y, Song SK. Quantifying Optic Nerve Inflammation and Axon Loss by Diffusion MRI. Investigative ophthalmology & visual science 2016;57.
4. Lin TH, Wallendorf M, Sun P, Song S. Diffusion MRI differentiated acute inflammation from axonal injury but missed axonal loss. Proc Intl Soc Mag Reson Med 25 (2017) 2017;1093.
5. Lin TH, Chiang CW, Perez-Torres CJ, et al. Diffusion MRI quantifies early axonal loss in the presence of nerve swelling. Journal of neuroinflammation 2017;14:78.
6. Lin TH, Zhan J, Song C, et al. Corticosteroid Treatment Fails to Prevent Long-term Axonal Loss Assessed by Diffusion Basis Spectrum Imaging. 2017;Proc. Intl. Soc. Mag. Reson. Med. 25 (2017):0217.
7. Tu TW, Budde MD, Xie M, et al. Phase-aligned multiple spin-echo averaging: a simple way to improve signal-to-noise ratio of in vivo mouse spinal cord diffusion tensor image. Magnetic resonance imaging 2014;32:1335-1343.
Figures
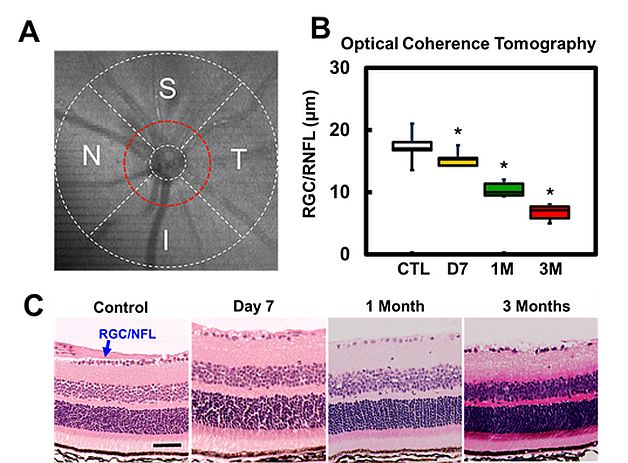
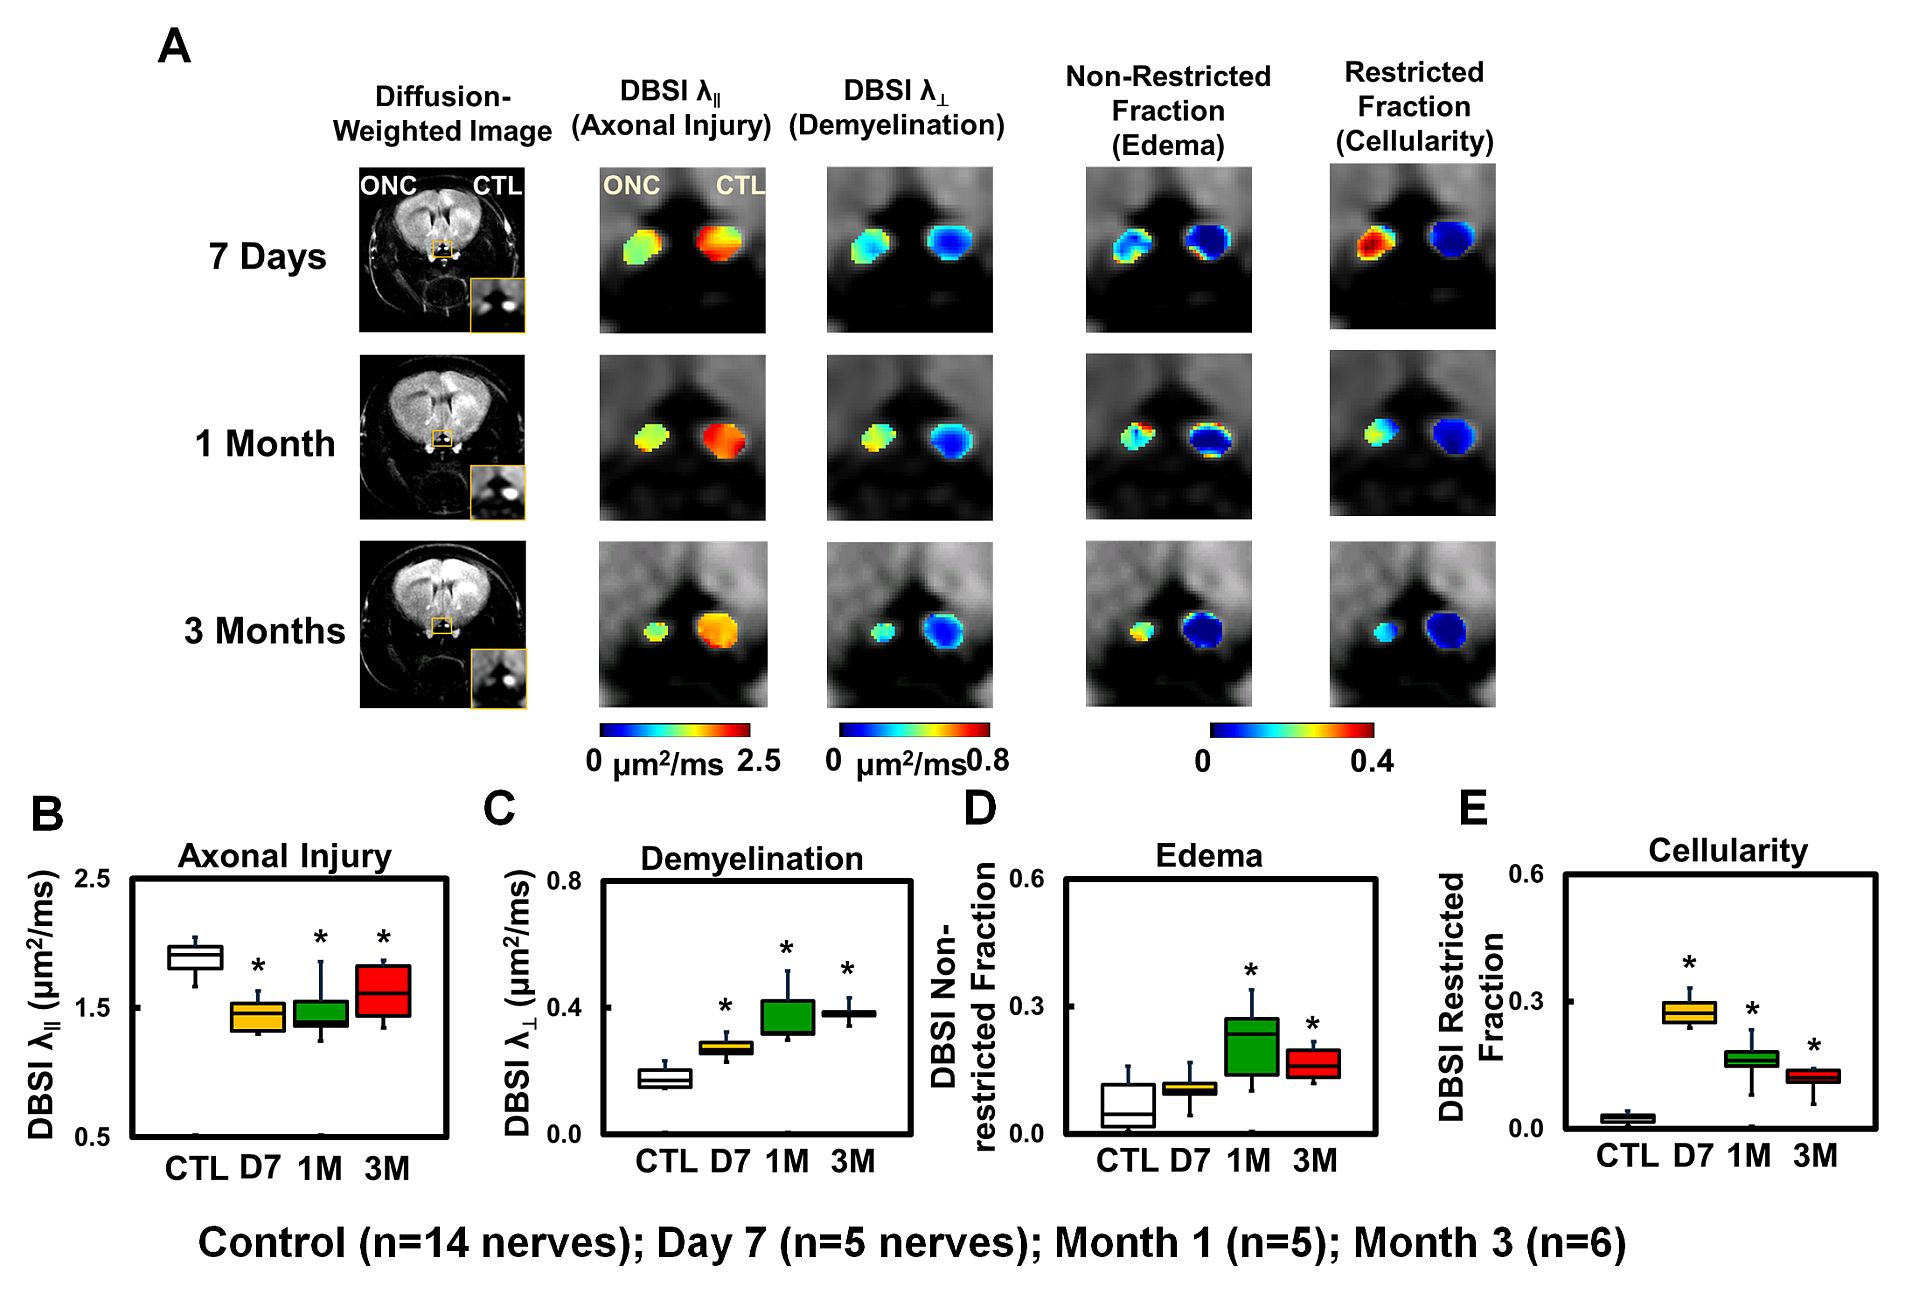
Figure 2 Diffusion-weighted images (DWI) indicated tissue atrophy in the crushed optic nerves (A). Decreased DBSI λ|| (B) and increased DBSI λ⊥ (C) suggested axonal injury and demyelination in the crushed optic nerves. Meanwhile, increased DBIS non-restricted (putatively edema, D) and restricted (putatively cellularity, E) fractions, derived from isotropic diffusion tensors, indicated edema and increased cellularity at 7 days and 1 month post-ONC.
⋆ indicates p < 0.05
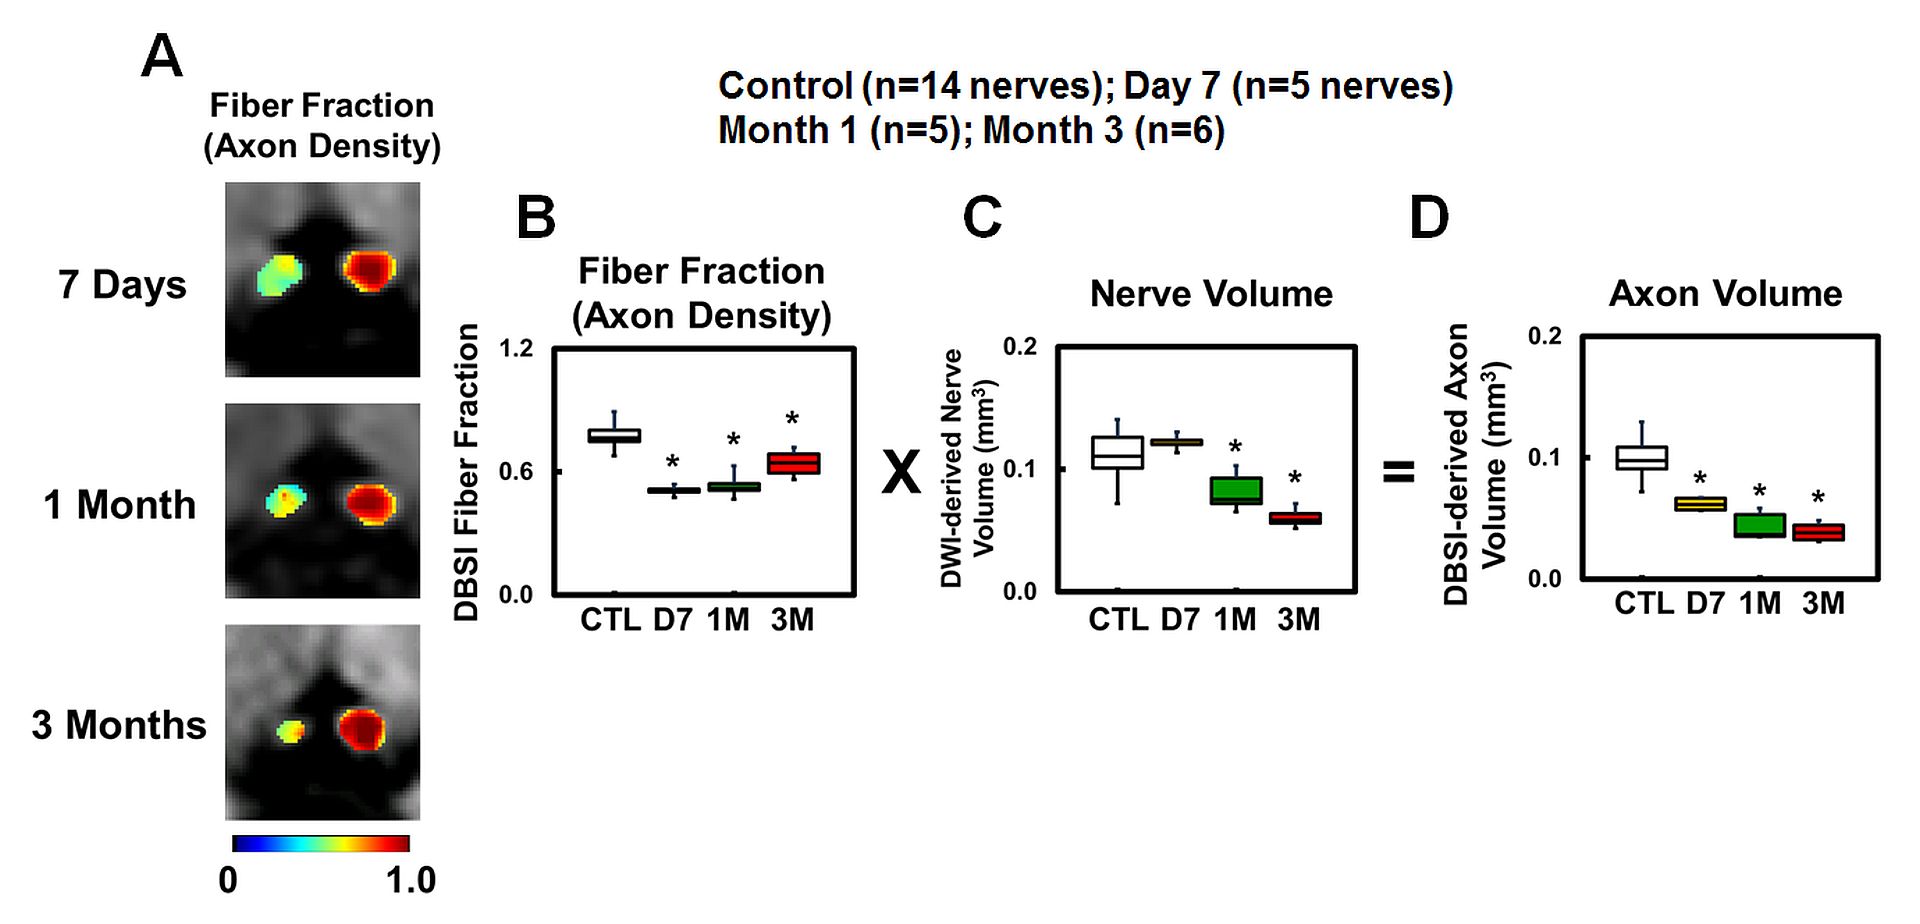
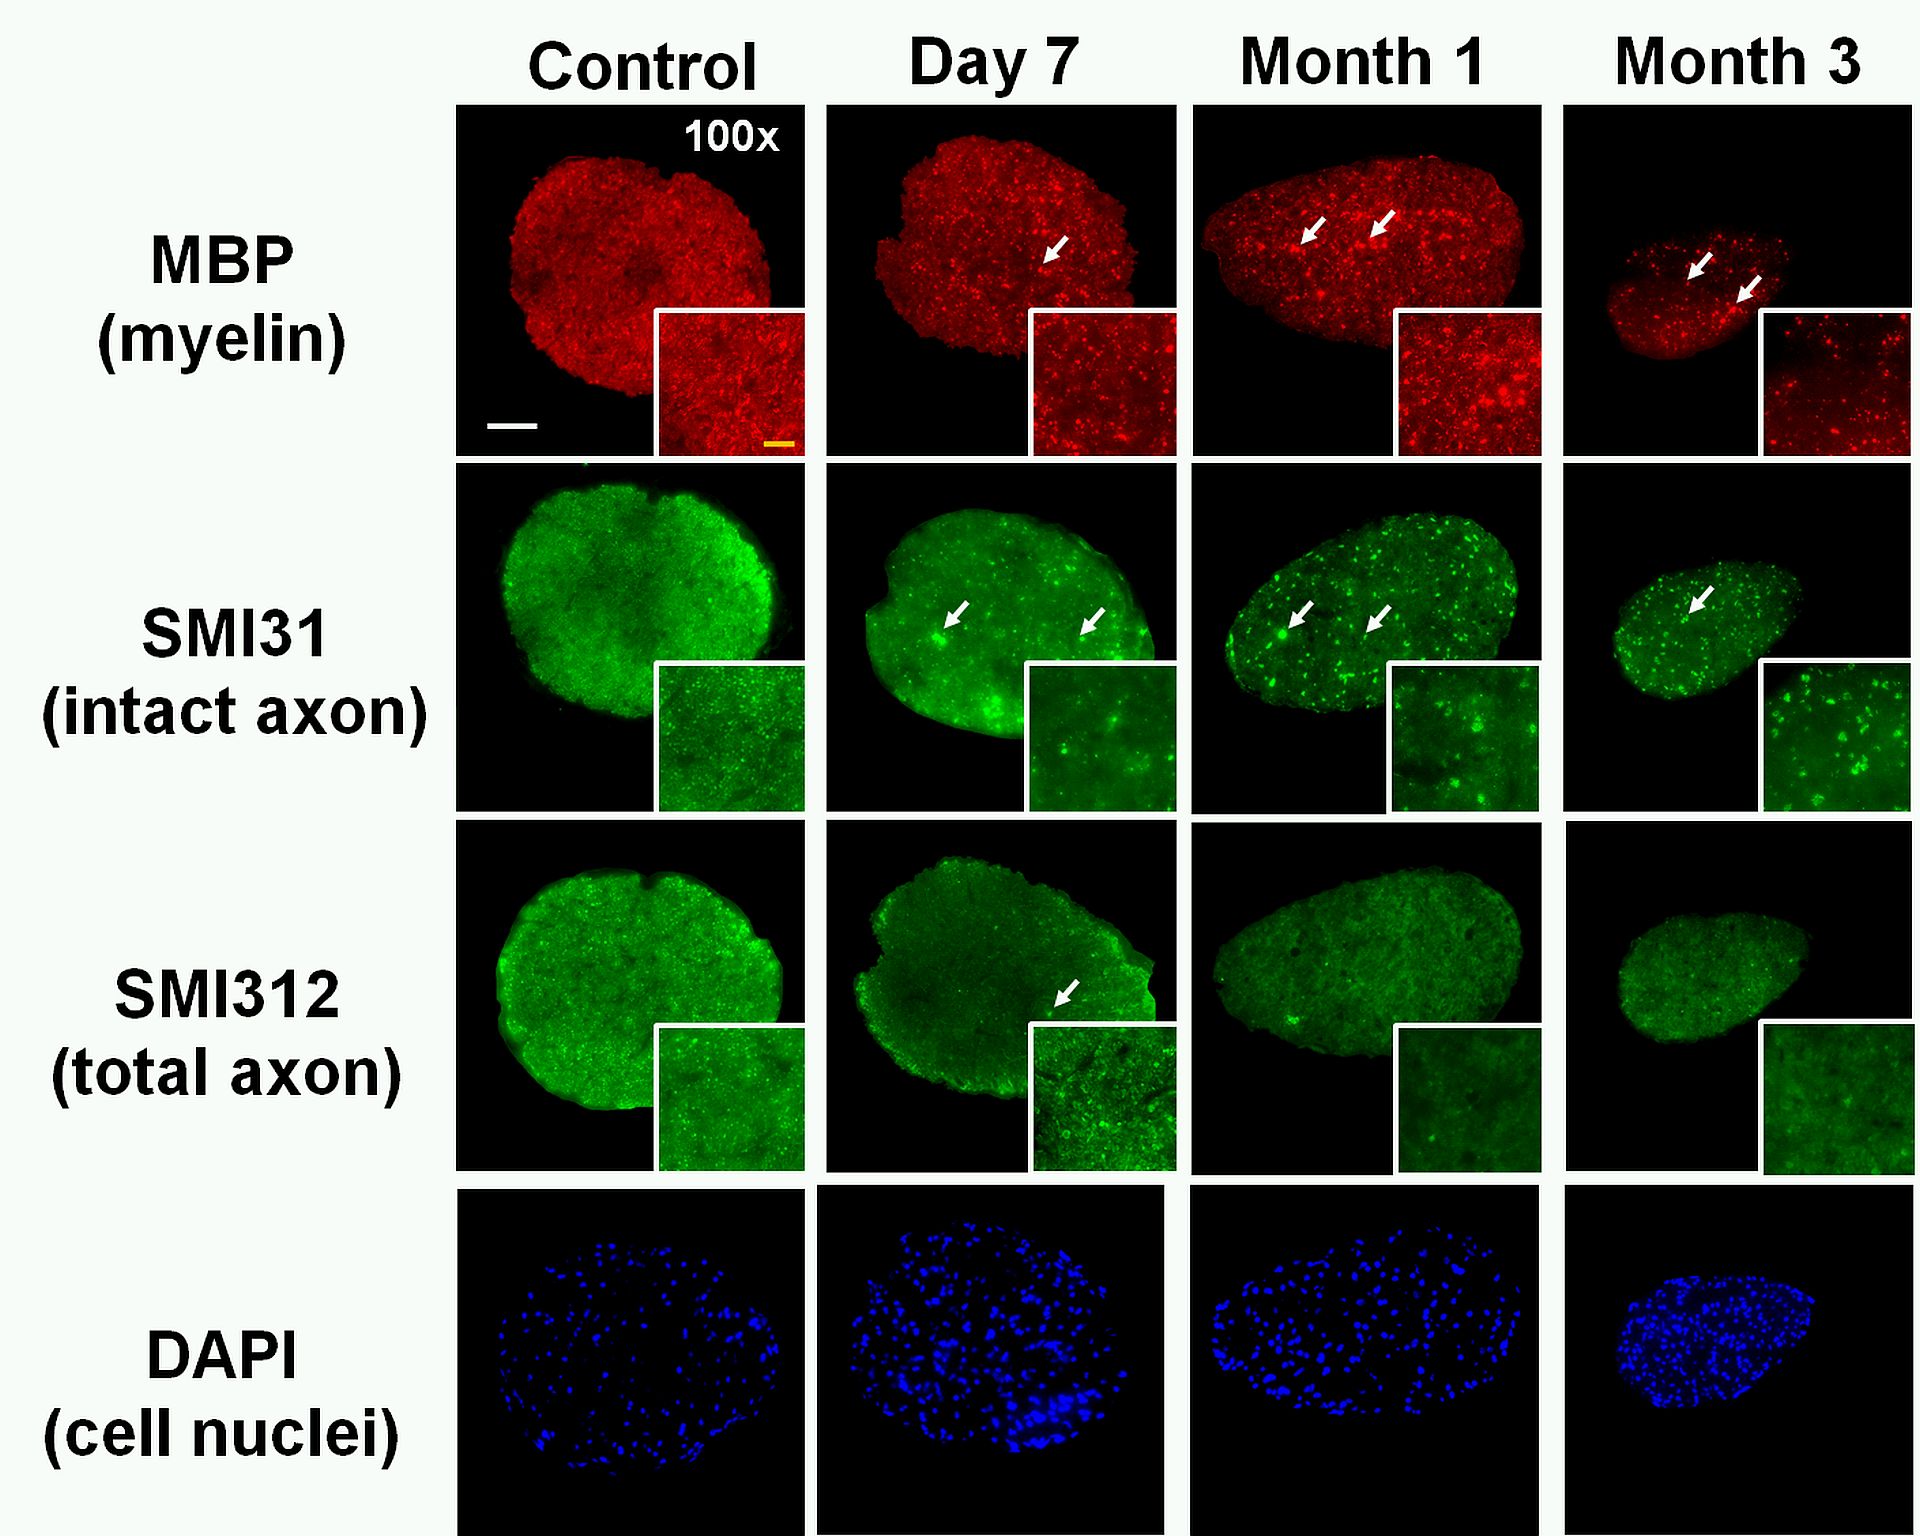
Figure 4 Representative 100x immunohistochemical staining images of myelin basic protein (MBP, assessing myelin sheaths, A – D), phosphorylated neurofilament (SMI-31, reflecting intact axons, E – H), total neurofilament (SMI-312, staining both injured and intact axons, I - L), and 4’, 6-dianidino-2-phenylindole (DAPI, detecting nuclei, M – P) from control and crushed optic nerves at 7days, 1 and 3 months post-ONC reflected different degrees of demyelination, axonal injury, axonal loss, and increased cellularity. The IHC results were consistent with DBSI findings.
White bar: 50 µm
Yellow bar: 10 μm