4981
Longitudinal evaluation of iron load with quantitative suceptibility mapping (QSM) in a primate model of Parkinson's diseaseMathieu David Santin1,2, Maxime Verdier1,2, Romain Valabregue1,2, Elodie Laffrat2, Lydia Yahia Cherif1,2, Alexandra Petiet1,2, Stéphane Lehéricy1,2, and Stéphane Hunot2
1CENIR, ICM, Paris, France, 2Inserm U 1127, CNRS UMR 7225, Sorbonne Universités, UPMC Univ Paris 06 UMR S 1127, Institut du Cerveau et de la Moelle épinière, ICM, Paris, France
Synopsis
In this study, we performed a longitudinal follow-up of iron load in a primate model of Parkinson's disease using both QSM and R2* mapping. ROI definition was automatically performed using an in-house template computed from all acquired data. Statistical analyses revealed that QSM is more sensitive to model-induced variation in iron-rich regions compared to R2* mapping.
Introduction
Quantitative Susceptibility Mapping (QSM) is a novel contrast analytic method in MRI. QSM is generated by using information within phase images about variations of local magnetic field induced by magnetic sources. QSM allows discrimination between tissues displaying different magnetic susceptibilities related for instance to iron content, microbleeds or calcification. QSM has been used in humans to evaluate iron load in brain tissue1 which is known to increase in some pathological conditions such as Parkinson’s disease (PD). Here we investigated the feasibility of longitudinal brain QSM in a non-human primate (squirrel monkey) model of PD induced by the dopaminergic neurotoxin 1-methyl-4-phenyl-1,2,3,6-tetrahydropyridine (MPTP). Within a population of 15 diseased animals, we evaluated the longitudinal changes of magnetic susceptibility and R2* values in specific brain areas including the external globus pallidus (GPE), internal globus pallidus (GPI), substantia nigra pars compacta (SNC), substantia nigra pars reticulate (SNR), putamen (Put), anterior cingulate cortex (Acc) and caudate nucleus (CN). A fully automatic pipeline was set up to process data.Methods
Experiments were conducted on 15 anesthetized squirrel monkeys (8-16 year-old females) during a 2-year follow-up plus an additional SHAM animal scanned over one year. All animals were scanned using an 11.7T Bruker Biospec 117/16 (Bruker, Germany). A birdcage transceiver radio-frequency coil was used for all experiments (Bruker, Germany). QSM images were reconstructed using a 3D Multi Echo Gradient Echo (MGRE) sequence. Scans were performed before intoxication and every 3 months after the 2 months intoxication period over one year. Imaging parameters were: FOV= 58*52*40 mm3, matrix size=232*208*160 giving an isotropic resolution of 0.25*0.25*0.25mm3, TR=30ms, 1st TE=1.70ms last TE=21.02ms with a ∆TE of 1.76ms, spectral width=862 Hz/Pixel for a total scan time of 33min17s. Raw data were saved and reconstructed with in-house software in Matlab (Mathworks, USA). For QSM images reconstruction, unwrapping was first performed using the Laplacian operator and then background field removal was performed using the Laplacian Boundary Value (LBV) method2 . Finally, the dipole inversion was performed using the Morphology-Enabled Dipole Inversion (MEDI) method3. Regularization parameter λ was set to 1500. R2* maps were obtained by first fitting a monoexponential decay on each echo for every voxel, then inverted to obtain R2* local values. An anatomical atlas image was created by averaging magnitude images over each echo for the entire population of monkeys. Brain regions of interest (ROI) were manually defined on the atlas image. This segmentation was then automatically wrapped to fit any subject’s images by means of a in-house software in Matlab using Advanced Normalization Tools. Statistical analyse was performed on the following normalized data: control state, post-intoxication and 3 months after intoxication. Statistical analyses on the remaining data was made impossible by the loss of several animals (mainly due to histology requirements). Normalization process consisted in normalizing, for each subject and each ROIs, every data value by the value in the basal state.Results
Figure 1 shows the template obtained from MGRE data and susceptibility maps with overlayed ROIs. Unlike R2* maps, statistical analysis of QSM data showed significant changes within the SNR, SNC, GPE and GPI after MPTP treatment. The respective P-values for the Kruskal-Wallis test were 0.0003, 0.0003, 0.0001 and 0.002. Figures 2 to 5 show the longitudinal evolution of the normalized mean magnetic susceptibility and R2* values in those regions.Discussion And Conclusions
Based on data acquired from all ROIs, we demonstrate that QSM showed greater variations than R2* in brain areas known to experience iron load variations during parkinsonism. Therefore, QSM appears as a method of choice to monitor iron metabolism dysregulation associated with neurodegeneration as compared to conventional R2* mapping. While nigral iron load increases during early disease phase we also noticed a remission tendency after 6 months of intoxication, a time point where maximal neuronal death is already achieved (not shown). How these changes translate into neuropathological changes at the cellular level is not known at this point and will need further investigations.Acknowledgements
The research leading to these results has received funding from the program “Investissements d’avenir” ANR-10-IAIHU-06. All animal work was conducted at the ICM PHENOPARC Core Facility (head: Magali Dumont/Philippe Ravassard, veterinarian: Corina Dussaud). We thank Morgane Weissenburger, Estelle Chavret-Reculon, and Elodie Laffrat from the PHENO-PRIMR facility for their help. The Core is supported by 2 “Investissements d’avenir” (ANR-10- IAIHU-06 and ANR-11-INBS-0011-NeurATRIS) and the “DIM-NeRF Ile de France”.References
1. Schweser F. et al. NeuroImage 2011; 54 (4) 2. Zhou D et al. NMR Biomed. 2014 Mar; 27(3). 3. Liu J et al. Neuroimage 2011.Figures
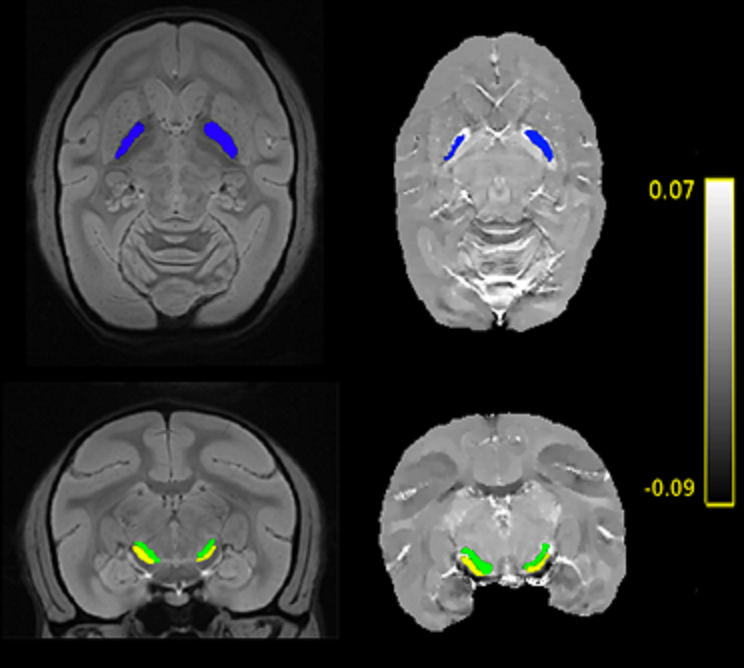
On the left, the template with segmentation of GPE
(blue), SNC (green) and SNR (yellow). On the right, QSM map of a random subject
showing correct repositioning of the segmentation. Colorbar stands for QSM values in ppm.
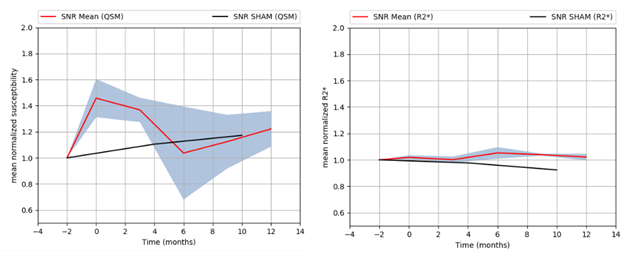
Mean
normalized susceptibility and R2* variations in SNR (red line)
with
standard error of the mean-SEM (grey zone).
Normalized
susceptibility and R2* variations in SNR for SHAM monkey (black line).
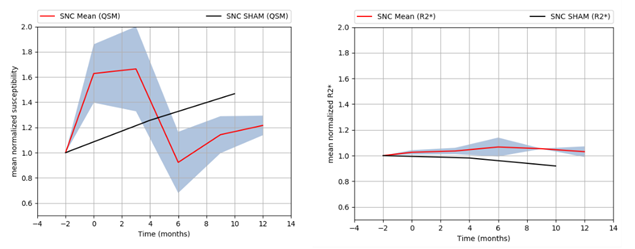
Mean
normalized susceptibility and R2* variations in SNC (red line) with SEM (grey
zone).
Normalized
susceptibility variations in SNC for SHAM monkey (black line).
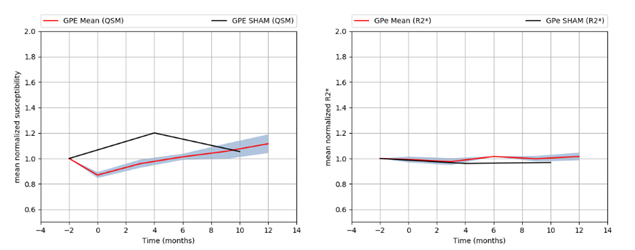
Mean
normalized susceptibility and R2* variations in GPE (red line) with SEM (grey
zone).
Normalized
susceptibility variations in GPE for SHAM monkey (black line).
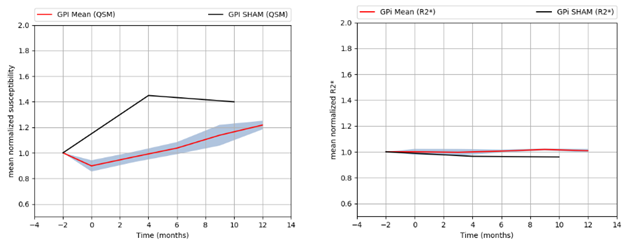
Mean
normalized susceptibility and R2* variations in GPI (red line) with SEM (grey
zone).
Normalized
susceptibility variations in GPi for SHAM monkey (black line).