4976
Correlations between brain metabolites and tau protein accumulation assessed by H-MRS and tau PET in Alzheimer’s disease model mice1Department of Functional Brain Imaging Research, National Institutes for Quantum and Radiological Science and Technology, Chiba, Japan, 2Department of Molecular Imaging and Theranostics, National Institutes for Quantum and Radiological Science and Technology, Chiba, Japan
Synopsis
Amyloid beta protein and tau proteins are two major hallmarks of the pathology of Alzheimer’s disease. To elucidate the relationship between brain metabolites and tau protein, we performed H-MRS and tau PET imaging of tauopathy mouse model (rTg4510). Five rTg4510 mice and five wild-type mice were scanned at the age of 4 and 6 months by H-MRS and tau PET. We demonstrated that the amount of tau had negative correlations with the amount of taurine, tNAA, and glutamate, indicating that tau might reduce those metabolites selectively and caused neural impairment.
INTRODUCTION
Amyloid beta protein (Aβ) and tau proteins are two major hallmarks of the pathology of Alzheimer’s disease (AD). To elucidate the impact of these abnormal proteins on brain metabolism is important for finding therapeutic strategies since brain metabolism is strongly involved in brain health. H-MRS is a valuable technique which can speculate the brain conditions via brain metabolites. Since abnormal proteins can be visualized by positron emission tomography (PET) imaging (1), it is possible to investigate the relationship between abnormal proteins and brain metabolites by multimodal imaging. While Aβ load detected by PET is reported to be correlated with the amount of myoinositol (2), which is believed to be a potential glial marker of AD, the association of tau with brain metabolites has yet to be clarified. In this study, to elucidate the relationship between brain metabolites and tau, we performed H-MRS and tau PET imaging of a tauopathy mouse model (rTg4510) (3).METHODS
Five rTg4510 mice and five wild-type mice anesthetized with 1–2% isoflurane were scanned at the age of 4 and 6 months by H-MRS as well as tau PET which enables to detect tau in vivo. H-MRS experiments were done using a 7 T spectrometer (Biospec, AVANCE-III, Bruker Biospin) with a dual-channel phased-array cooled surface coil for transmission and reception (cryoprobe©, Bruker Biospin) using a PRESS sequence (TR/TE = 4000/20 ms). Volumes of interest (VOIs) were localized in frontal cortex as well as hippocampus. A total of 256 acquisitions for frontal cortex and 296 acquisitions for hippocampus were collected. Using water signal as a reference, absolute metabolite concentrations were calculated using LCModel. PET scans were performed using a microPET Focus 220 animal scanner (Siemens Medical Solutions) immediately after intravenous injection of tau PET tracer. Summation images from 30 to 60 min after the tracer injection were generated with maximum a posteriori reconstruction, and dynamic images were reconstructed with filtered backprojection using a 0.5-mm Hanning’s filter. VOIs were placed on hippocampus, brain cortex, and cerebellum (as a reference), using PMOD image analysis software (PMOD Technologies). To investigate the correlation between tau load detected by PET and brain metabolites (tNAA, myoinositol, glutamate (Glu), glutamine (Gln), GABA, and taurine), Pearson’s rank correlation tests were performed. A t-test was used to compare the concentration of taurine in the VOIs of hippocampus and frontal cortex between the rTg4510 mice and wild-type mice. Immunostaining was performed on scanned mice by using AT8 and NeuN for tau staining and neuron staining, respectively.RESULTS
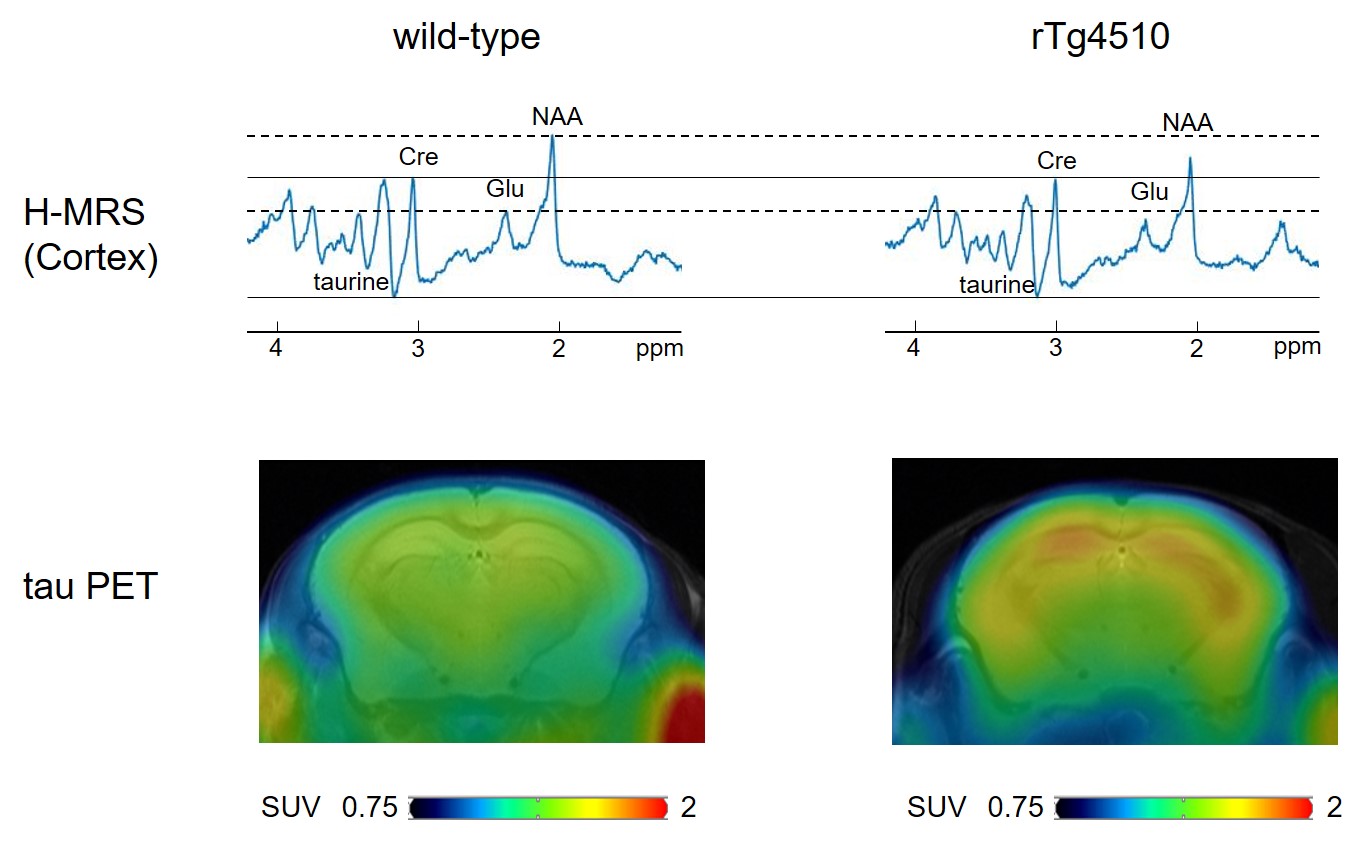
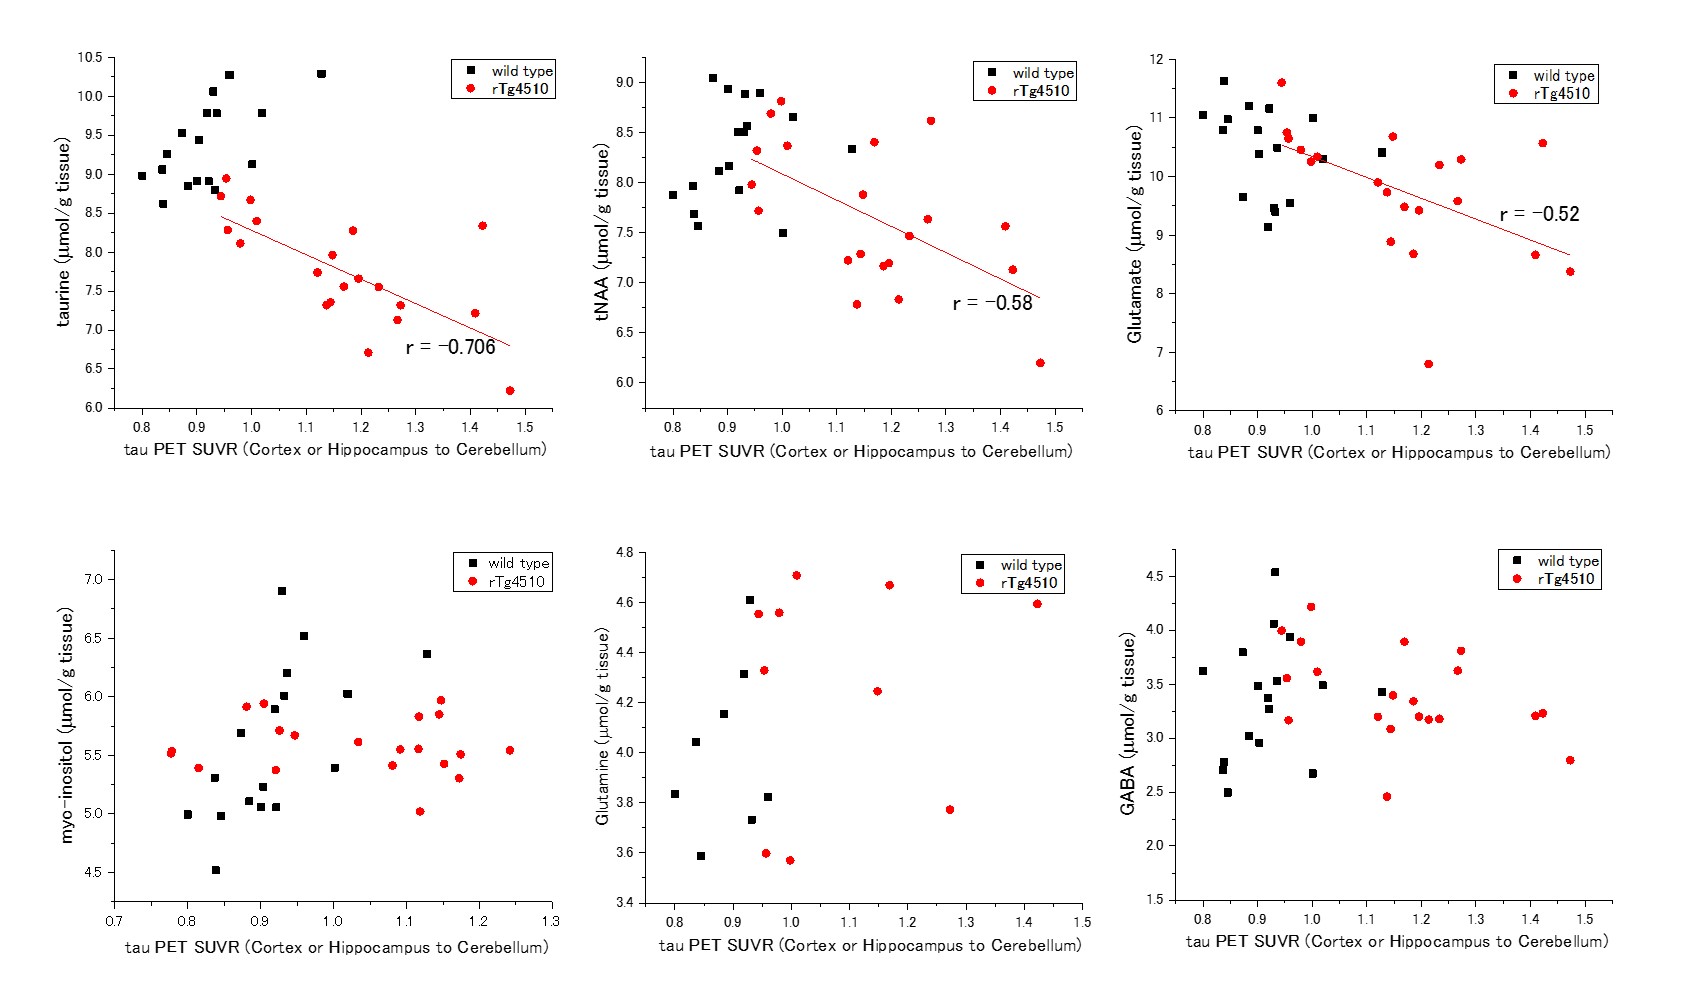
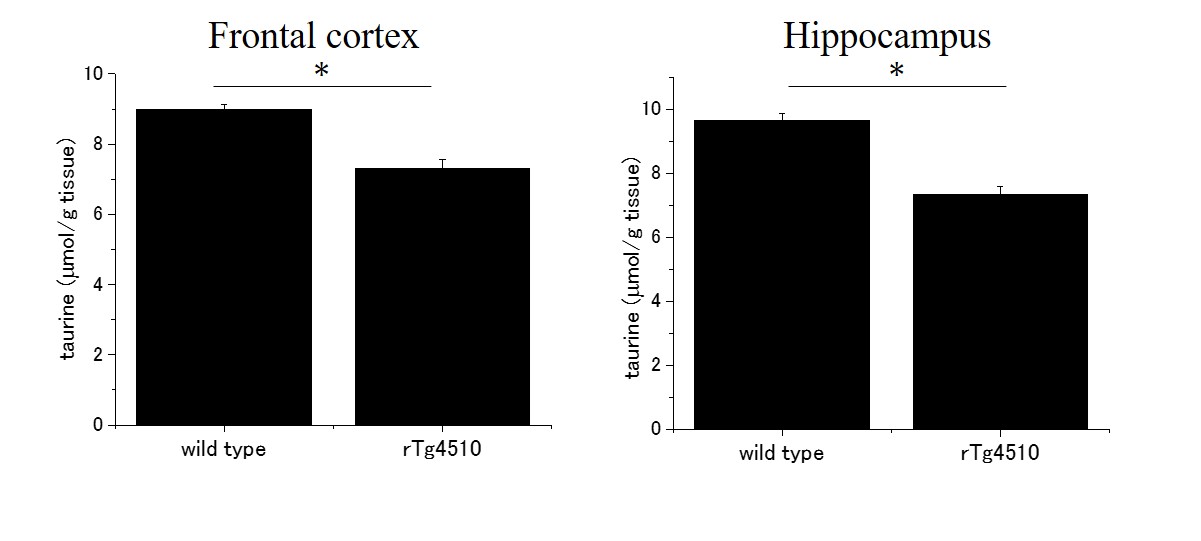
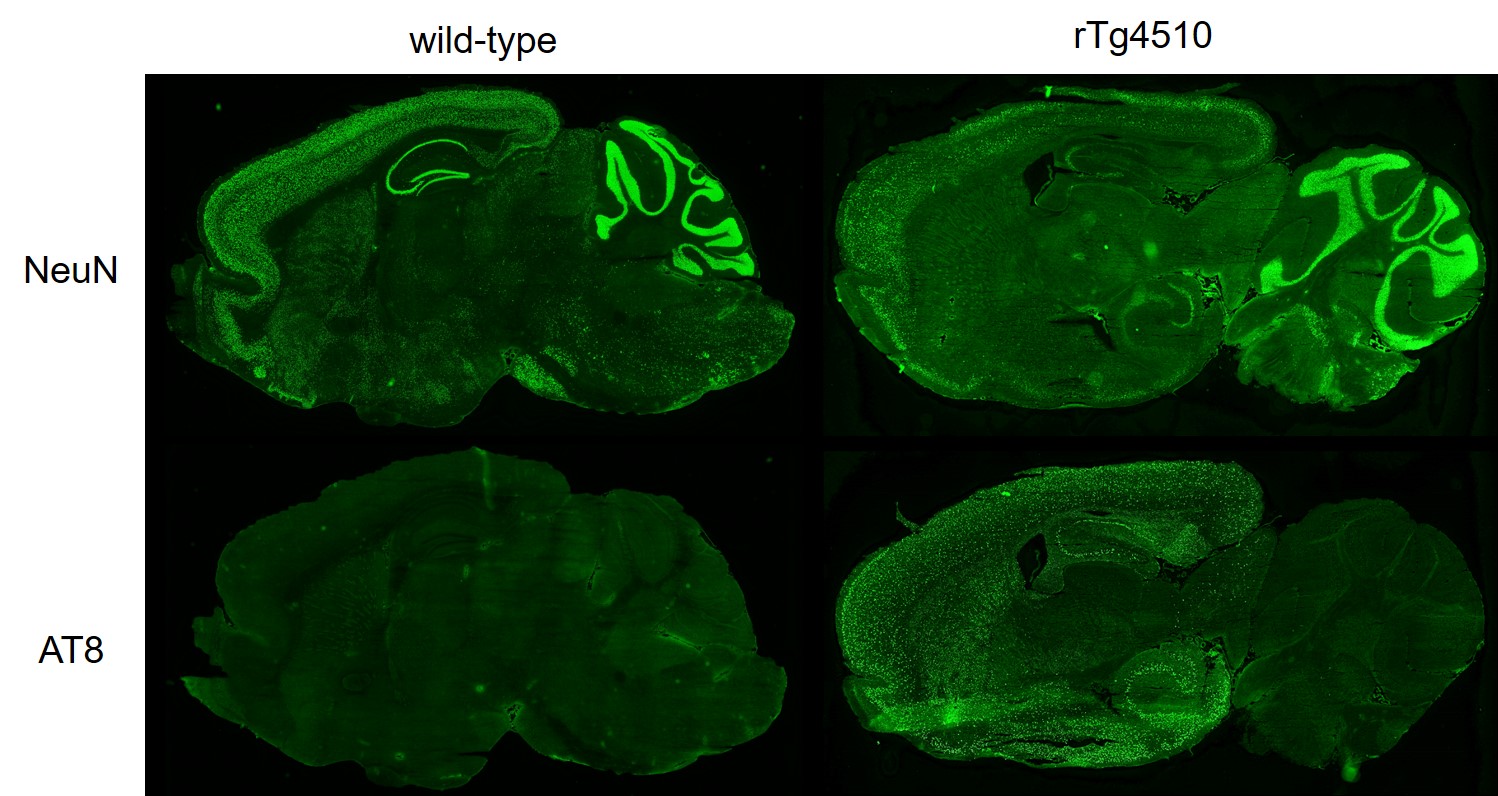
Typical spectra and tau PET images of rTg4510 and wild-type mice at the age of 6 months were shown in the Fig. 1. The correlations between metabolites and tau load were shown in the Fig. 2. While tau load detected by tau PET had correlations with the concentrations of taurine (r = −0.706), tNAA (r = −0.58), and Glu (r = −0.52), there were no significant correlations with myoinositol, Gln, and GABA (Fig. 2). There was a significant difference in taurine concentrations (Fig. 3; p < 0.05), which had the strongest correlation with tau load among the metabolites, between rTg4510 and wild-type mice at the age of 6 months. Immunostaining by AT8 showed abundant tau in the cortex and hippocampus of rTg4510 mice (Fig. 4). NeuN showed that neural loss was evident in the rTg4510 mouse (Fig. 4).DISCUSSION
This is the first study which investigated the association between tau load detected by PET and brain metabolites using tauopathy model mice in vivo. Among brain metabolites, taurine had the strongest negative correlation with tau accumulation. It is reported that taurine has a therapeutic effect on amyloid precursor protein knockout (APP KO) mice (4). To our knowledge, the association between taurine and tau has not been reported yet. The amount of tau load also had negative correlations with tNAA as well as Glu, indicating that tau might reduce those metabolites selectively and caused neural impairment.CONCLUSION
We demonstrated that the amount of tau had negative correlations with the amount of taurine, tNAA, and glutamate, indicating that tau might reduce those metabolites selectively and caused neural impairment. Multimodal imaging could be valuable for elucidating the new pathophysiology of the disease.Acknowledgements
No acknowledgement found.References
1. Maruyama M, Shimada H, Suhara T, Shinotoh H, Ji B, Maeda J, et al. Imaging of tau pathology in a tauopathy mouse model and in Alzheimer patients compared to normal controls. Neuron. 2013;79(6):1094-108.
2. Kantarci K, Lowe V, Przybelski SA, Senjem ML, Weigand SD, Ivnik RJ, et al. Magnetic resonance spectroscopy, beta-amyloid load, and cognition in a population-based sample of cognitively normal older adults. Neurology. 2011;77(10):951-8.
3. Spires TL, Orne JD, SantaCruz K, Pitstick R, Carlson GA, Ashe KH, et al. Region-specific dissociation of neuronal loss and neurofibrillary pathology in a mouse model of tauopathy. Am J Pathol. 2006;168(5):1598-607.
4. Kim HY, Kim HV, Yoon JH, Kang BR, Cho SM, Lee S, et al. Taurine in drinking water recovers learning and memory in the adult APP/PS1 mouse model of Alzheimer's disease. Scientific reports. 2014;4:7467.
Figures