4975
Chemical Exchange Saturation Transfer Imaging of Glutamate (GluCEST) in a Rat Model of Epilepsy using Proton Magnetic Resonance Spectroscopy (1H-MRS) at 7TDo-Wan Lee1, Jae-Im Kwon2, Dong-Hoon Lee3, Chul-Woong Woo2, Sang-Tae Kim2, Jin Seong Lee4, Choong Gon Choi4, Kyung Won Kim4, Jeong Kon Kim4, and Dong-Cheol Woo5,6
1Center for Bioimaging of New Drug Development, and MR Core Laboratory, Asan Institute for Life Sciences, Asan Medical Center, Seoul, Republic of Korea, 2MR Core Laboratory, Asan Institute for Life Sciences, Asan Medical Center, Seoul, Republic of Korea, 3Faculty of Health Sciences and Brain & Mind Centre, The University of Sydney, Sydney, Australia, 4Department of Radiology, Asan Medical Center, University of Ulsan College of Medicine, Seoul, Republic of Korea, 5MR Core Laboratory, Asan Institute for Life Sciences, Asan Medical Center, University of Ulsan College of Medicine, Seoul, Republic of Korea, 6Department of Convergence Medicine, Asan Medical Center, University of Ulsan College of Medicine, Seoul, Republic of Korea
Synopsis
Chemical exchange saturation transfer imaging of glutamate (GluCEST) is a novel magnetic resonance imaging (MRI) method for measuring brain glutamate (Glu) in humans and animals. In vivo quantification of neurotransmitter signals can provide insight into functional roles of brain structures and knowledge about biochemical compounds. This study, based on quantified GluCEST contrast values and 1H-MR spectral concentrations, assessed signal changes in control rats and rats with kainic acid-induced epileptic seizures, and showed that in vivo GluCEST and 1H-MR spectral data can provide valuable information for interpreting changes in signals and concentrations of specific cerebral metabolites in kainic acid-induced rats.
INTRODUCTION
Alterations of cellular and neurochemical mediators involved in epileptic seizures can worsen or prolong seizure activity, and may result in excitotoxicity.1,2 Epileptic seizures might result from an increase in glutamate-mediated excitation or a reduction in gamma-aminobutyric acid (GABA)-mediated inhibition.3 The present study aimed to provide images of epileptic seizure-induced regional glutamate (Glu) contrast maps (asymmetric magnetization transfer ratio [MTRasym] at 3.0-ppm) and neurochemical changes in the rat brain, using in vivo chemical exchange saturation transfer (GluCEST) imaging and proton magnetic resonance spectroscopy (1H-MRS).METHODS
Fifteen male Wistar rats were divided into two groups (control-[CTRL]-group: n = 7; kainate-induced-[KAI]-group: n = 8). Kainic acid was administered intraperitoneally, using a dose of 15 mg/kg, to induce epileptic seizures. All MR imaging assessments were carried out using a Bruker-7T scanner. Imaging and spectroscopic data were acquired at seven time points (every hour). A T2-weighted slice was selected for GluCEST imaging, with parameters as follows: Turbo-RARE-pulse-sequence, TR/TE = 4,200/36.4 ms, echo-spacing = 6.1 ms, RARE-factor = 16, average = 1, field-of-view = 30 × 30 mm2, matrix = 96 × 96, slice-thickness = 1 mm, and inter-pulse-delay = 0.01 ms. CEST datasets with 31 frequency offsets (S0 and -5 ~ +5 ppm @ 0.33-ppm intervals) were acquired with a continuous-wave RF saturation pulse (power/time=5.6-μT/1-s). All Z-spectra and MTRasym curves were estimated from B0 and B1 corrected images. The GluCEST contrast maps were generated by a relative change in percentage units as follows: GluCEST(%) = 100×(S−ve – S+ve)/S−ve. Where S-ve and S+ve in the equation are B0 corrected signals at –3 and +3-ppm from bulk water, respectively. All procedures were performed based on ROI or pixel-by-pixel methods. Three ROIs from the cortex, hippocampus, and thalamus regions were carefully drawn on a control image (S0 image). After GluCEST imaging, all animals were assessed for 1H-MRS data. The VOI (2 × 2 × 3 mm3) position was targeted to the hippocampal region. Water-suppressed in vivo 1H-MRS spectra were obtained using a PRESS-sequence (TR/TE = 5000/16.3 ms, spectral-width = 5,000 Hz, average = 128, and number of data points = 2,048). Raw data acquired in vivo were analyzed using LCModel with a simulated basis-set. Comparisons between CTRL and KAI groups were made using nonparametric ANOVA (Friedman) as well as Wilcoxon signed-rank and Mann-Whitney U-tests. Due to the non-normal distribution of neurobiological variables, relationships between the neurochemical concentrations and GluCEST imaging contrast values were examined using Spearman's rank correlation coefficient.RESULTS AND DISCUSSION
In the kainic acid-induced model, we observed different signal intensities and Glu contrasts calculated from Z-spectra and MTRasym curves in the cortex, hippocampus, and thalamus (Fig. 1). According to results comparing CTRL and KAI groups (Fig. 2), Glu signals in the hippocampal region in KAI rats were significantly higher than those in the CTRL rats at 2-3 hours (during the fourth and fifth scans) following injection (all p<0.05). Notably, the Glu signals in post-injection scans gradually increased compared to those in the baseline scan (all p<0.05; cortex: at fourth and sixth scans; hippocampus: at fourth and fifth scans; and thalamus: at fourth scan), and then decreased after the fourth or fifth scans. Our results and previous studies4-6 suggest that significant enhancement of Glu concentrations or signals may indicate increased release of Glu, resulting in increased electrical irritability, thereby promoting excitotoxicity. In the in vivo 1H-MRS of the hippocampal region, 15 neurochemical signals were clearly observed (Fig. 3). In the results comparing CTRL and KAI groups (Fig. 4), Glu, myo-inositol (mIns), and glycerophosphocholine plus phosphocholine (GPC+PCh) concentrations in KAI rats were significantly higher than in CTRL rats according to time after injection, in the hippocampal region (Glu: at fifth and sixth scans, all p<0.05; mIns: fourth [p<0.05], fifth [p<0.01], and sixth scans [p<0.05]; and GPC+PCh: fourth [p<0.005] and fifth scans [p<0.05]). Moreover, the Glu and mIns concentrations in post-scan data of KAI rats were significantly higher than in baseline scans (all p<0.05; Glu: at the fifth scan; and mIns: fourth and fifth scans). Based on our results and previous studies, significantly increased mIns and GPC+PCh concentrations may be implicated in intracellular signaling and osmoregulation,4,7 as well as transient membrane breakdown induced by seizure activity.8,9CONCLUSION
The present study demonstrates that in vivo GluCEST imaging and 1H-MRS data provide remarkable neurobiological information for interpreting time-dependent influences in the hippocampal region in a rat model of KAI epileptic seizures. Our main findings, which exhibited significant alterations in GluCEST contrast signals and neurochemical concentrations in a comparison between CTRL and KAI rats, suggest that the results can be utilized as key markers of epileptic seizure status.Acknowledgements
This study was supported by grants from the Basic Science Research Program through the National Research Foundation of Korea [NRF-2015R1C1A1A02036526] and the Korea Health Technology R&D Project through the Korea Health Industry Development Institute [HI14C1090], funded by the Ministry of Health & Welfare, Republic of Korea.References
1. Meldrum BS. The role of glutamate in epilepsy and other CNS disorders. Neurology 1994;44:14-23. 2. Meurs A, Clinckers R, Ebinger G, et al. Seizure activity and changes in hippocampal extracellular glutamate, GABA, dopamine and serotonin. Epilepsy Res 2008;78(1):50-59. 3. During MJ and Spencer DD. Extracellular hippocampal glutamate and spontaneous seizure in the conscious human brain. Lancet 1993;341:1607-1610. 4. Doelken MT, Stefan H, Pauli E, et al. 1H-MRS profile in MRI positive- versus MRI-negative patients with temporal lobe epilepsy. Seizure 2008;17:490-497. 5. Duncan JS. Imaging and epilepsy. Brain 1997;120(Pt 2):339-377. 6. Petroff OA, Errante LD, Kim JH, et al. N-acetyl-aspartate, total creatine, and myo-inositol in the epileptogenic human hippocampus. Neurology 2003;60:1646-1651. 7. Fisher SK, Novak JE, Agranoff BW. Inositol and higher inositol phosphates in neural tissues: homeostasis, metabolism and functional significance. J. Neurochem. 2002;82:736-754. 8. Briellmann RS, Wellard RM, Jackson GD. Seizure-associated abnormalities in epilepsy: evidence from MR imaging. Epilepsia 2005;46(5):760-766. 9. Lazeyras F, Blanke O, Zimine I, et al. 1H-MRS and functional MRI during and after prolonged nonconvulsive seizure activity. Neurology 2000;55:1677-1682.Figures
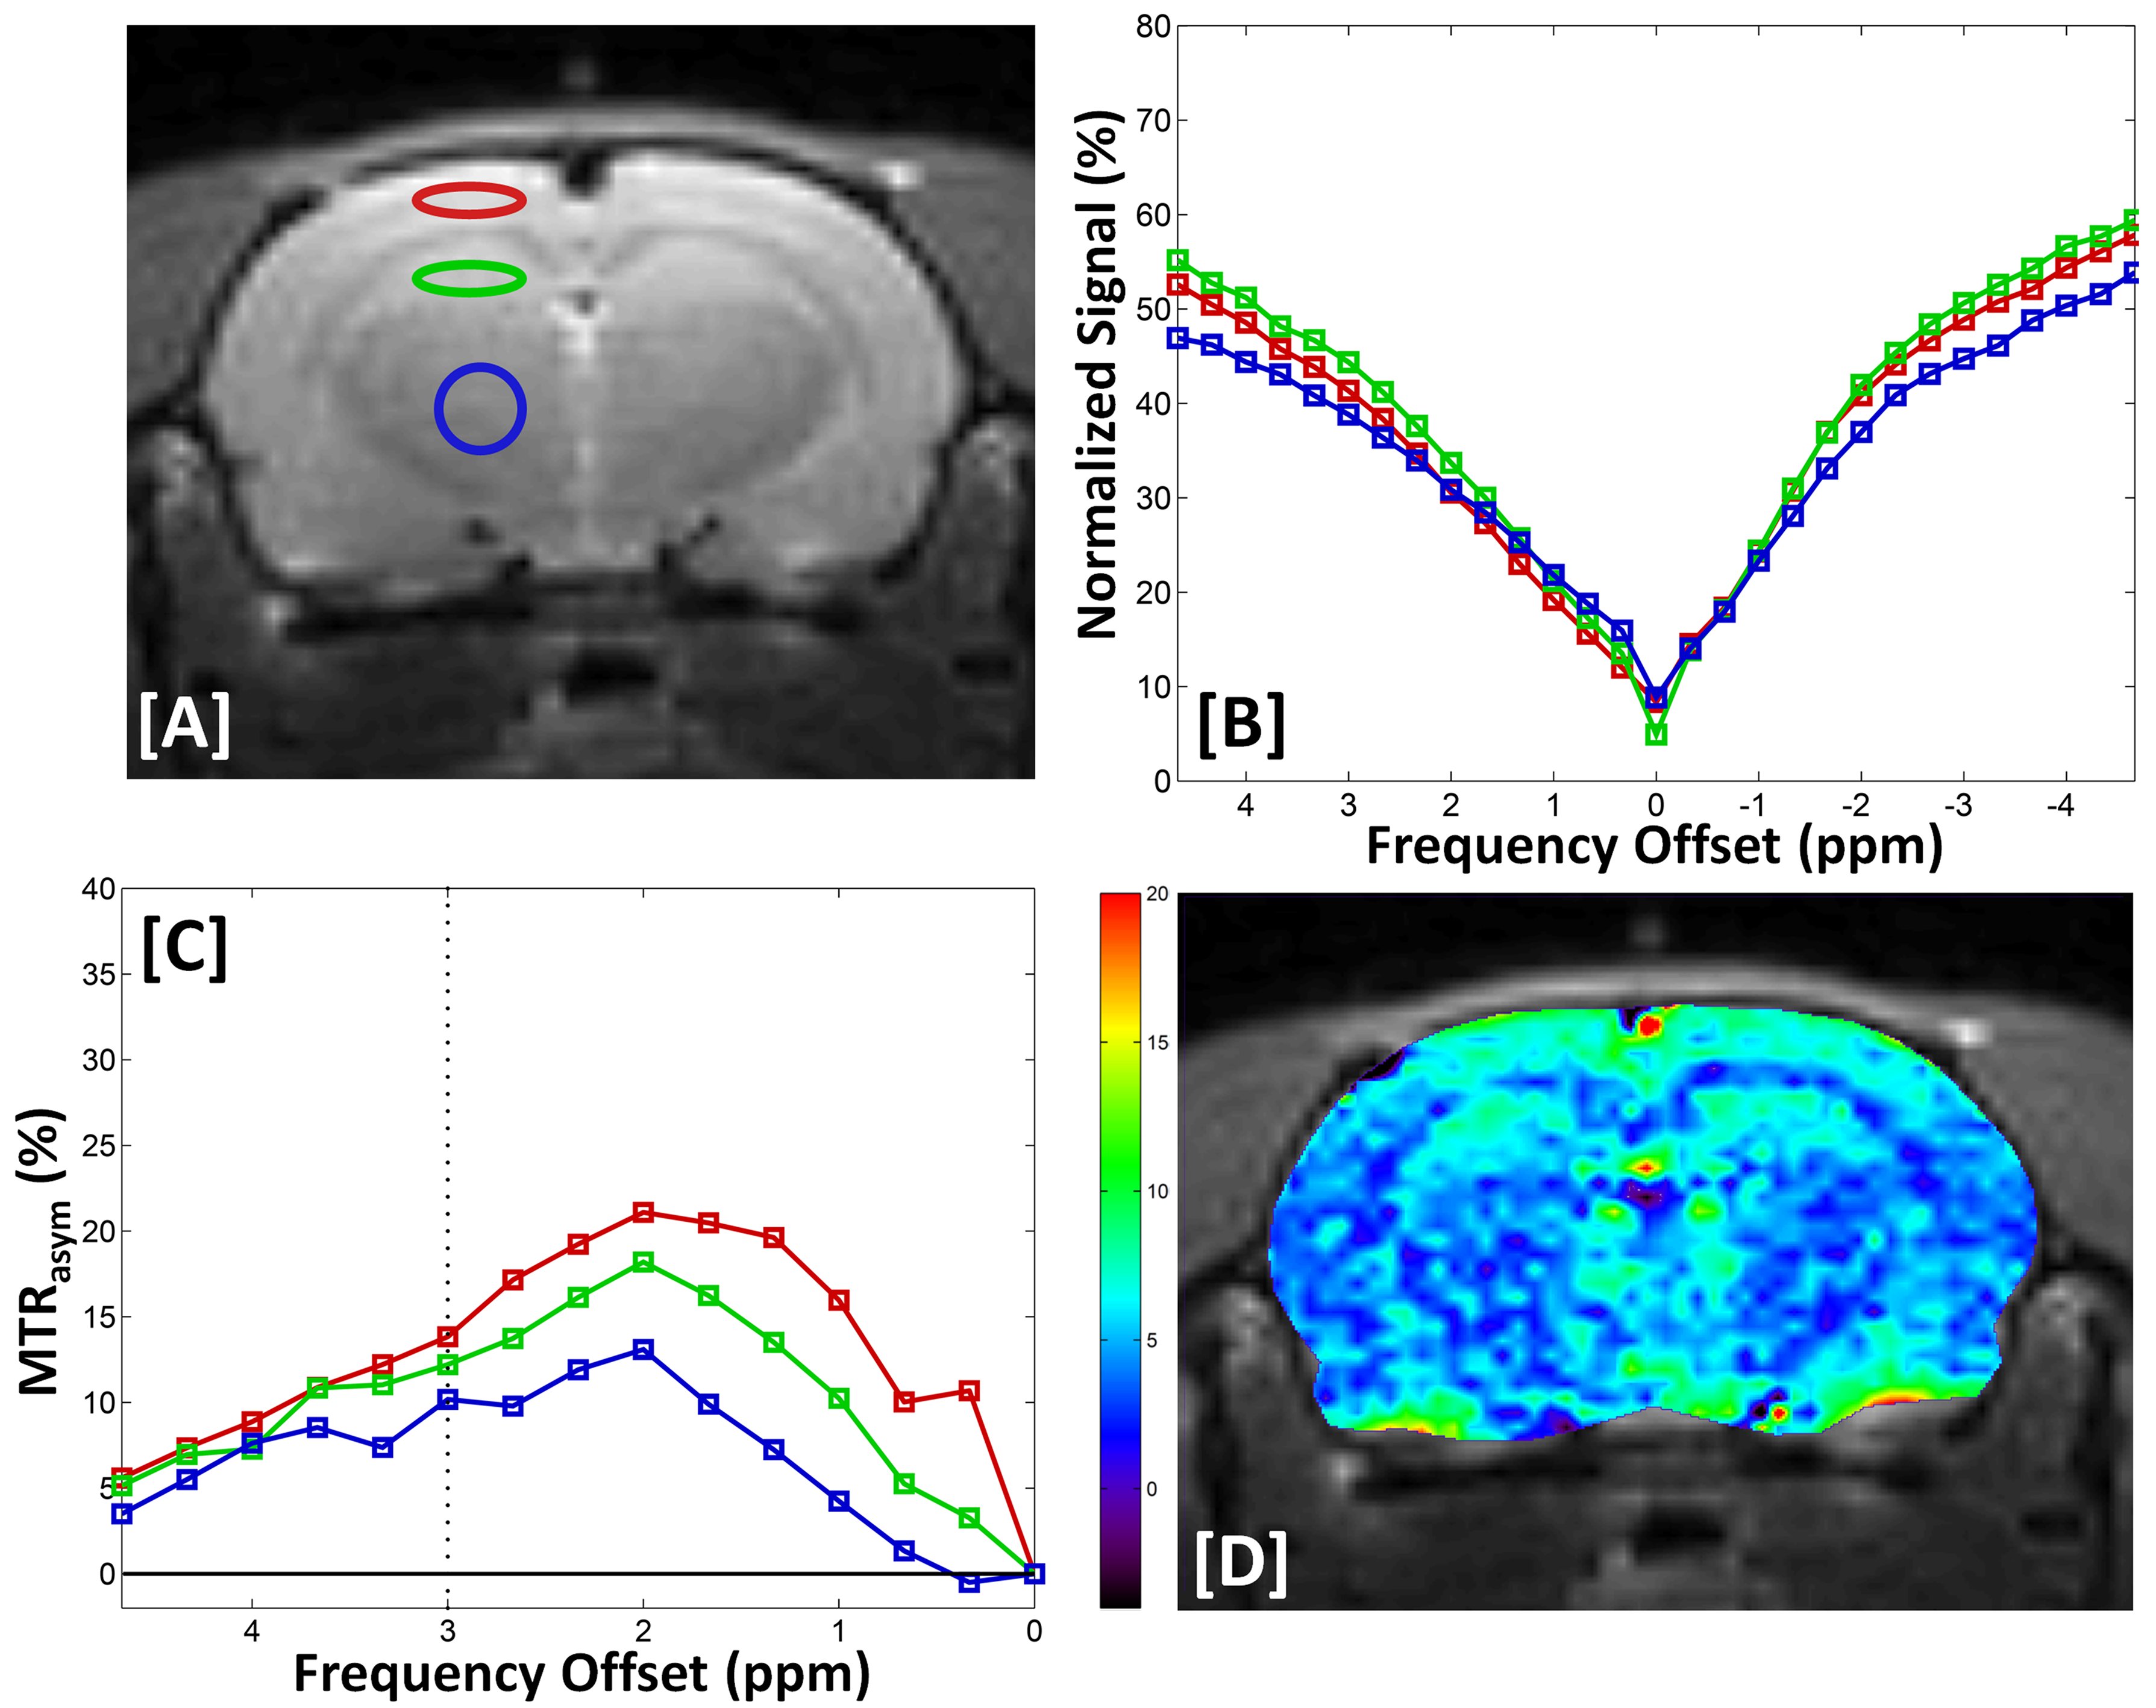
Figure. 1. Anatomical images with three
ROIs (A), experimentally acquired Z-spectral (Z+1400 to –1400 Hz) signal
intensity (B), MTRasym(%) curves for three regions (C), and GluCEST
contrast map in KAI rats at 1 hour after kainic acid injection (D).
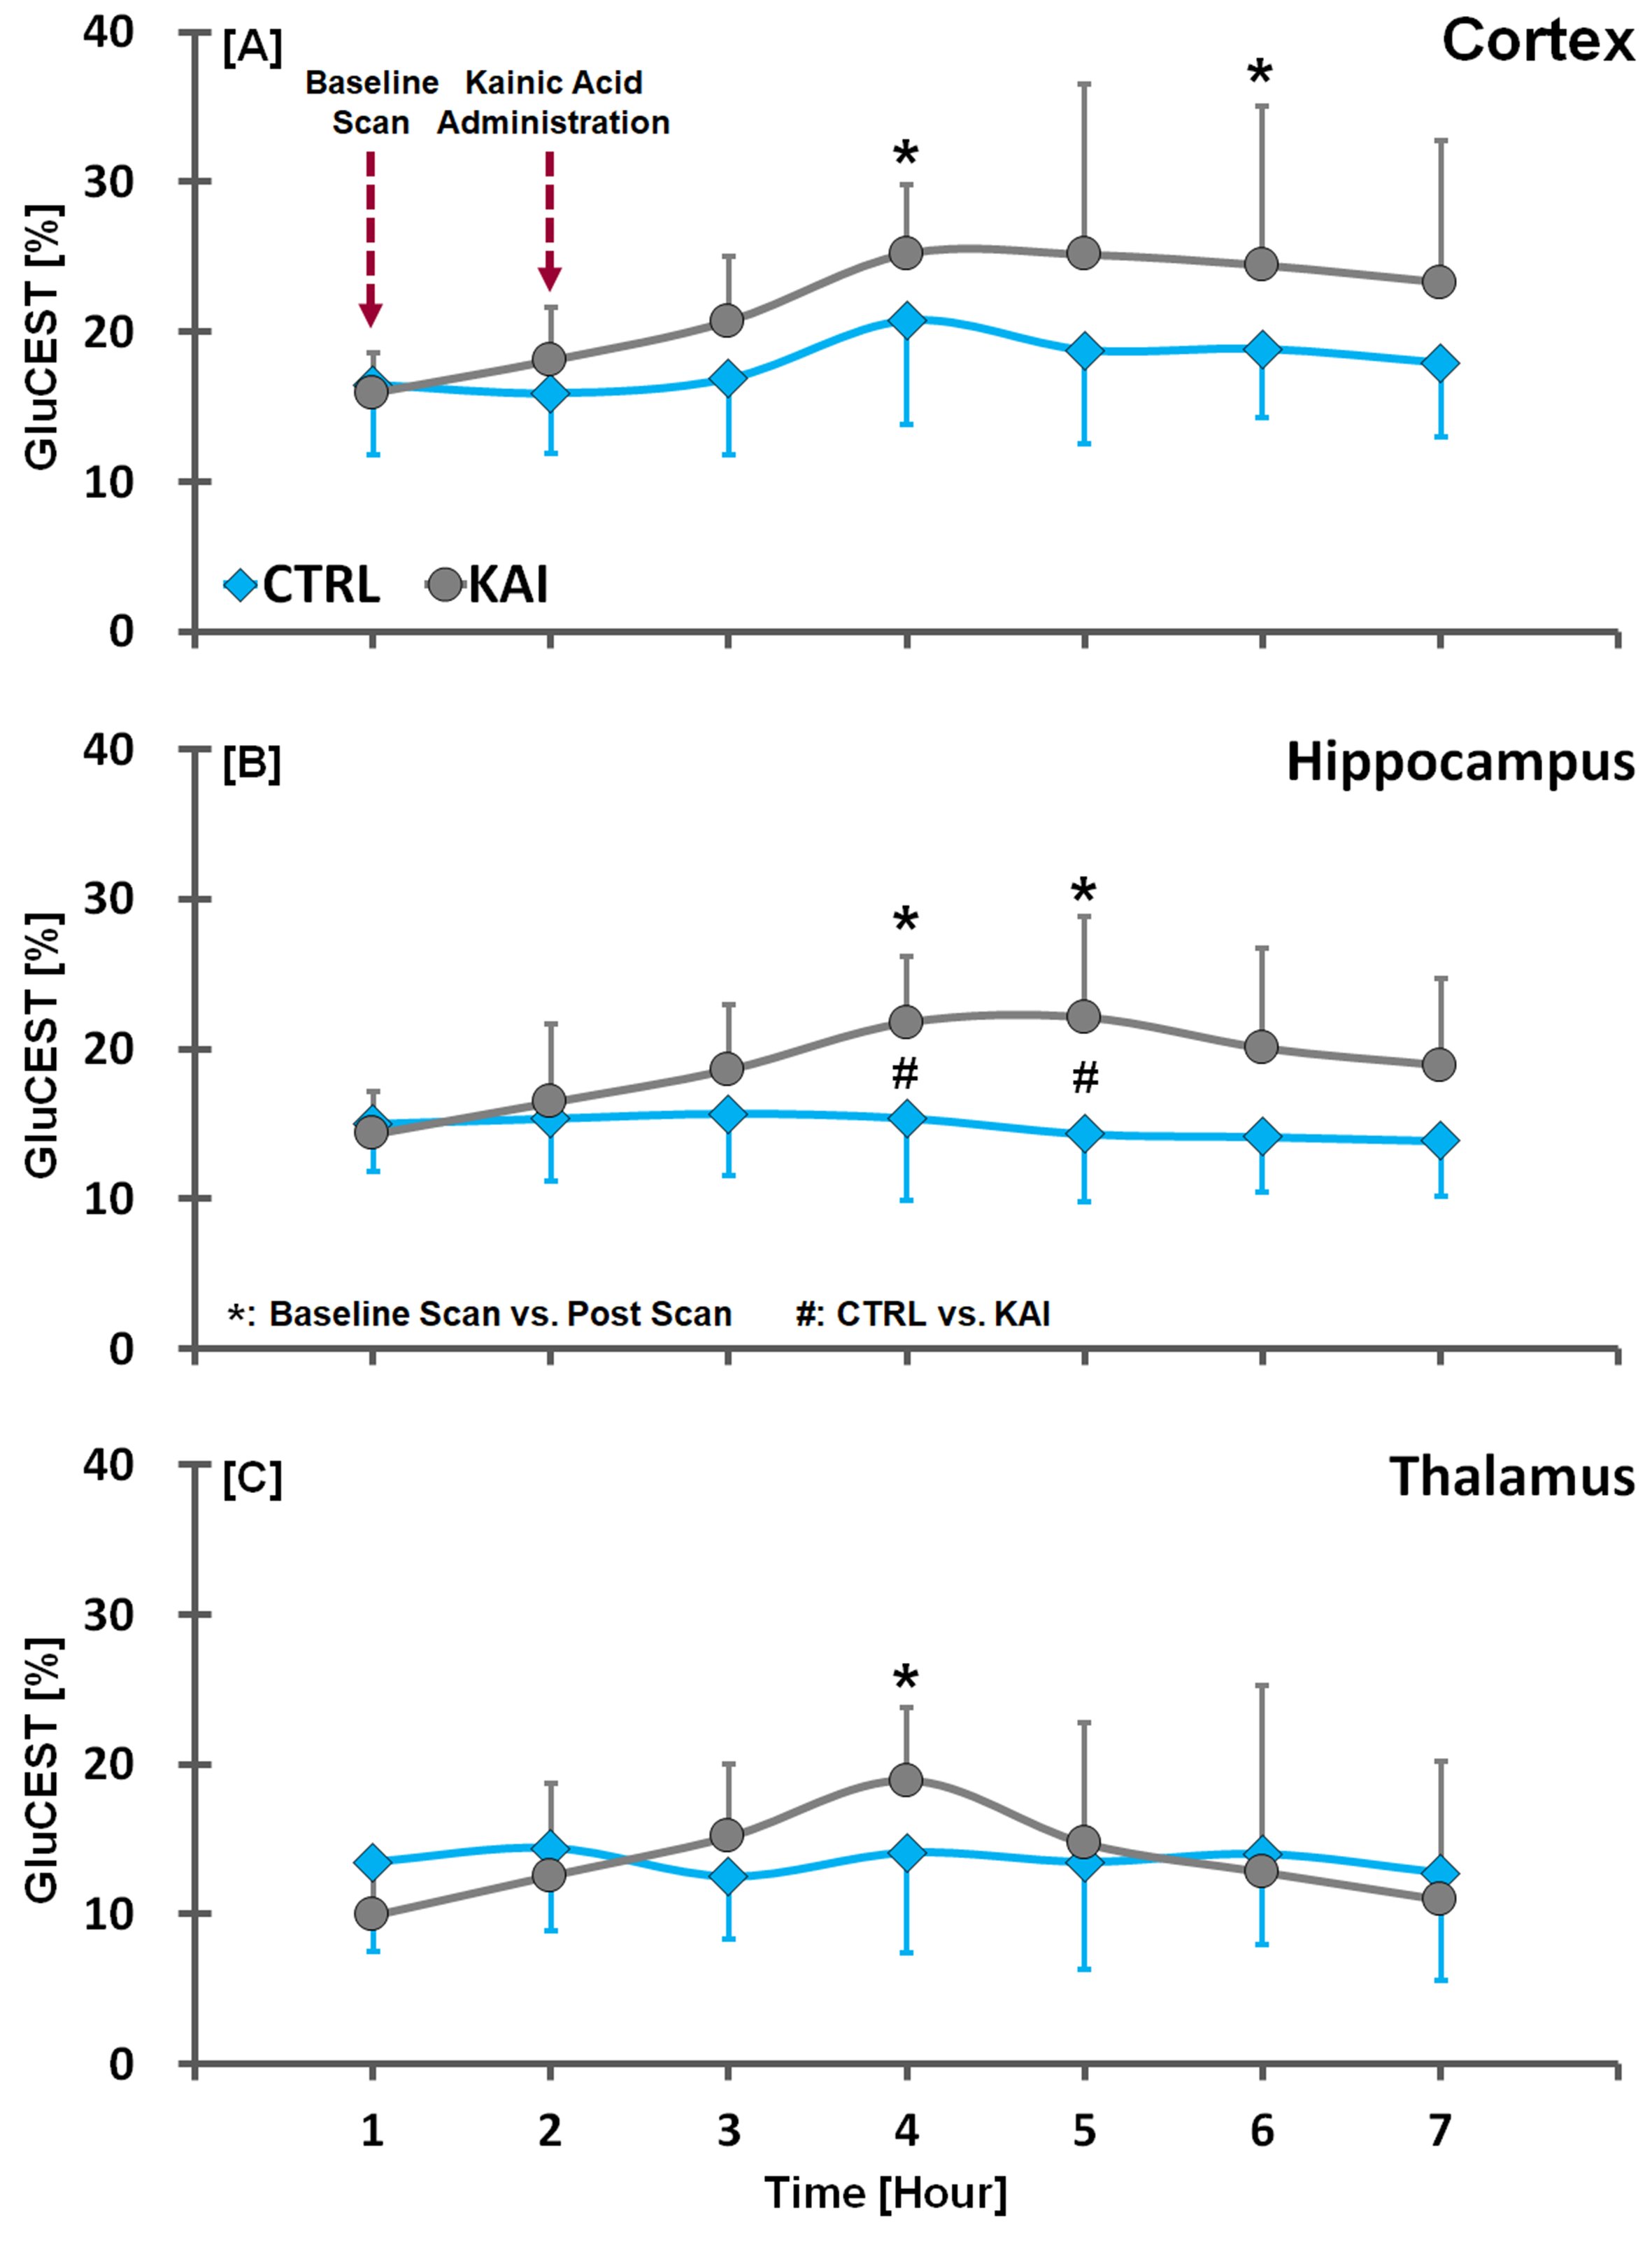
Figure. 2. GluCEST time-contrast profiles
in the cortex (A), hippocampus (B), and thalamus (C) of CTRL and KAI groups,
quantified from GluCEST images. The vertical lines on each of the data indicate
the (+) or (-) standard deviation from the mean values of the metabolite
concentrations. Mean comparison in the CTRL and KAI groups were considered
significant when Mann Whitney U-test revealed #p<0.05. Mean comparison in
baseline and each post scans were considered significant when Wilcoxon signed
rank test revealed *p<0.05.
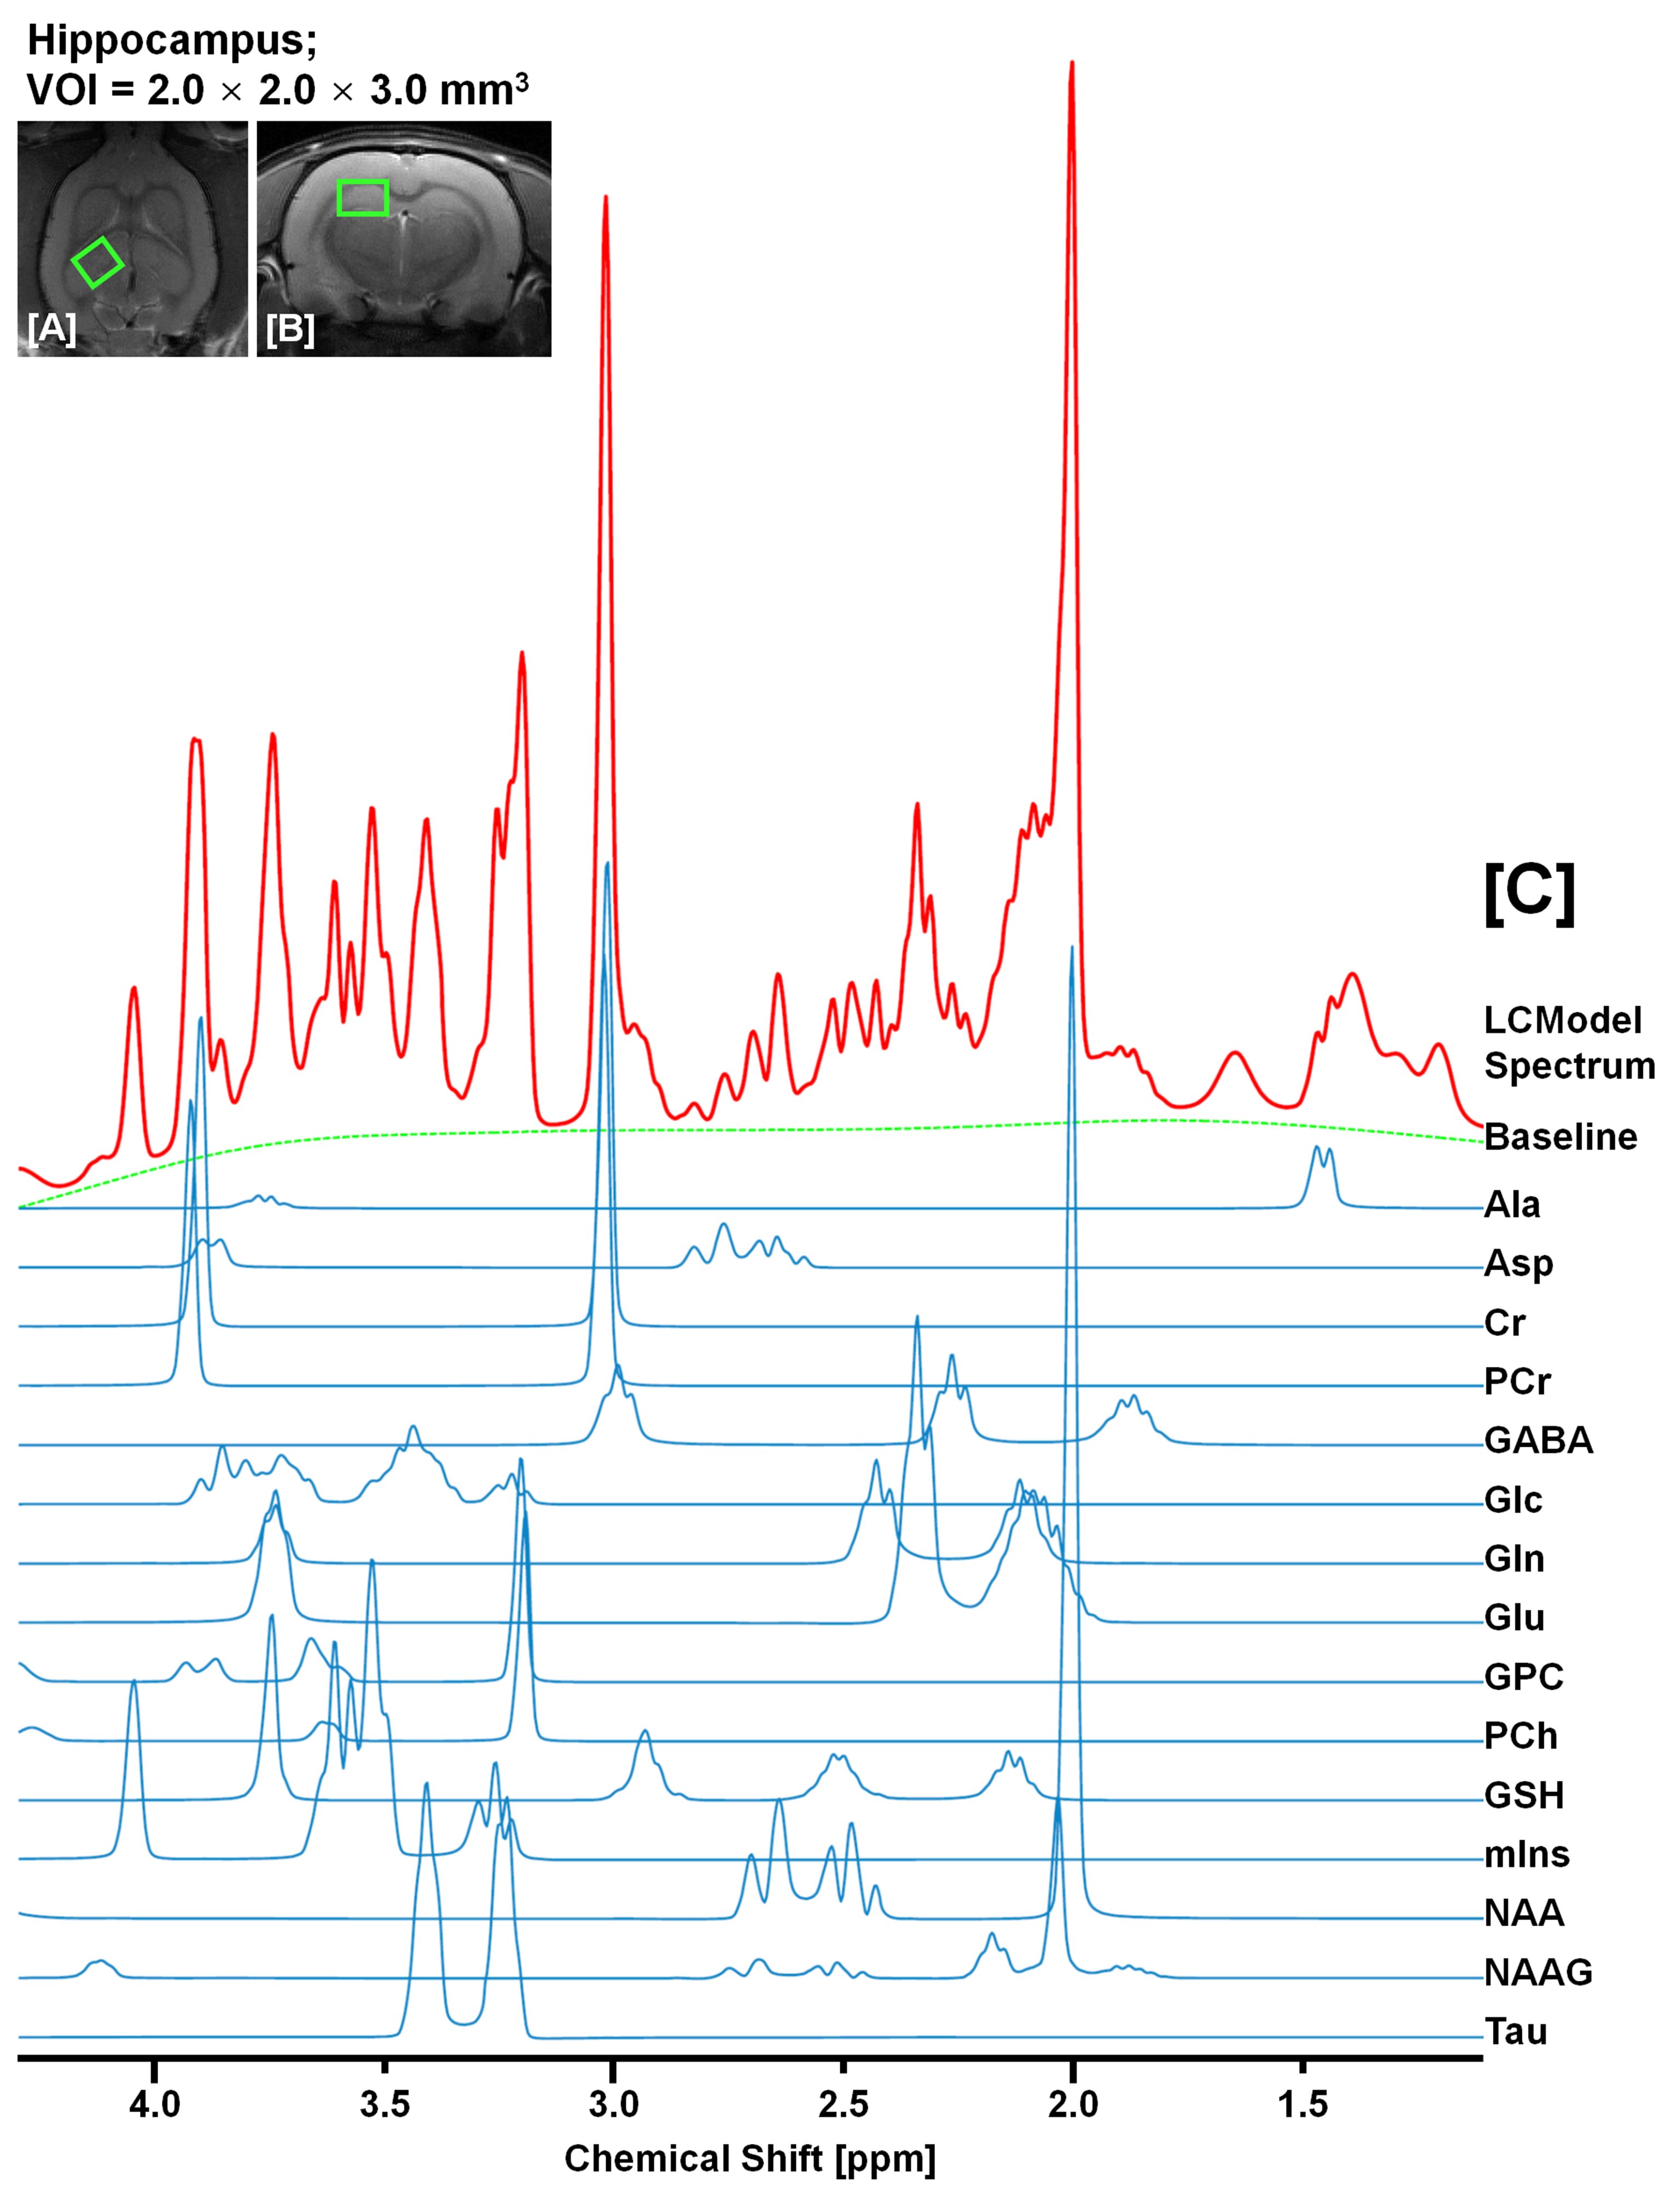
Figure. 3. Quantification of 15
neurochemical signals from in vivo 1H
MRS in hippocampal region of KAI model. The illustrations completely
discriminated fitted spectrum (red), baseline (green), and each
neuro-metabolite signal (blue) from the obtained in vivo 1H spectrum at 7 T.
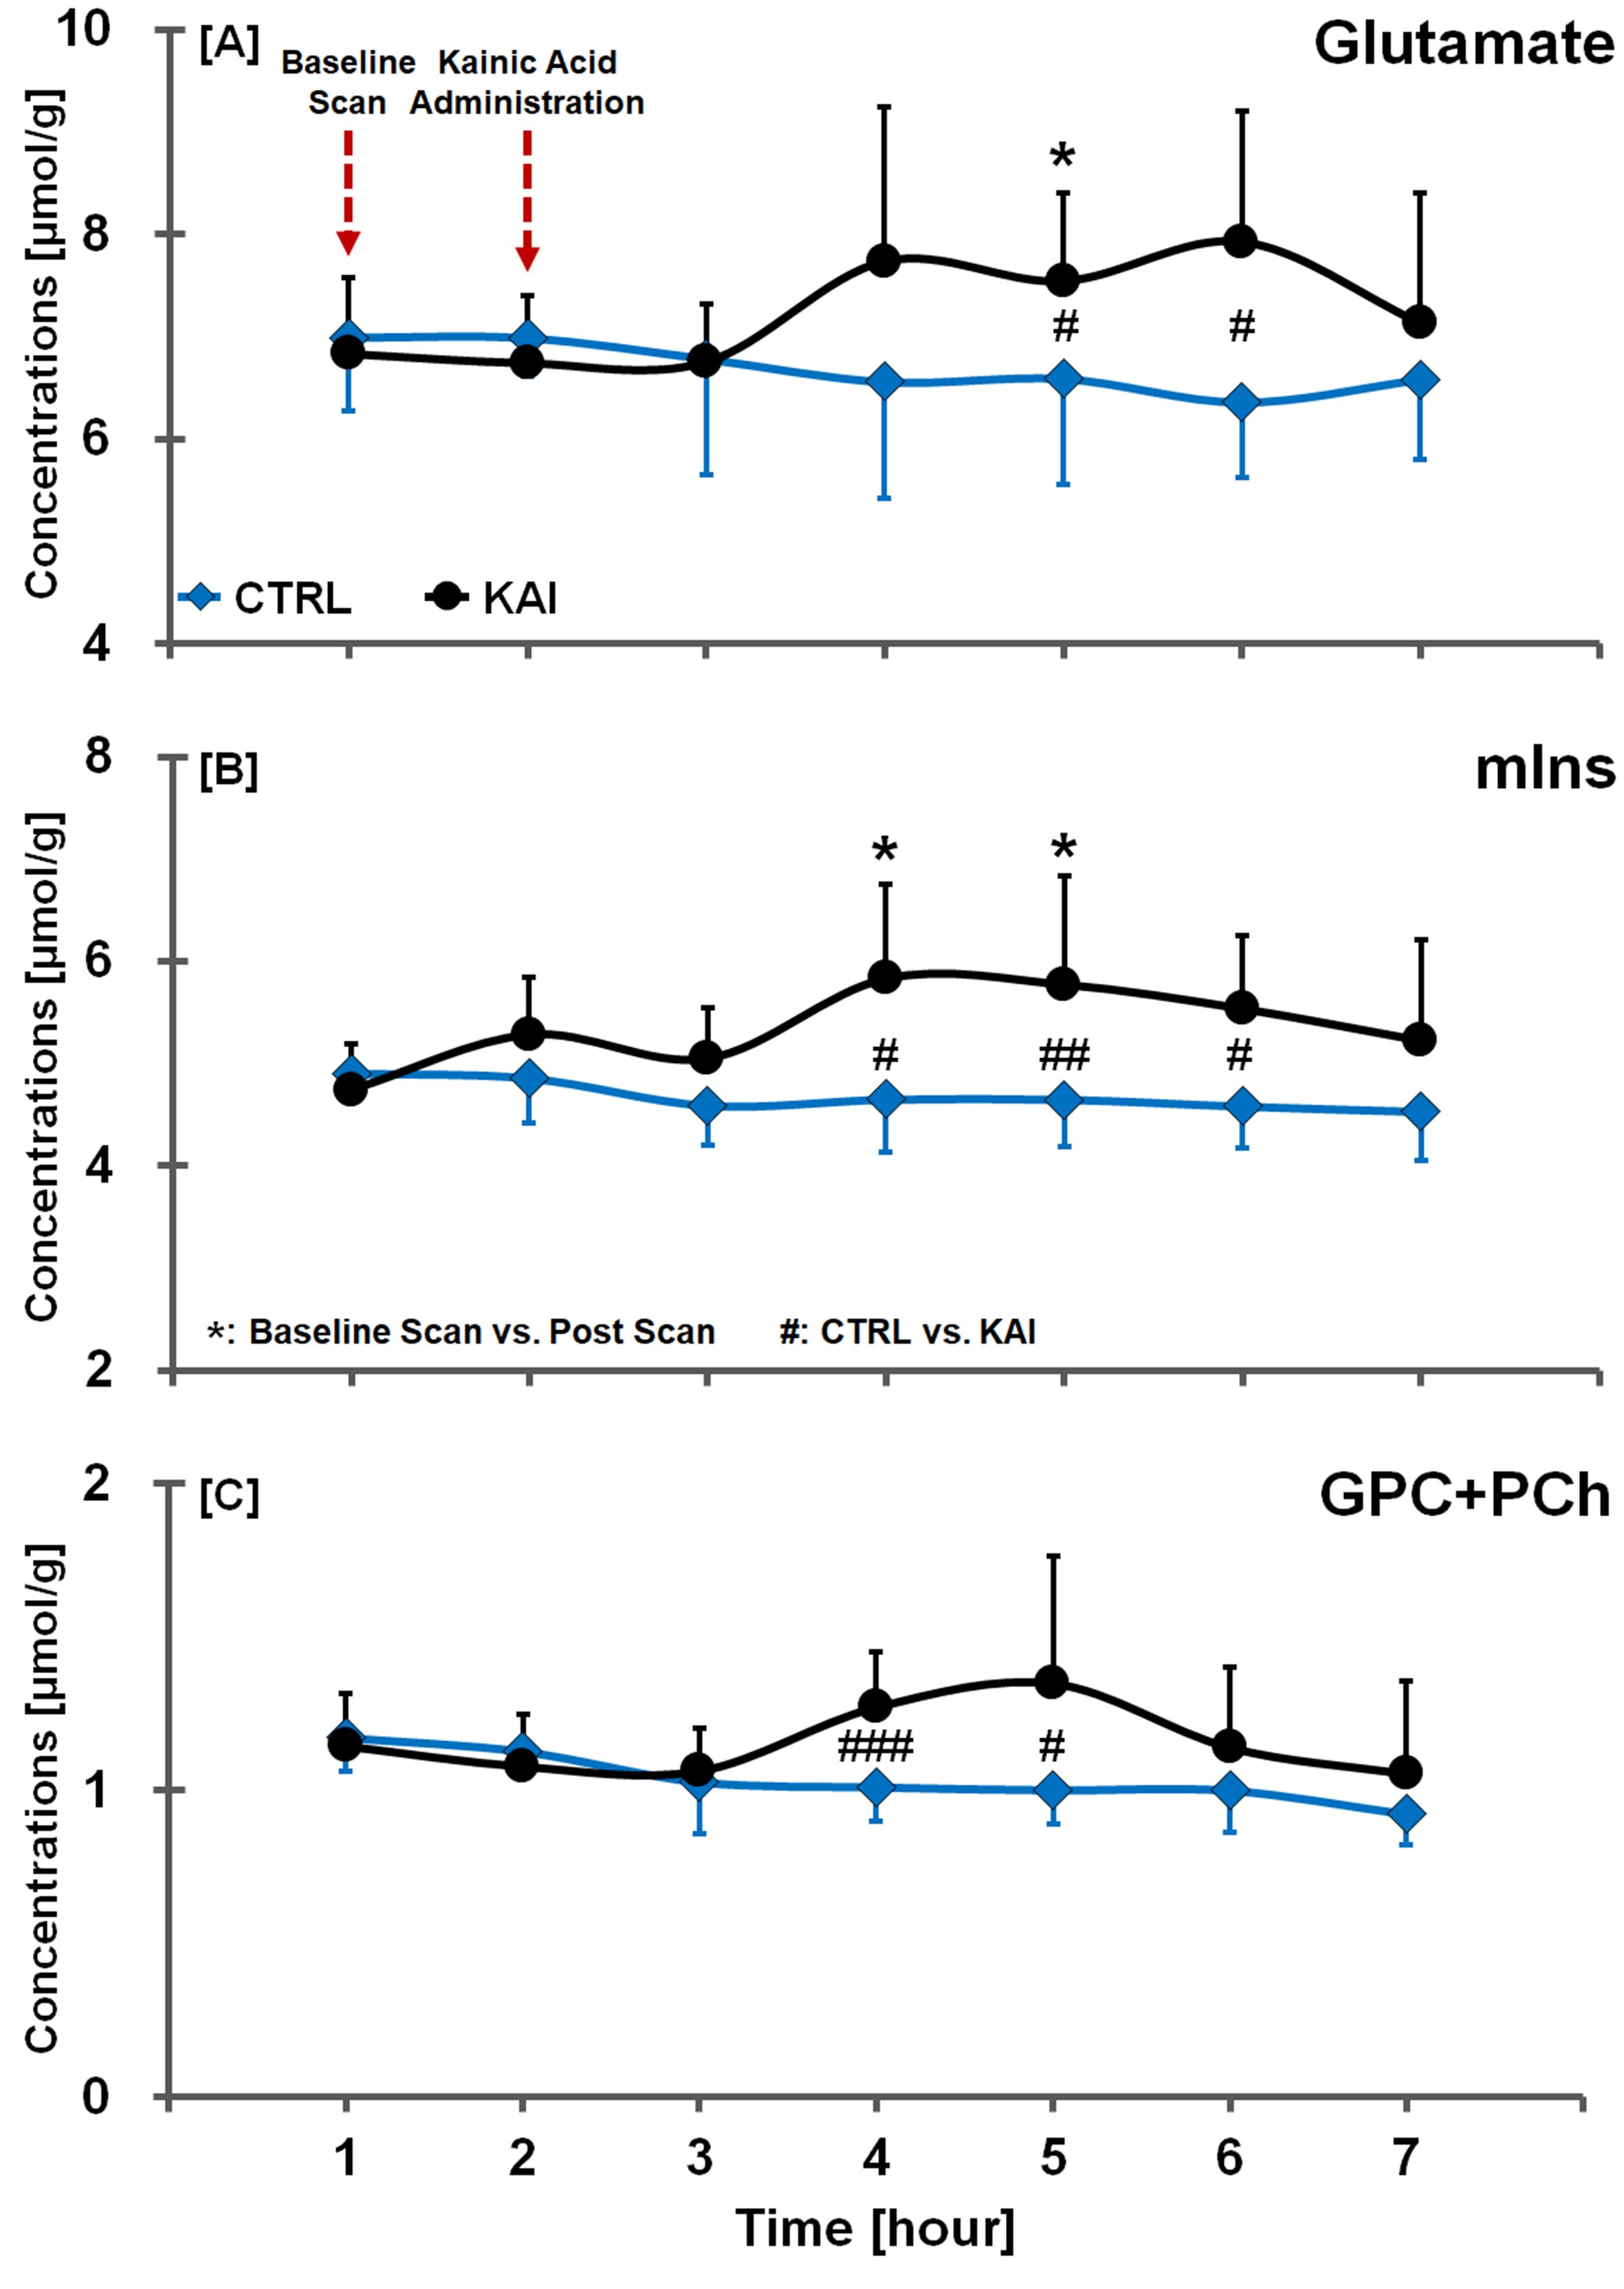
Figure. 4. Glutamate (A), mIns (B) and
GPC+PCh (C) time-concentration profiles in hippocampal region of CTRL and KAI
groups, quantified from LCModel fitted spectra. The vertical lines on each
graph indicate the (+) or (-) standard deviation from the mean values of the
metabolite concentrations. Mean comparisons between CTRL and KAI groups were
considered significant when the Mann-Whitney U-test showed #p<0.05, ##p<0.01, and ###p<0.005. Mean comparisons between baseline and
post-scans were considered significant when the Wilcoxon signed-rank test
showed *p<0.05.