4974
In Vivo Mapping and Quantification Approaches in Epileptic Seizure Rat Models Using Creatine Chemical Exchange Saturation Transfer (CrCEST) Imaging1Faculty of Health Sciences and Brain & Mind Centre, The University of Sydney, Sydney, Australia, 2Center for Bioimaging of New Drug Development, and MR Core Laboratory, Asan Institute for Life Sciences, Asan Medical Center, Seoul, Republic of Korea, 3MR Core Laboratory, Asan Institute for Life Sciences, Asan Medical Center, Seoul, Republic of Korea, 4Department of Radiology, Asan Medical Center, University of Ulsan College of Medicine, Seoul, Republic of Korea, 5MR Core Laboratory, Asan Institute for Life Sciences, Asan Medical Center, University of Ulsan College of Medicine, Seoul, Republic of Korea, 6Department of Convergence Medicine, Asan Medical Center, University of Ulsan College of Medicine, Seoul, Republic of Korea
Synopsis
CrCEST imaging is a novel imaging technique to provide in vivo image contrasts related with the changes of energy metabolism by creatine level changes. In this abstract, we attempted to evaluate signal changes in hippocampus at epileptic seizure rat models based on the quantified CrCEST signals. We also analyzed the correlations between CrCEST signals and PCr and PCr+Cr concentrations assessed by 1H-MRS spectra. Our results clearly showed that the CrCEST imaging can be a useful approach to evaluate the energy metabolism in hippocampus at epileptic seizure model, and to provide the quantitative results that related with creatine level changes.
Purpose
Creatine (Cr) plays a major role in the storage and transmission of phosphate-bound energy.1-3 Therefore, evaluating of creatine level changes are important studies in the clinic to estimate the brain energy metabolism. In recent years, chemical exchange saturation transfer (CEST) has become a new contrast enhancement technique that enables the indirect detection of molecules with exchangeable protons and exchange-related properties.1-4 The purpose of this study is to evaluate the creatine level of brain hippocampus by energy metabolism through involuntary movement when epileptic seizure was occurred. To visualize and quantitatively evaluate them, we used CrCEST imaging technique for detecting creatine level changes, and investigated correlations between the quantified CrCEST signals and PCr and PCr+Cr signals that are assessed by 1H-MRS spectra.Methods
MRI experiment: Epileptic seizure group was induced in five male Wistar rats by receiving one intraperitoneal injection of KA (15mg/kg), and control group was consisted with five rats. The MR imaging was obtained using 7T Bruker scanner at three different time points (before KA injection, 3-hours, and 5-hours after KA injection). Turbo-RARE sequence based CEST dataset with 25 frequency offsets (S0 image and -3.96~+3.96 ppm at intervals of 0.33 ppm) were acquired using a long continuous-wave RF saturation pulse (power=5.6μT, saturation time=1s). B0 maps with double echo-times (1.9 and 2.6ms) and B1 maps with double flip-angles (30° and 60°) were collected after CEST dataset acquisition to correct for B0 and B1 inhomogeneities.5,6 In addition, 1H-MRS spectra were obtained from a region in the hippocampal region (VOI; 2×2×3mm3; 12.0μL) at left cerebral hemisphere using a PRESS sequence with VAPOR (TR/TE=5000/16.3ms, spectral-width=5kHz, average=128, and number of data points=2048). Data processing: All KA injected CEST data were co-registered with a six-degree-of-freedom rigid body transformation using a non-KA injected CEST data as a reference data.7 Using B0 and B1 corrected dataset, CrCEST contrast was computed by subtracting the normalized magnetization signal at the 1.65 and 1.98 ppm from the magnetization at the corresponding reference frequency symmetrically at the upfield from water. The ROI for the calculation of the CrCEST values was set in hippocampus. 1H-MRS spectra were analyzed with a fully blind spectral process using LCModel with a simulated basis-set. All metabolite peaks were fitted in the chemical shift range from 4.3 to 0.3 ppm. For statistical analysis, Mann-Whitney U-test was used between the control and KA groups at each time point, and Wilcoxon signed rank test was used between time changes in each group. For the correlation analysis between the CrCEST signals and PCr and PCr+Cr concentrations, the Spearman's rank correlation coefficient (r) and p values were calculated.Results and Discussion
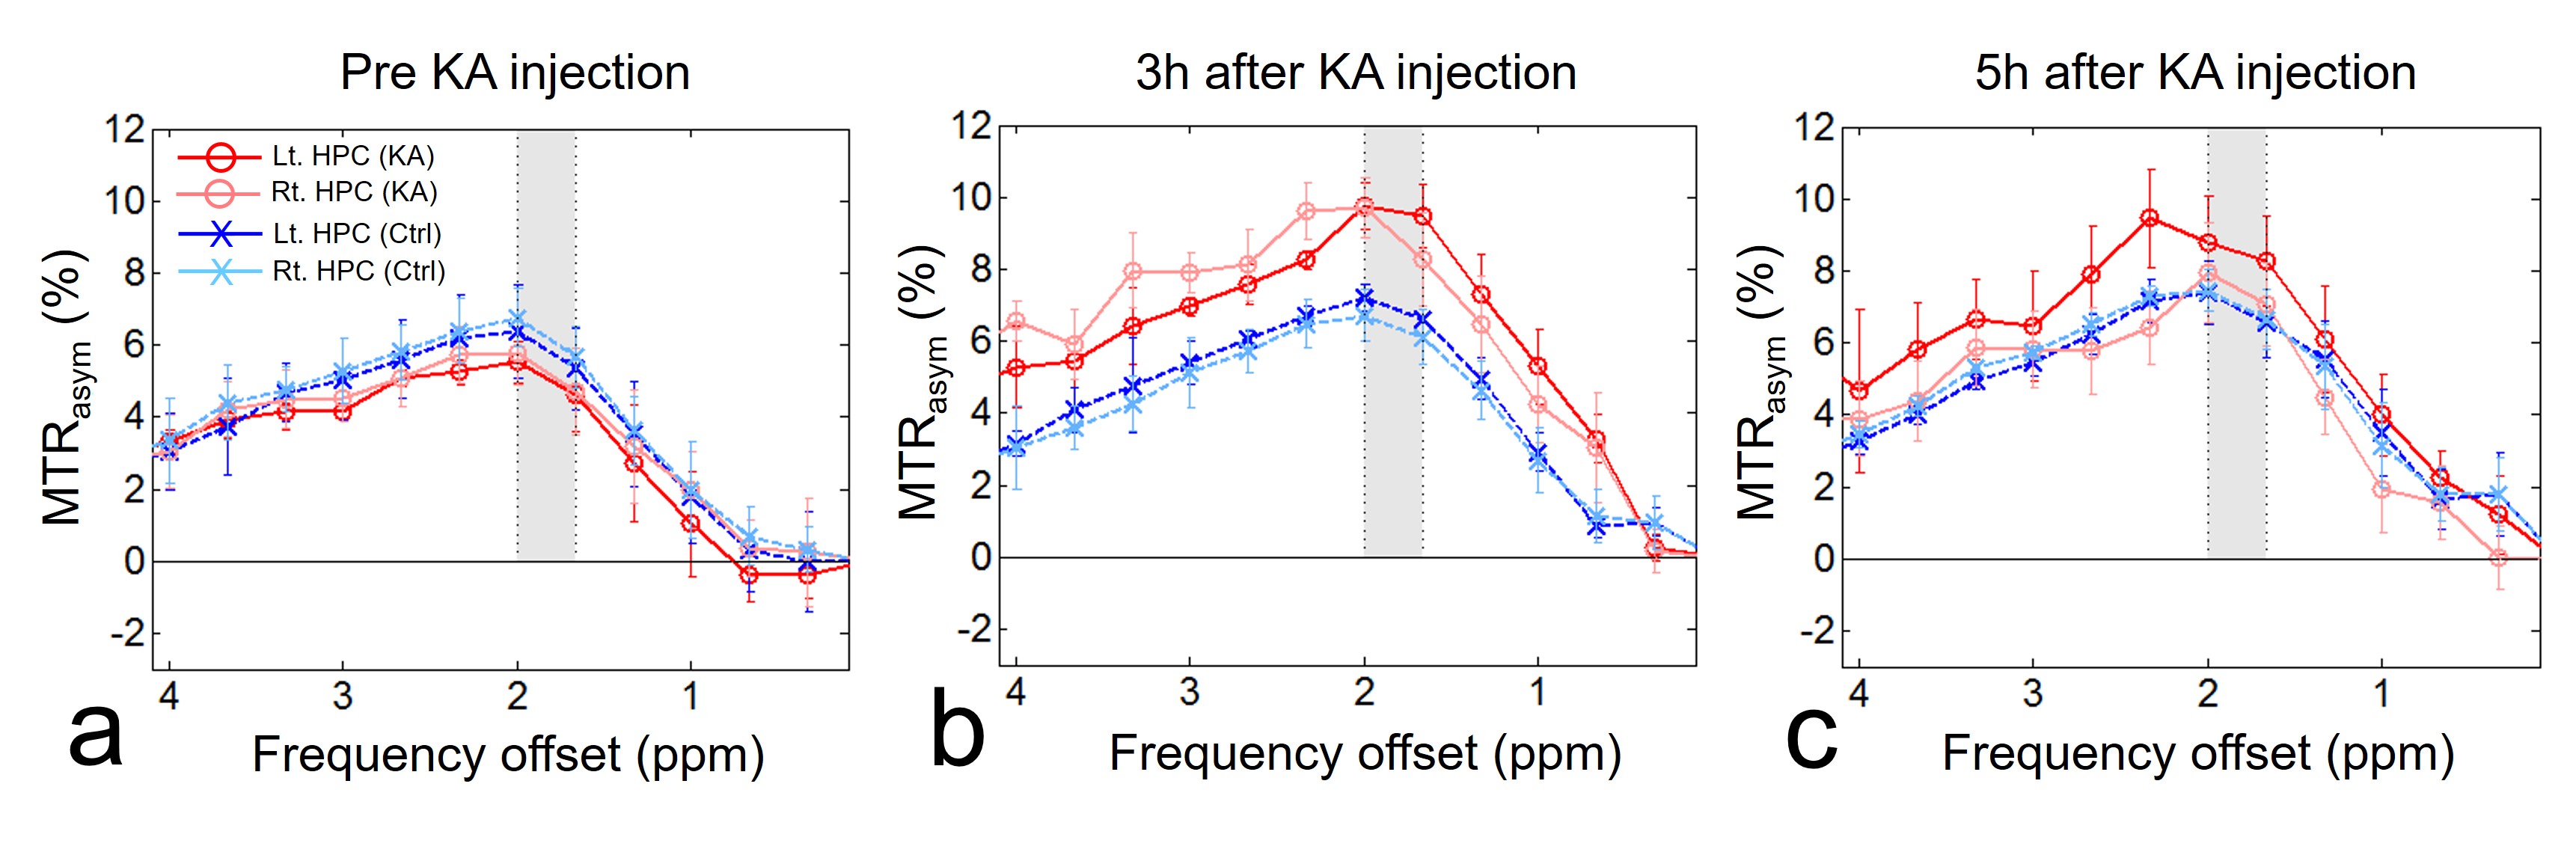
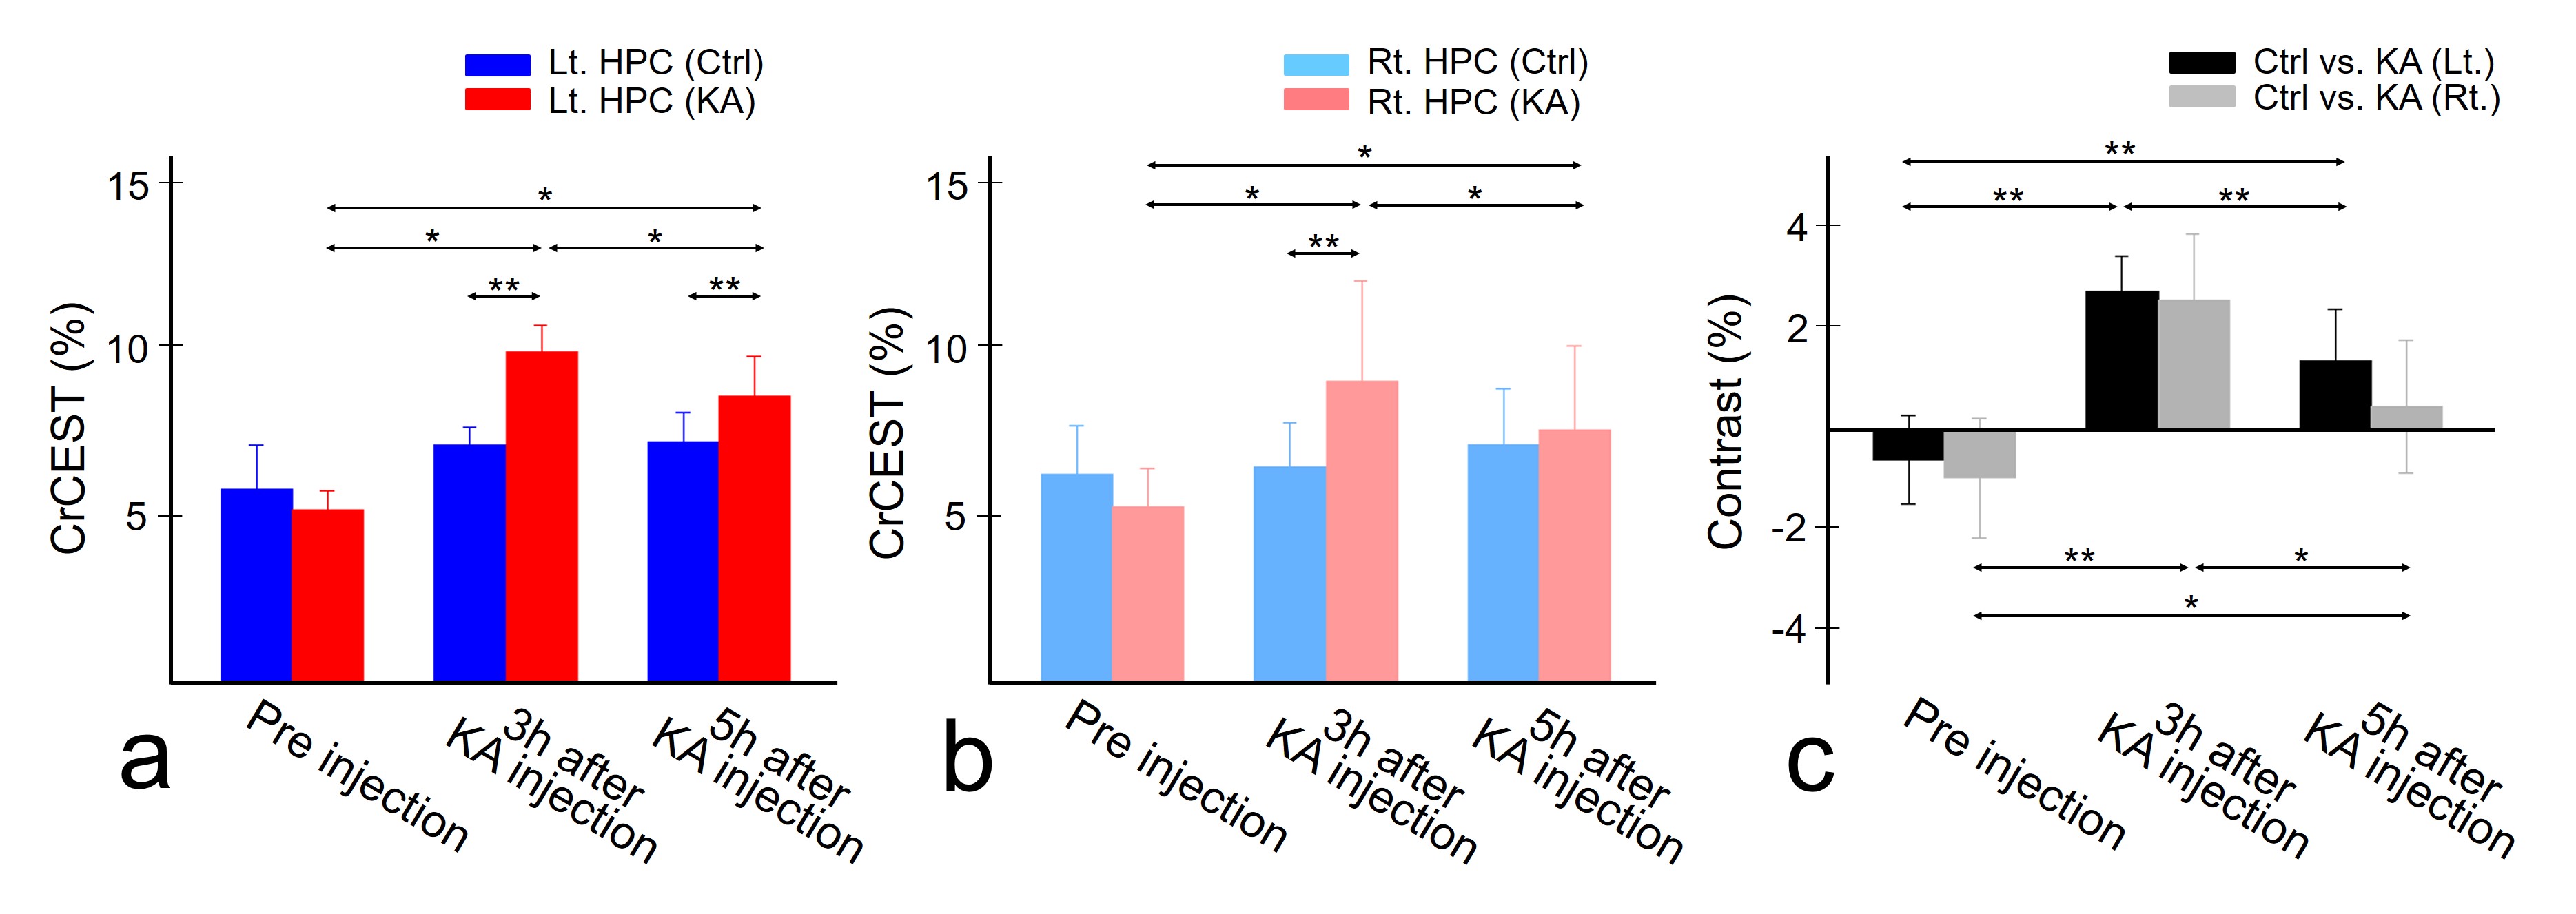
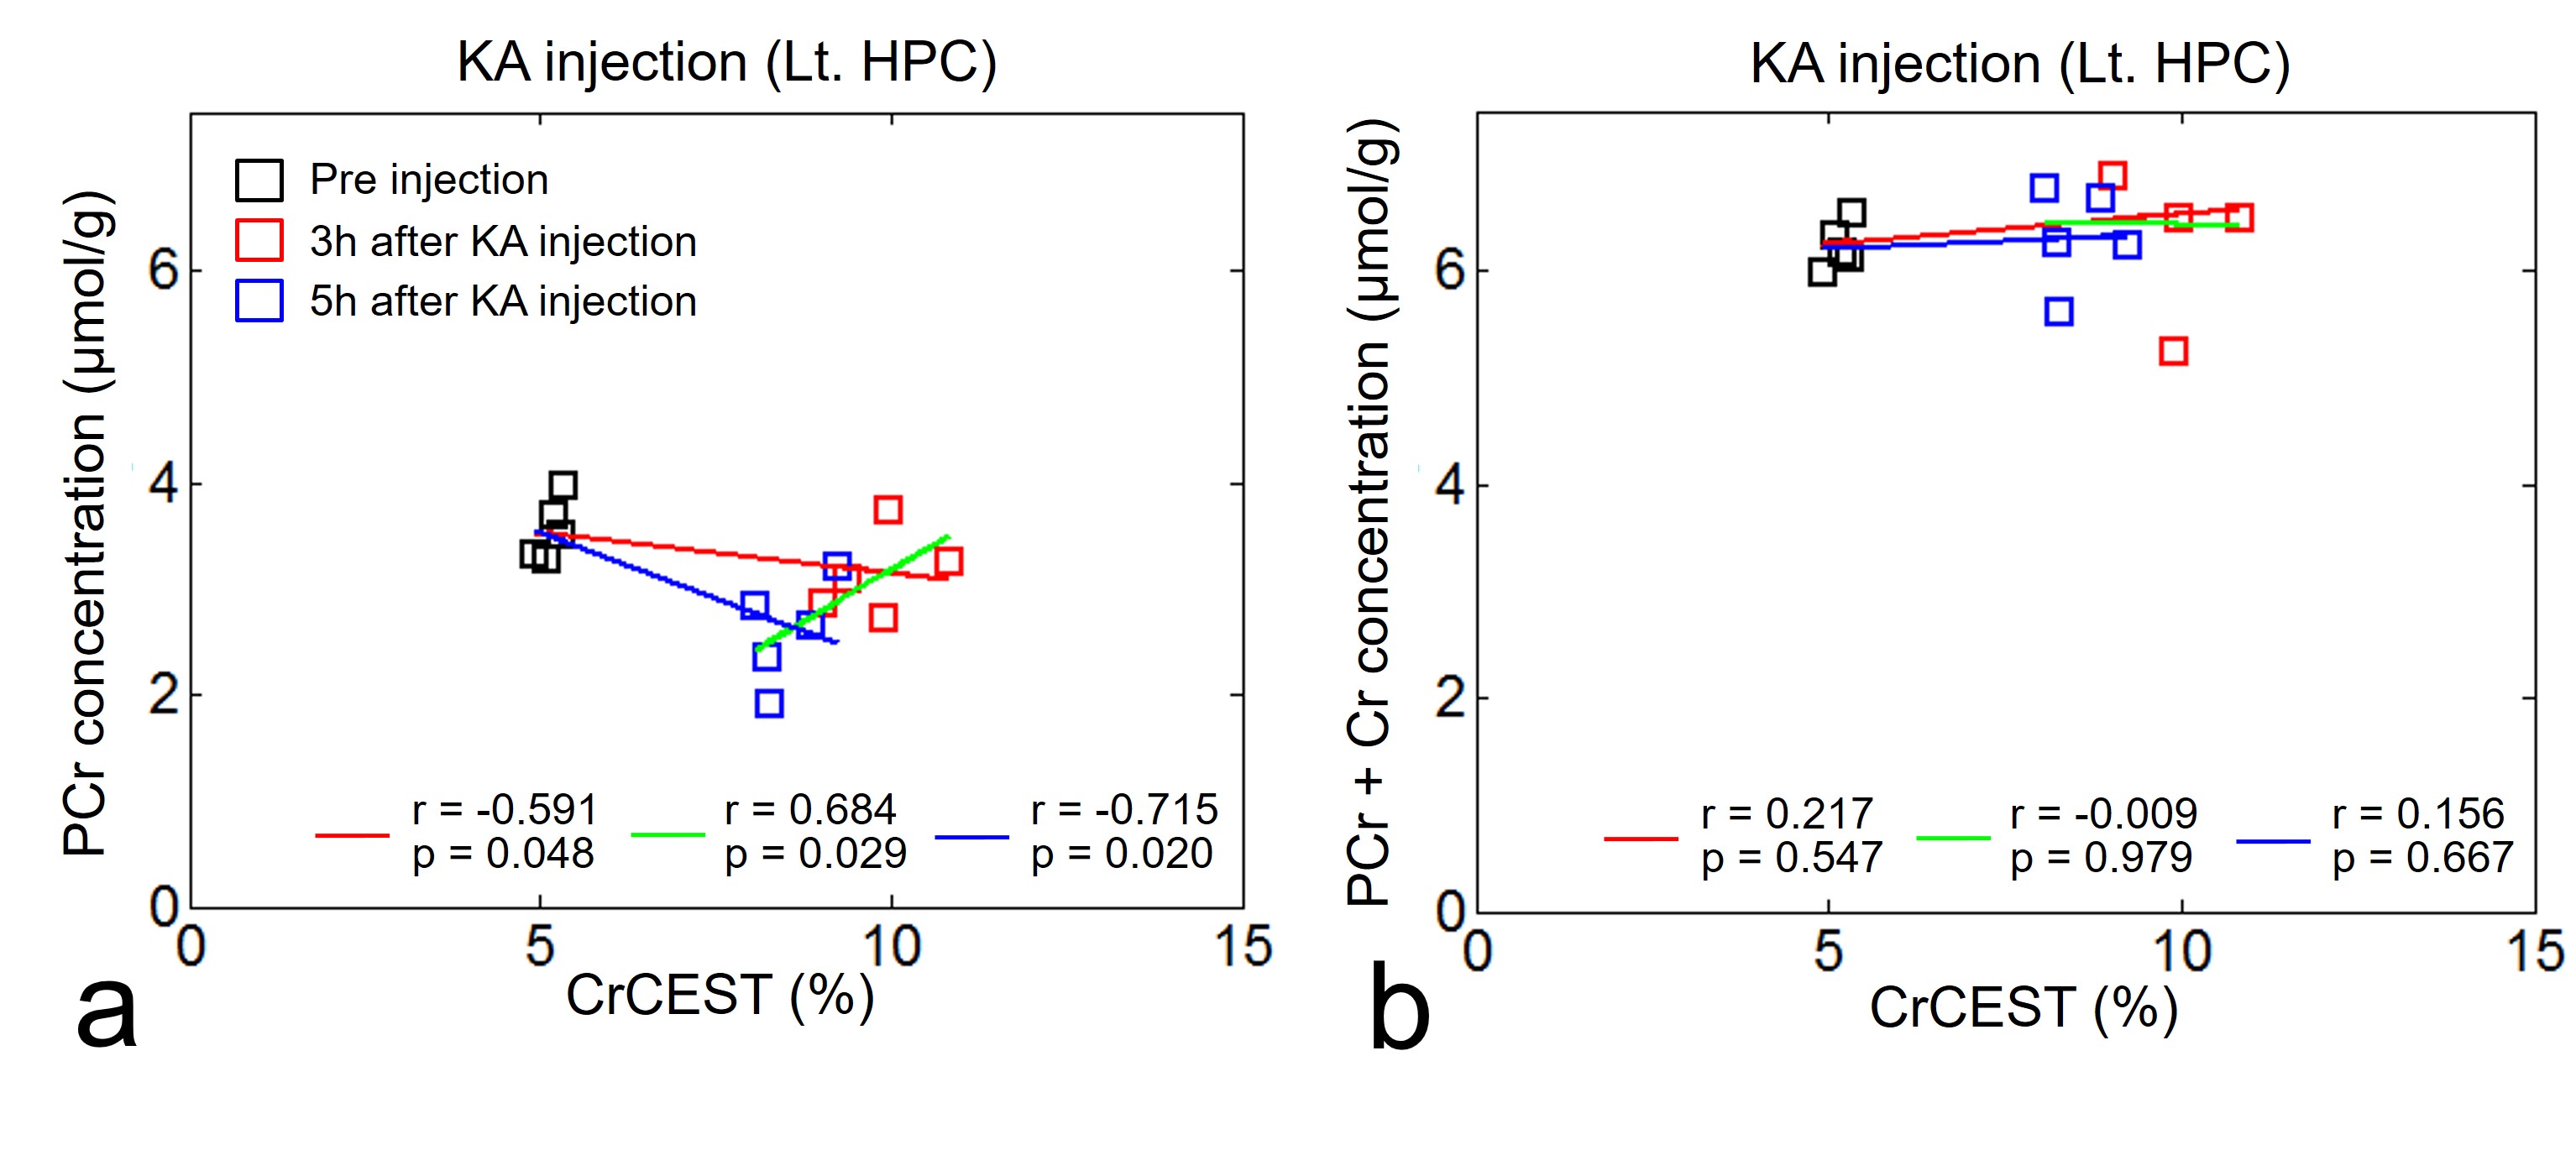
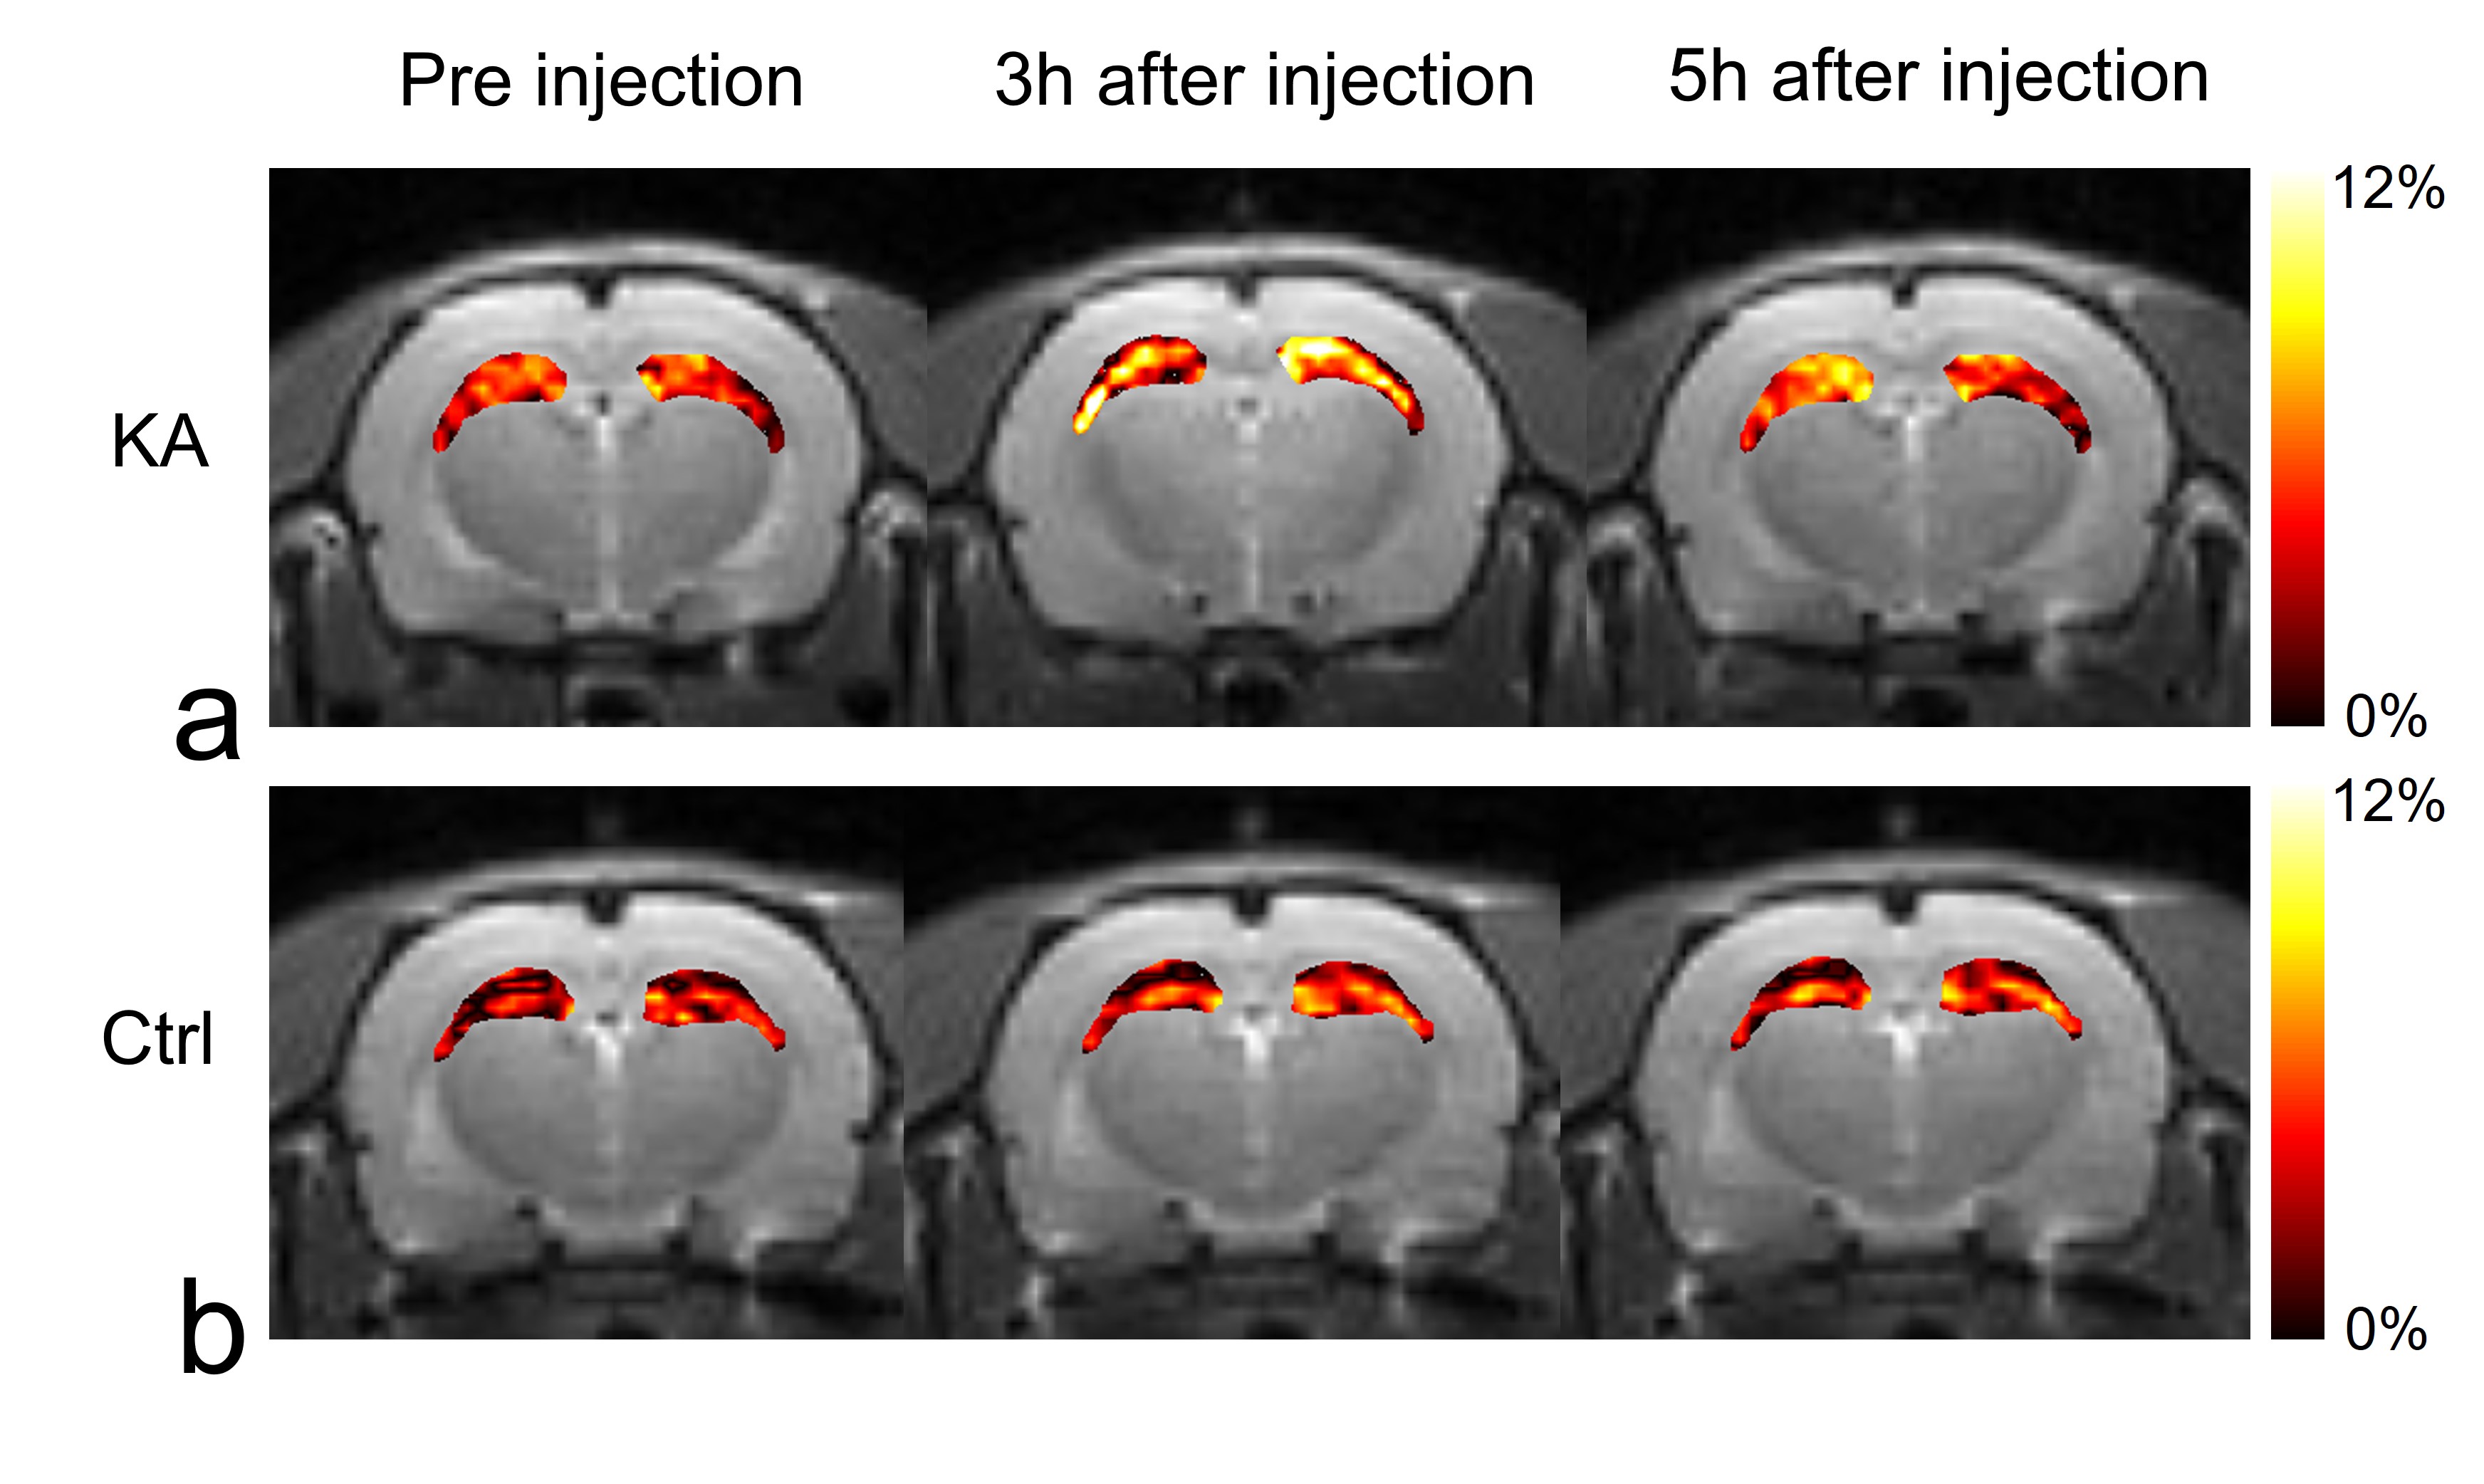
Before KA injection, the MTRasym values showed no significant differences between KA and control groups (Fig. 1a), indicating that the values from all groups have stable status. After the KA injection, the CrCEST signals in KA group were increased (Fig. 1b) than control group until 5 hours after KA injection as expected (Fig. 1c). In the result of measuring the CrCEST values (Fig. 2a-b), there were statistically significant differences between before and after injection (3 and 5 hours) in the KA group. Notably, after 5 hours of injection, the CrCEST value was decreased compared with the injection after 3 hours. However, the difference was still significant compared with control group. The signal contrasts of CrCEST between KA and control groups clearly showed significances before and after injection (p<0.05) (Fig. 2c). The CrCEST signals showed significant correlations with PCr values at each time points (all |r|<0.59; p<0.05; Fig. 3a). There were no significant correlations found from the results between CrCEST signals and PCr+Cr values (all |r|<0.22; p>0.05; Fig. 3b). Notably, as we expected, these phenomena showed the same pattern of correlations between CrCEST and PCr and PCr+Cr (inverse relationship between CrCEST and PCr concentration / independence between CrCEST and PCr+Cr concentration) as shown in the previous studies.2,3 On CrCEST maps, both hippocampus showed hyperintensities after KA injection (Fig. 4a) compared to the pre-injection of KA. In the control group, there was no signal difference in the CrCEST map with time changes (Fig. 4b).Conclusions
The application of CrCEST imaging showed the significant image contrast after KA injection, which are highly related with the changes of the creatine signals by energy consumption in the brain. The temporal evolution of the signal changes from CrCEST metric and the evaluated correlations with PCr and PCr+Cr results were clearly indicated that CrCEST imaging can be a useful approach to estimate the energy metabolism status in pre-clinical KA induced seizure models.Acknowledgements
This study was supported by grants from the Basic Science Research Program through the National Research Foundation of Korea [NRF-2015R1C1A1A02036526] and the Korea Health Technology R&D Project through the Korea Health Industry Development Institute [HI14C1090], funded by the Ministry of Health & Welfare, Republic of Korea.References
1. Haris M, Singh A, Cai K, Kogan F, McGarvey J, Debrosse C, Zsido GA, Witschey WR, Koomalsingh K, Pilla JJ, Chirinos JA, Ferrari VA, Gorman JH, Hariharan H, Gorman RC, Reddy R. A technique for in vivo mapping of myocardial creatine kinase metabolism. Nat Med. 2014;20(2):209-14.
2. Kogan F, Haris M, Debrosse C, Singh A, Nanga RP, Cai K, Hariharan H, Reddy R. In vivo chemical exchange saturation transfer imaging of creatine (CrCEST) in skeletal muscle at 3T. J Magn Reson Imaging. 2014;40(3):596-602.
3. Kogan F, Haris M, Singh A, Cai K, Debrosse C, Nanga RP, Hariharan H, Reddy R. Method for high-resolution imaging of creatine in vivo using chemical exchange saturation transfer. Magn Reson Med. 2014;71(1):164-72.
4. Guivel-Scharen V, Sinnwell T, Wolff S, Balaban R. Detection of proton chemical exchange between metabolites and water in biological tissues. J Magn Reson. 1998;133(1):36-45.
5. Bagga P, Crescenzi R, Krishnamoorthy G, Verma G, Nanga RP, Reddy D, Greenberg J, Detre JA, Hariharan H, Reddy R. Mapping the alterations in glutamate with GluCEST MRI in a mouse model of dopamine deficiency. J Neurochem. 2016;139(3):432-439.
6. Haris M, Singh A, Cai K, Nath K, Verma G, Nanga RP, Hariharan H, Detre JA, Epperson N, Reddy R. High resolution mapping of modafinil induced changes in glutamate level in rat brain. PLoS One. 2014 Jul 28;9(7):e103154.
7. Zhang Y, Heo HY, Lee DH, Zhao X, Jiang S, Zhang K, Li H, Zhou J. Selecting the reference image for registration of CEST series. J Magn Reson Imaging. 2016;43(3):756-61.
Figures