4973
Mapping neurotransmitter variations upon water deprivation in rats using overlap-resolved CEST1Champalimaud Centre for the Unknown, Lisbon, Portugal
Synopsis
Thirst regulation involves several brain regions and Glutamatergic/GABAergic mechanisms. Imaging those noninvasively could make a big impact on understanding brain circuitry in-vivo. A recently proposed method termed overlap-resolved CEST (orCEST) was suggested for mapping both Glutamate and GABA in the brain with increased specificity. Here, orCEST is used to investigate changes in these neurotransmitters in the rat brain in vivo upon water deprivation. Decreases in GABA and Glutamate in hypothalamic preoptic areas and corpus callosum, respectively, were observed in the Water Deprived group. This bodes well for future applications of orCEST for studying neurotransmission in-vivo.
INTRODUCTION
Thirst is regulated through homeostatic responses, e.g. variation in blood plasma osmolality, volume or pressure1,2. Several brain areas are thought to be involved in thirst regulation; particularly, the median preoptic nucleus (MnPO) of the Preoptic Area (POA) in the hypothalamus has been reported to modulate body fluid balance and cardiovascular function3–7 through Glutamatergic and GABAergic mechanisms.
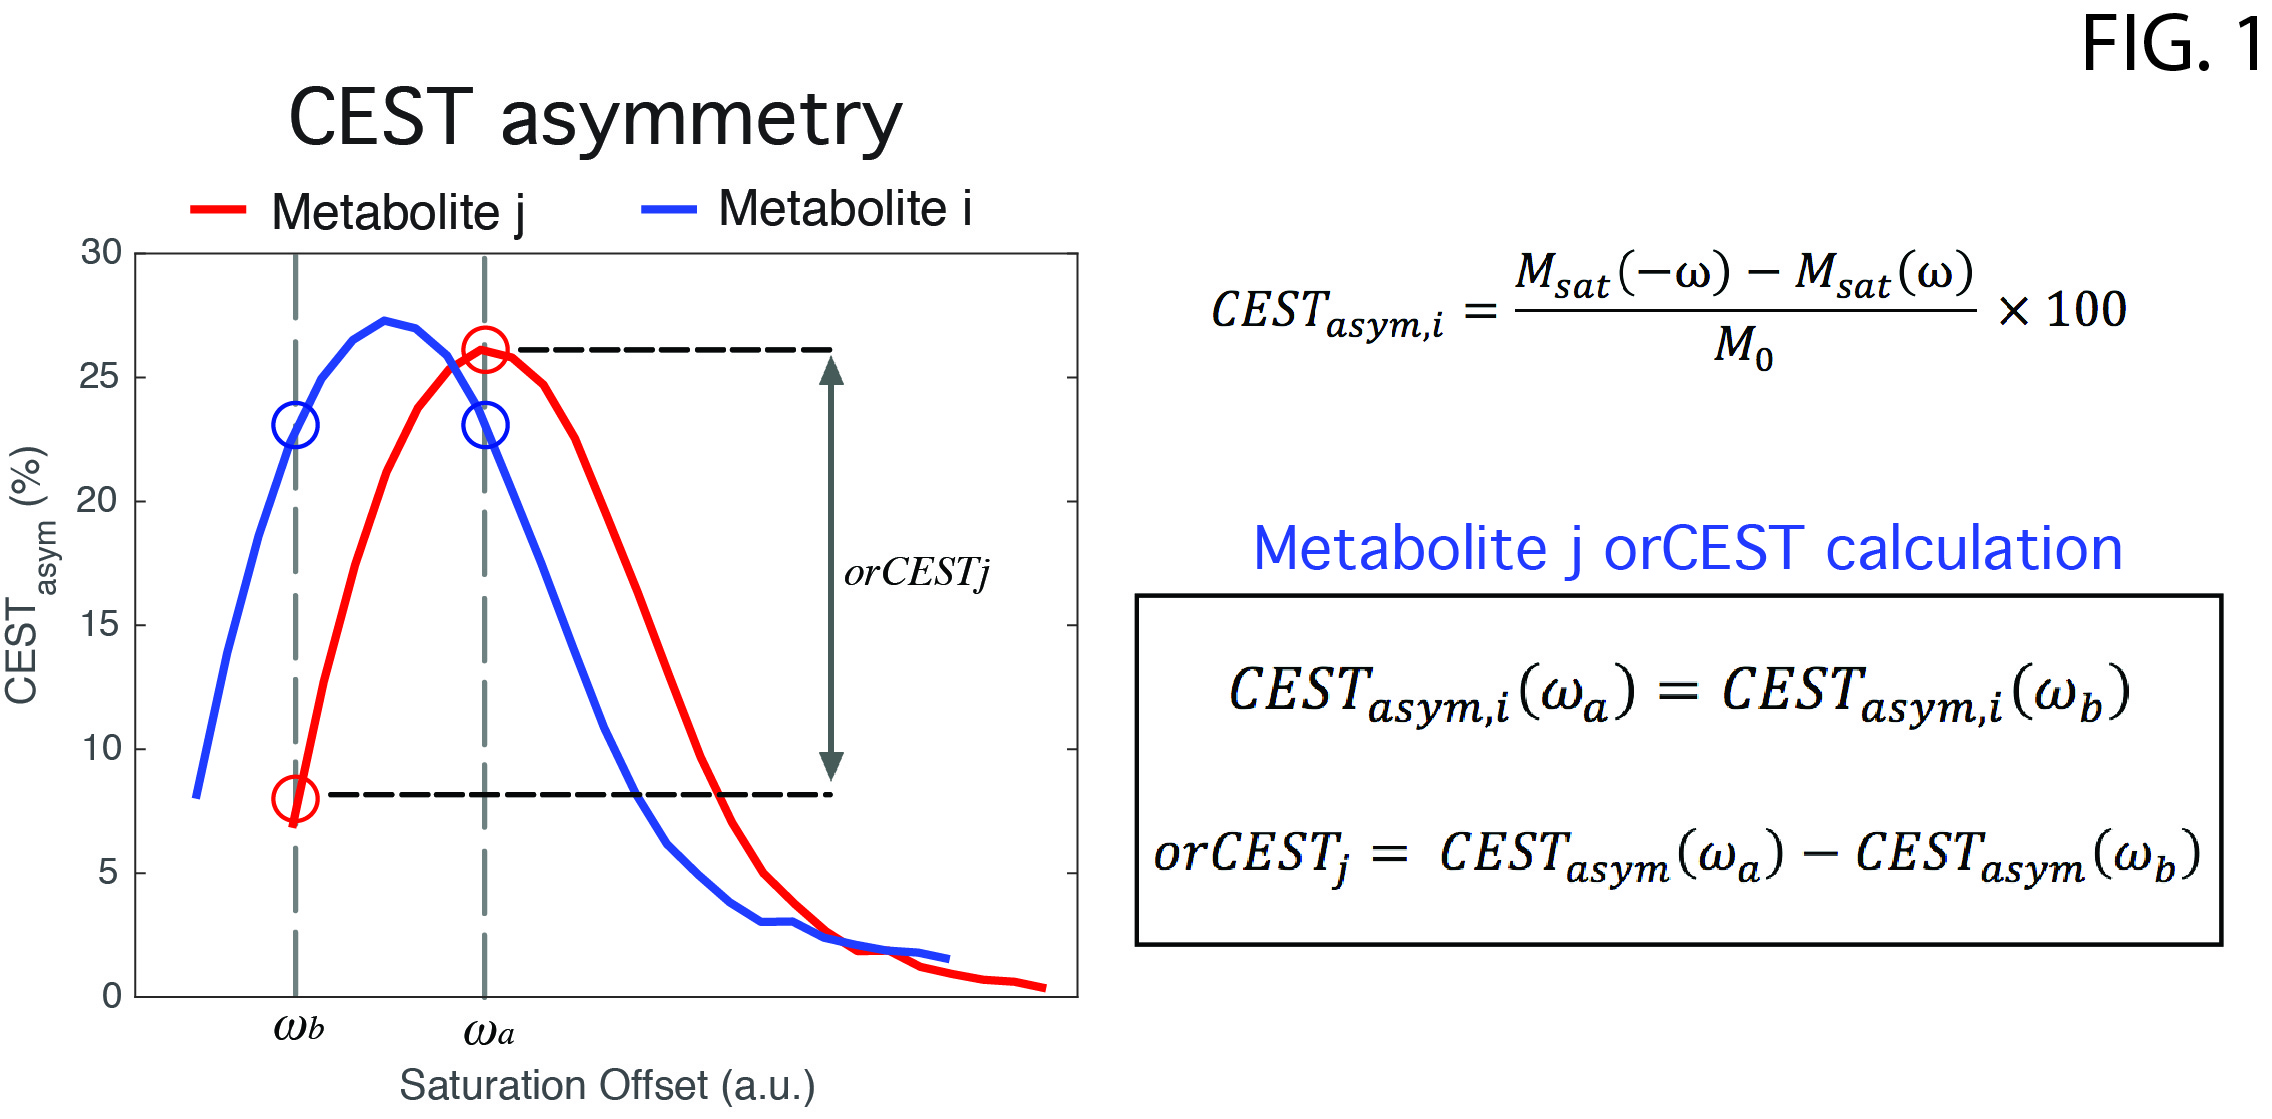
Glutamate Chemical Exchange Saturation Transfer (gluCEST) MRI8 has been proposed for imparting specificity unto MR images vis-à-vis glutamate – the brain’s primary excitatory neurotransmitter. Recently, a method termed overlap-resolved CEST (orCEST) was suggested for mapping both Glutamate and GABA in the brain with increased specificity and very good sensitivity9. Here we employ orCEST [Fig. 1] to try to contrast changes in these crucial neurotransmitters upon water deprivation in the rat.
METHODS
All animal experiments were preapproved by the institutional ethics committee operating under local and EU laws. Long-Evans male rats were randomly split into two groups, Control (n=6) and Water Deprived (WD, n=6). The first group was allowed ad libitum access to food and water, while the second was water deprived for 36h. All experiments were conducted on a Bruker BioSpec 9.4T equipped with a rat cryogenic reception coil (4-element array) and a gradient system capable of producing up to 660 mT/m isotropically. All animals anaesthetized with isofluorane (5% induction, ~2.5% maintenance) and kept at a stable temperature of 37°C. The control rats were constantly infused subcutaneously with saline to prevent dehydration during MRI scans. A modified Half-Fourier Acquisition Single-shot Turbo Spin Echo imaging (HASTE) sequence preceded by a CEST-module was used for CEST and orCEST mapping. Imaging parameters were: TR/TE = 10000/14.7ms, FOV = 24x24mm, slice thickness = 1.25mm, Matrix size = 80x80, number of refocusing pulses=44, partial Fourier factor=1.8, number of averages = 10, with a total scan time per run of 1m40s. All experiments were acquired in a fully relaxed state (TR>5T1). Saturation consisted of 22 Gaussian pulses, 182ms/15Hz, 10µT, with an interpulse delay of 5ms. A total of three slices were acquired across an axial plane at bregma 0.7/-0.9 /-1.46mm10. B0 and B1 profiles were optimized per slice prior to acquisition.
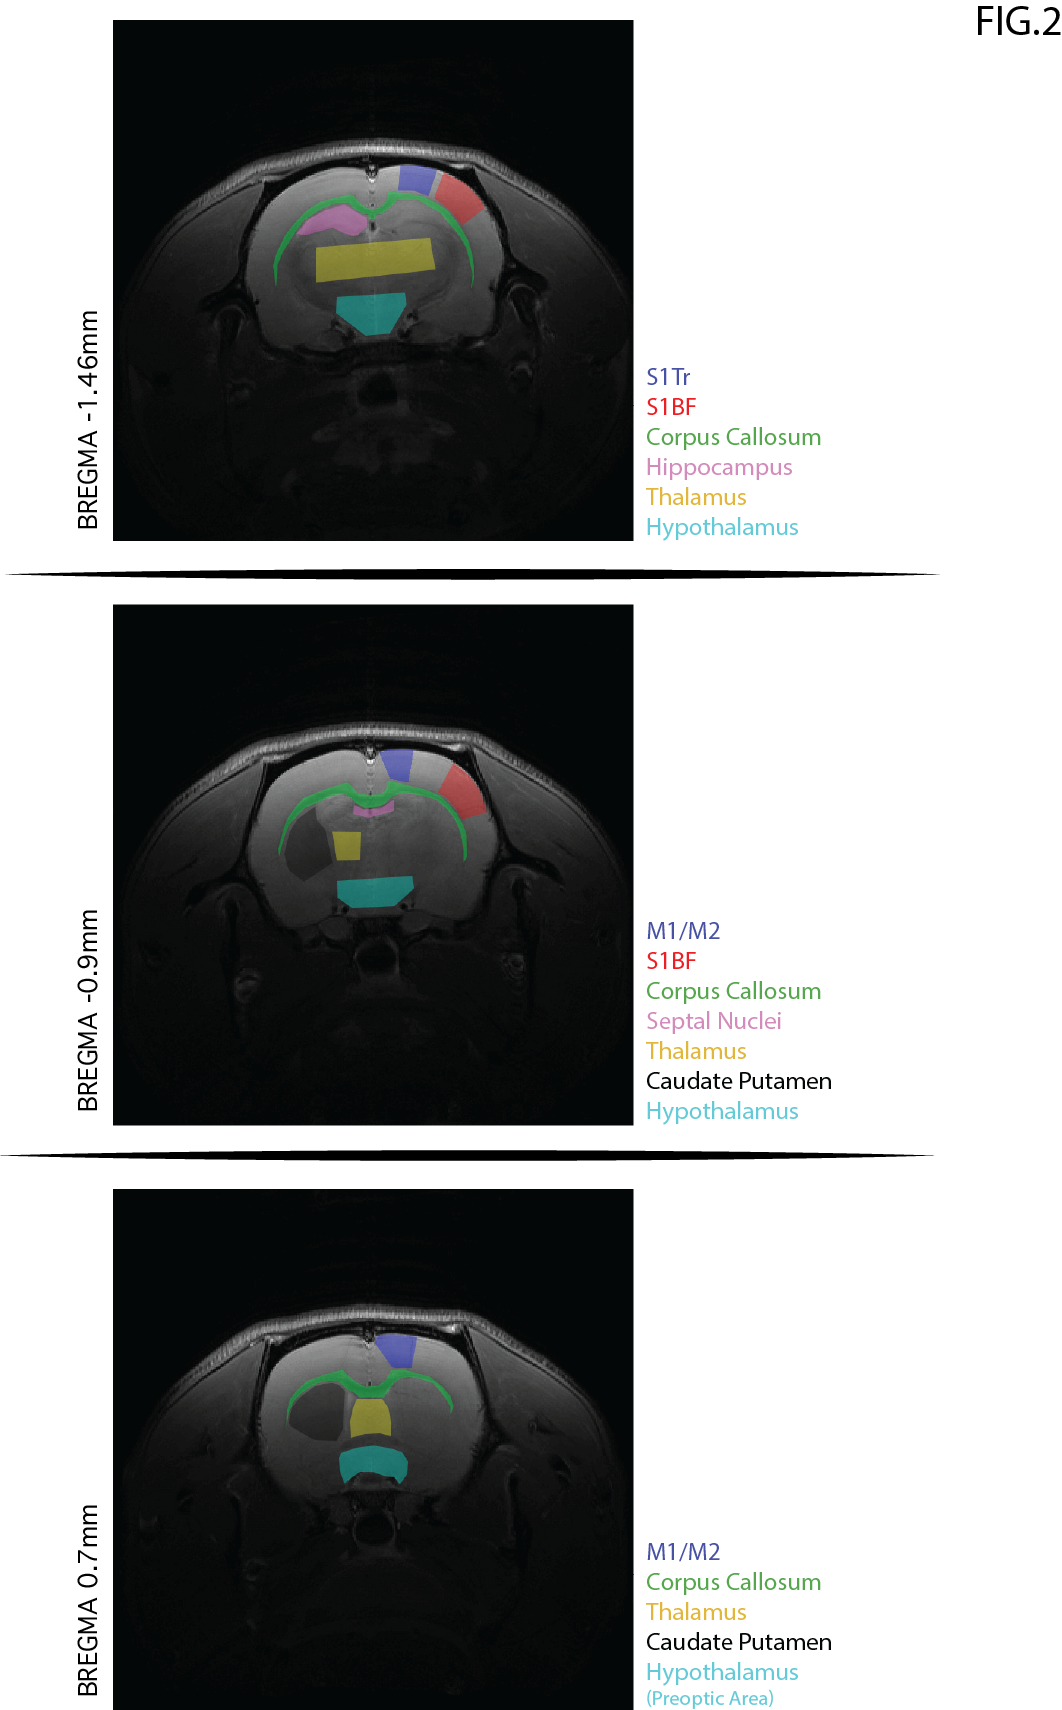
The scan protocol included: (1) conventional gluCEST8,11 using saturation at 3 p.p.m.; (2) orCEST for GABA and Glutamate [cf. Fig. 1 for details], and another reference scan without saturation, for normalization. B1 and B0-induced effects were corrected using double angle ratio and WASSR techniques, respectively. Image processing and data analysis were performed in MATLAB®. ROIs were delineated [Fig. 2] and their mean signals were calculated. Statistical analysis included normality tests and a Two-Sample t-Test.
RESULTS
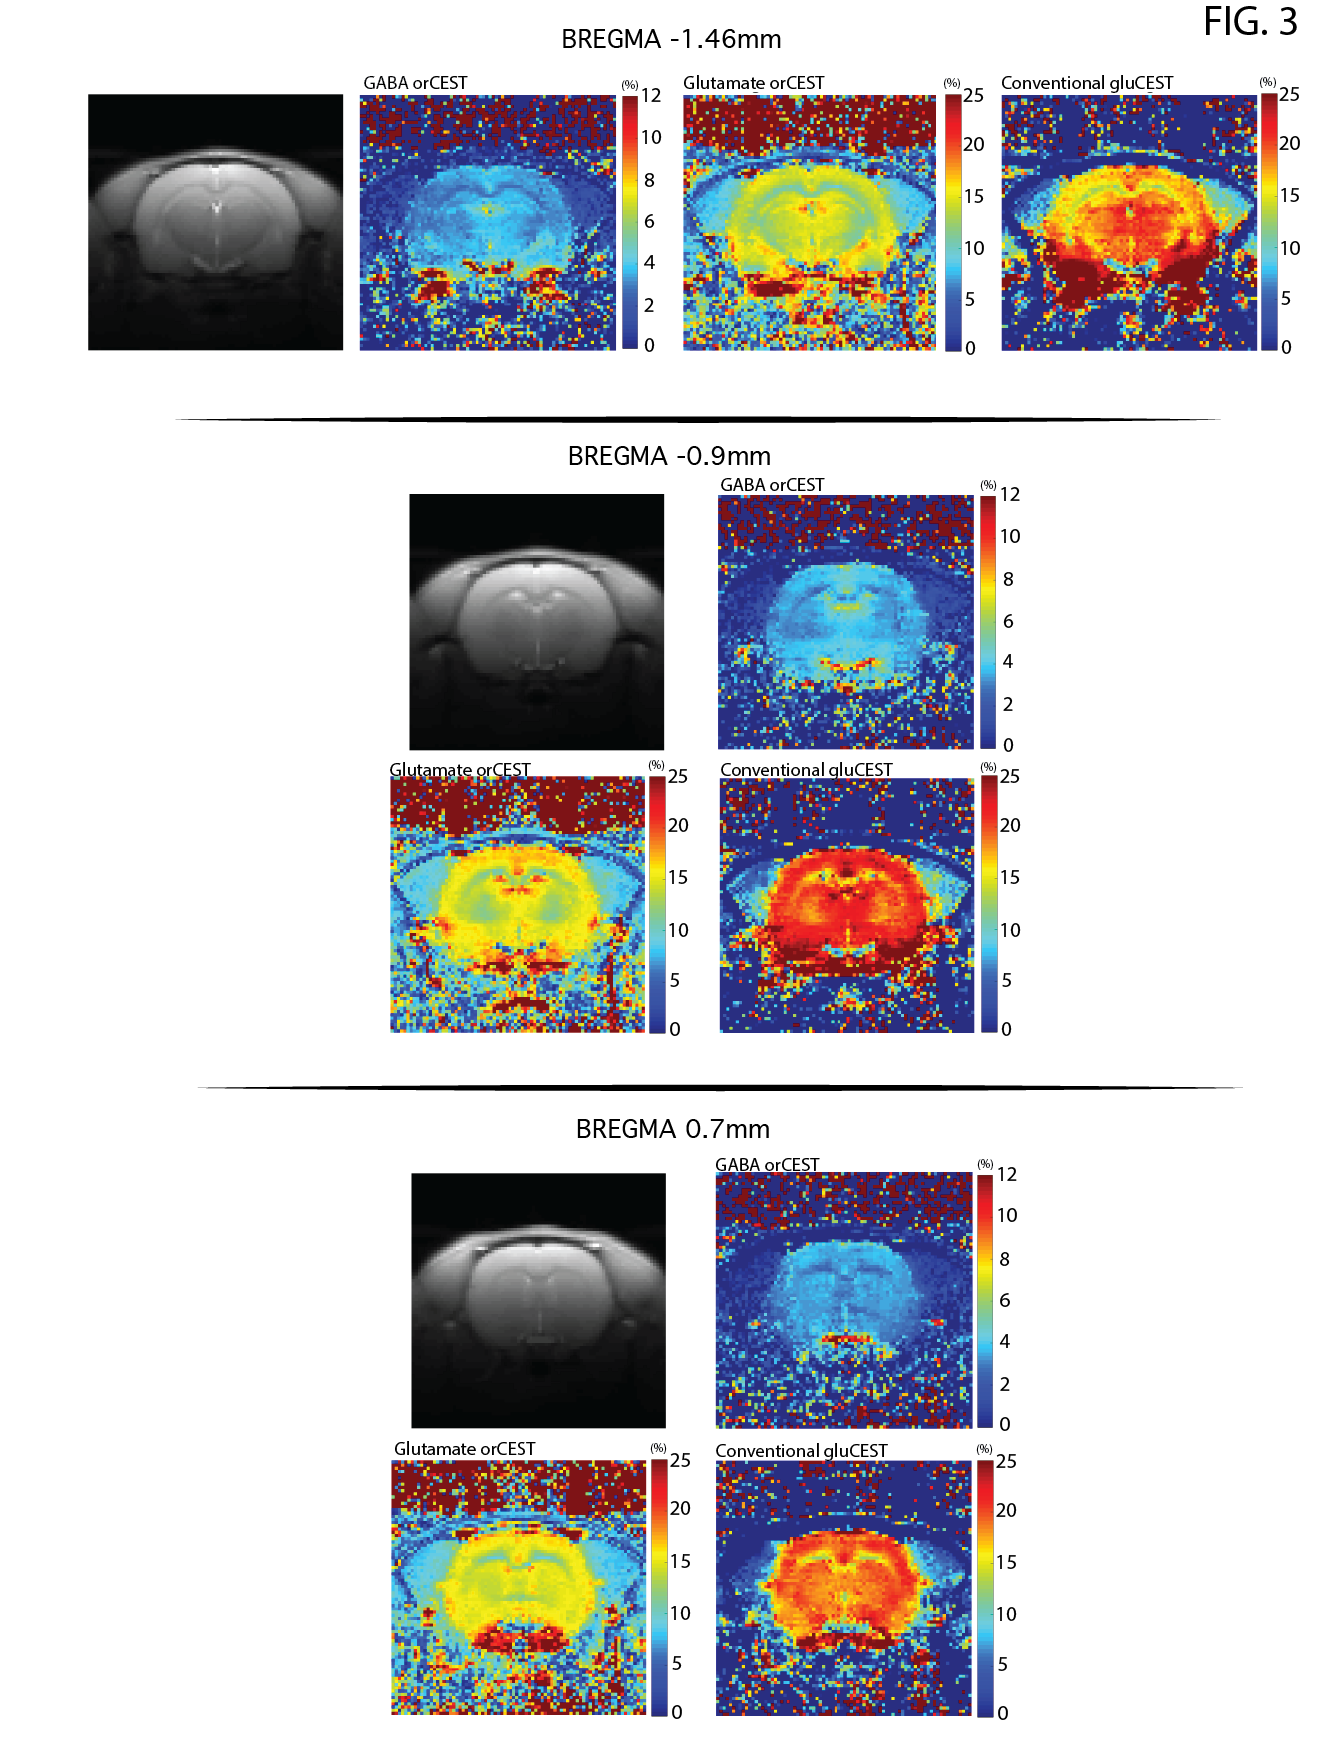
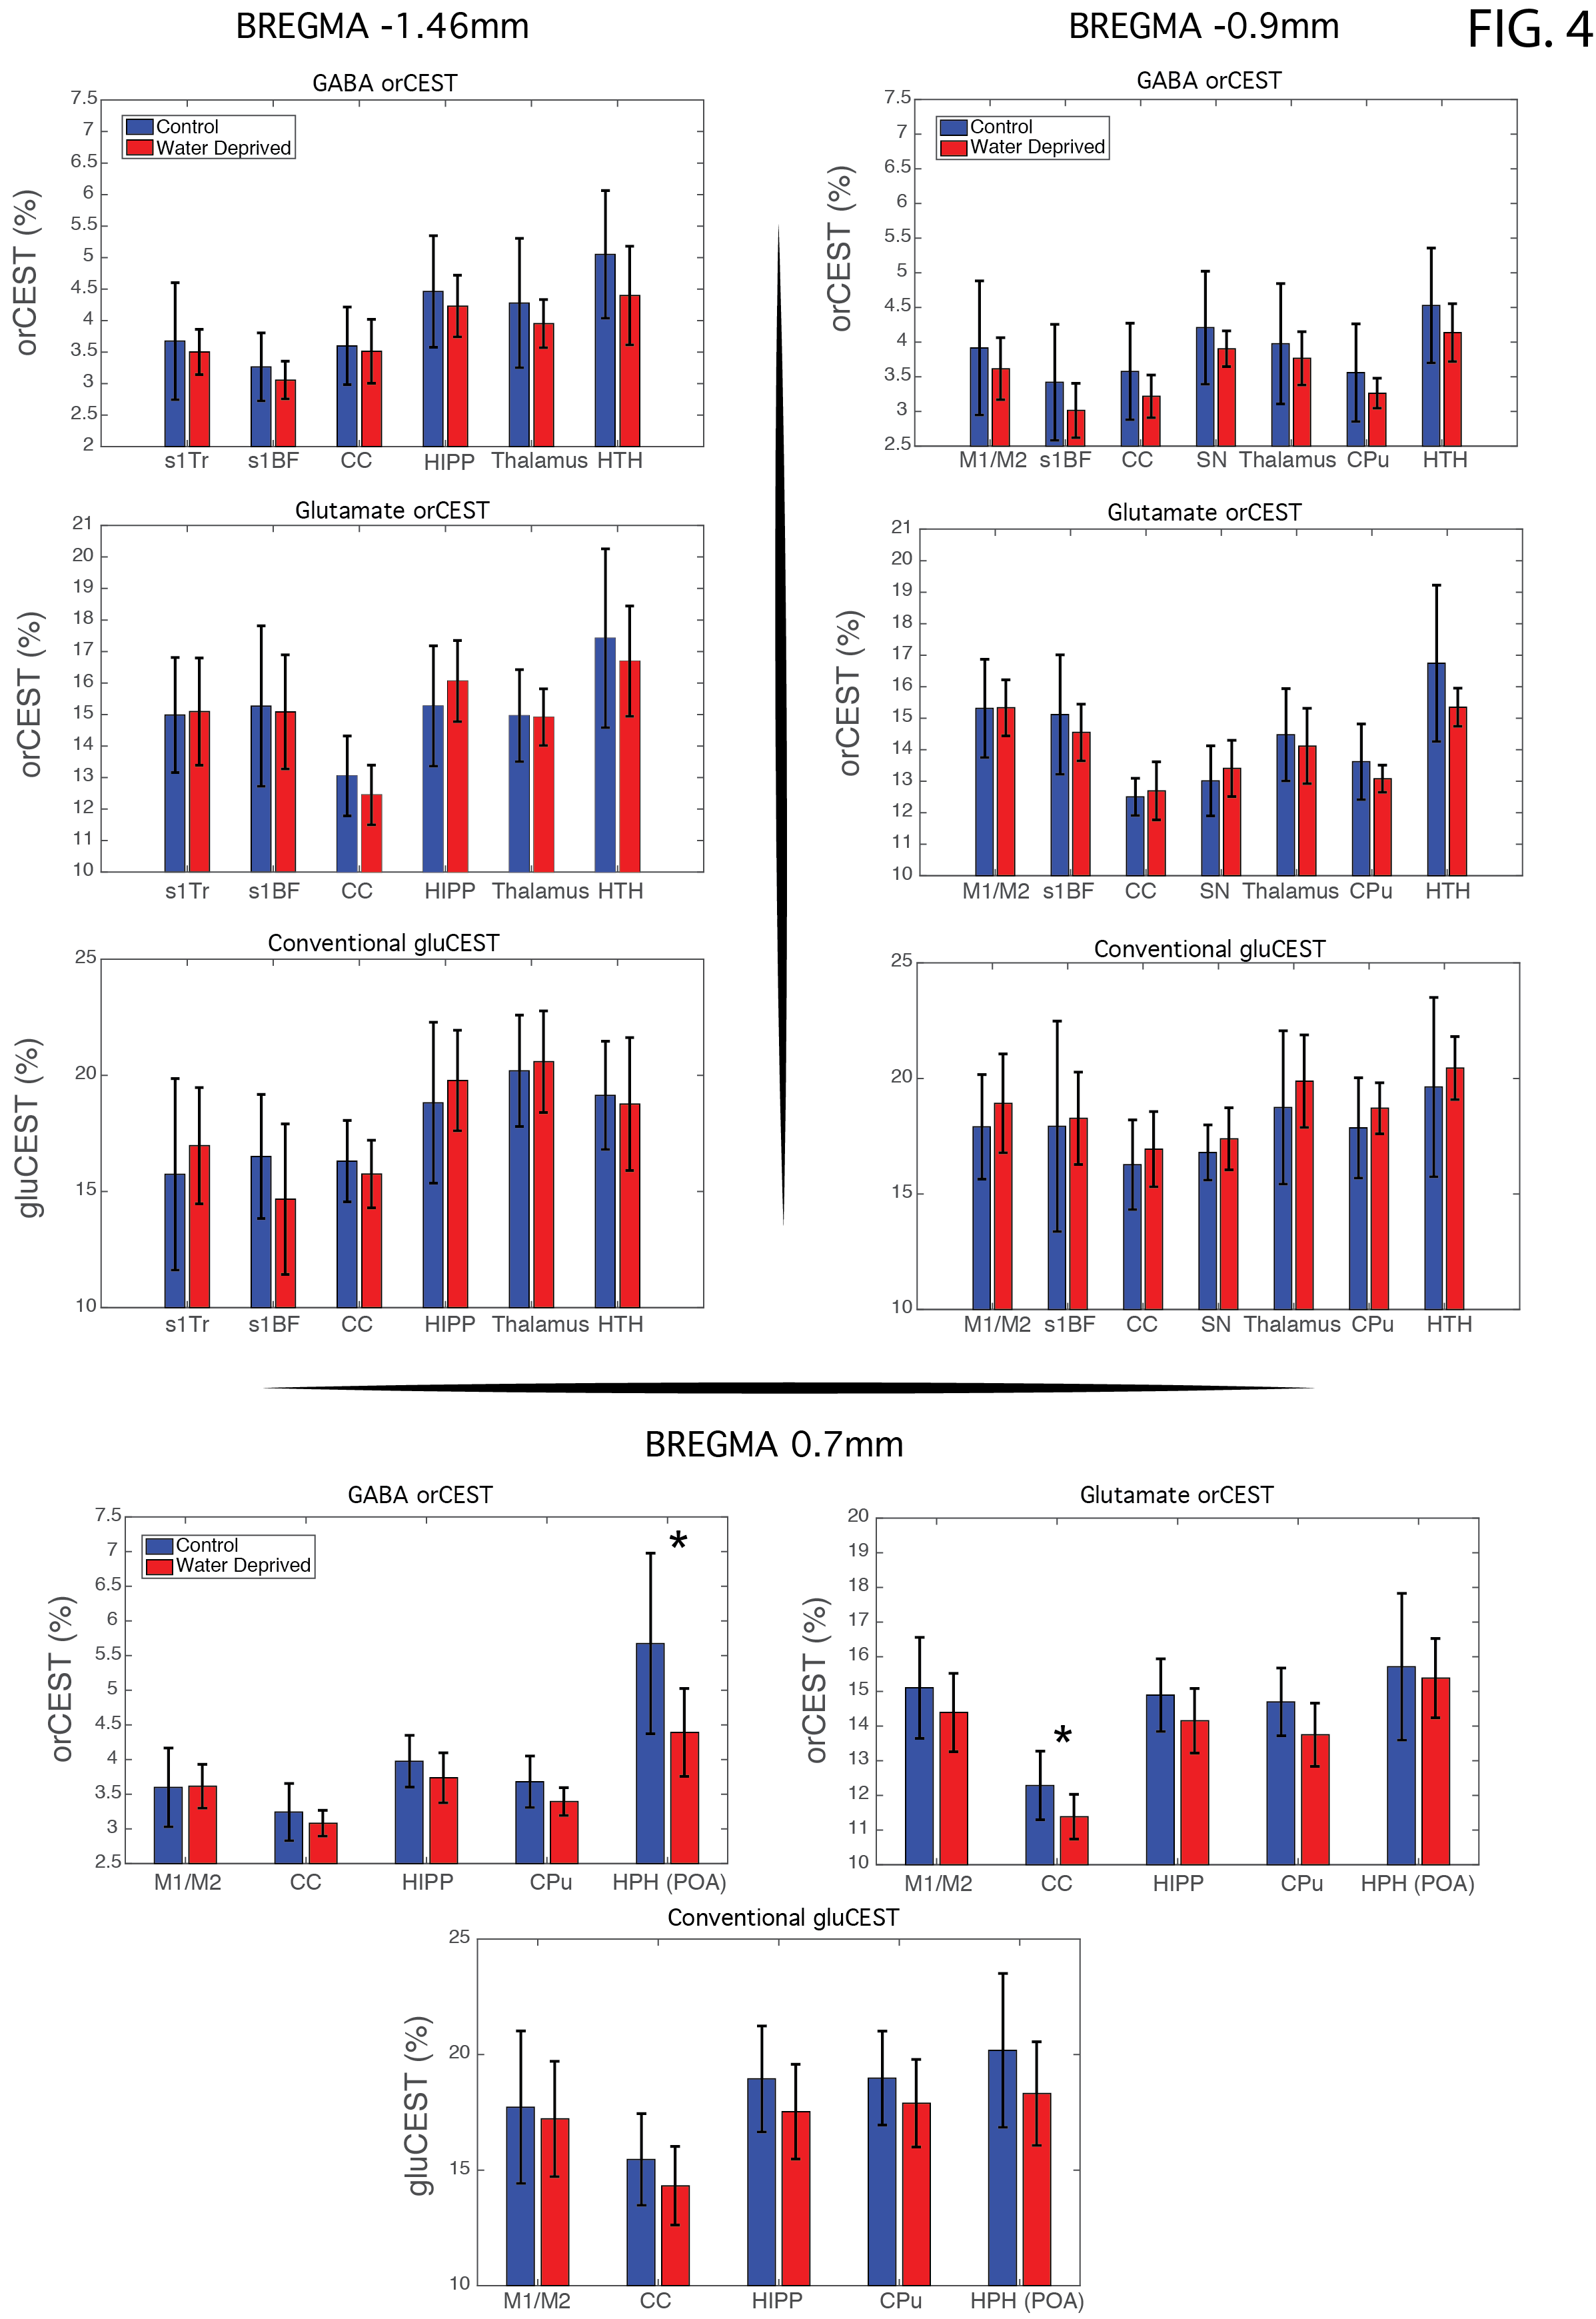
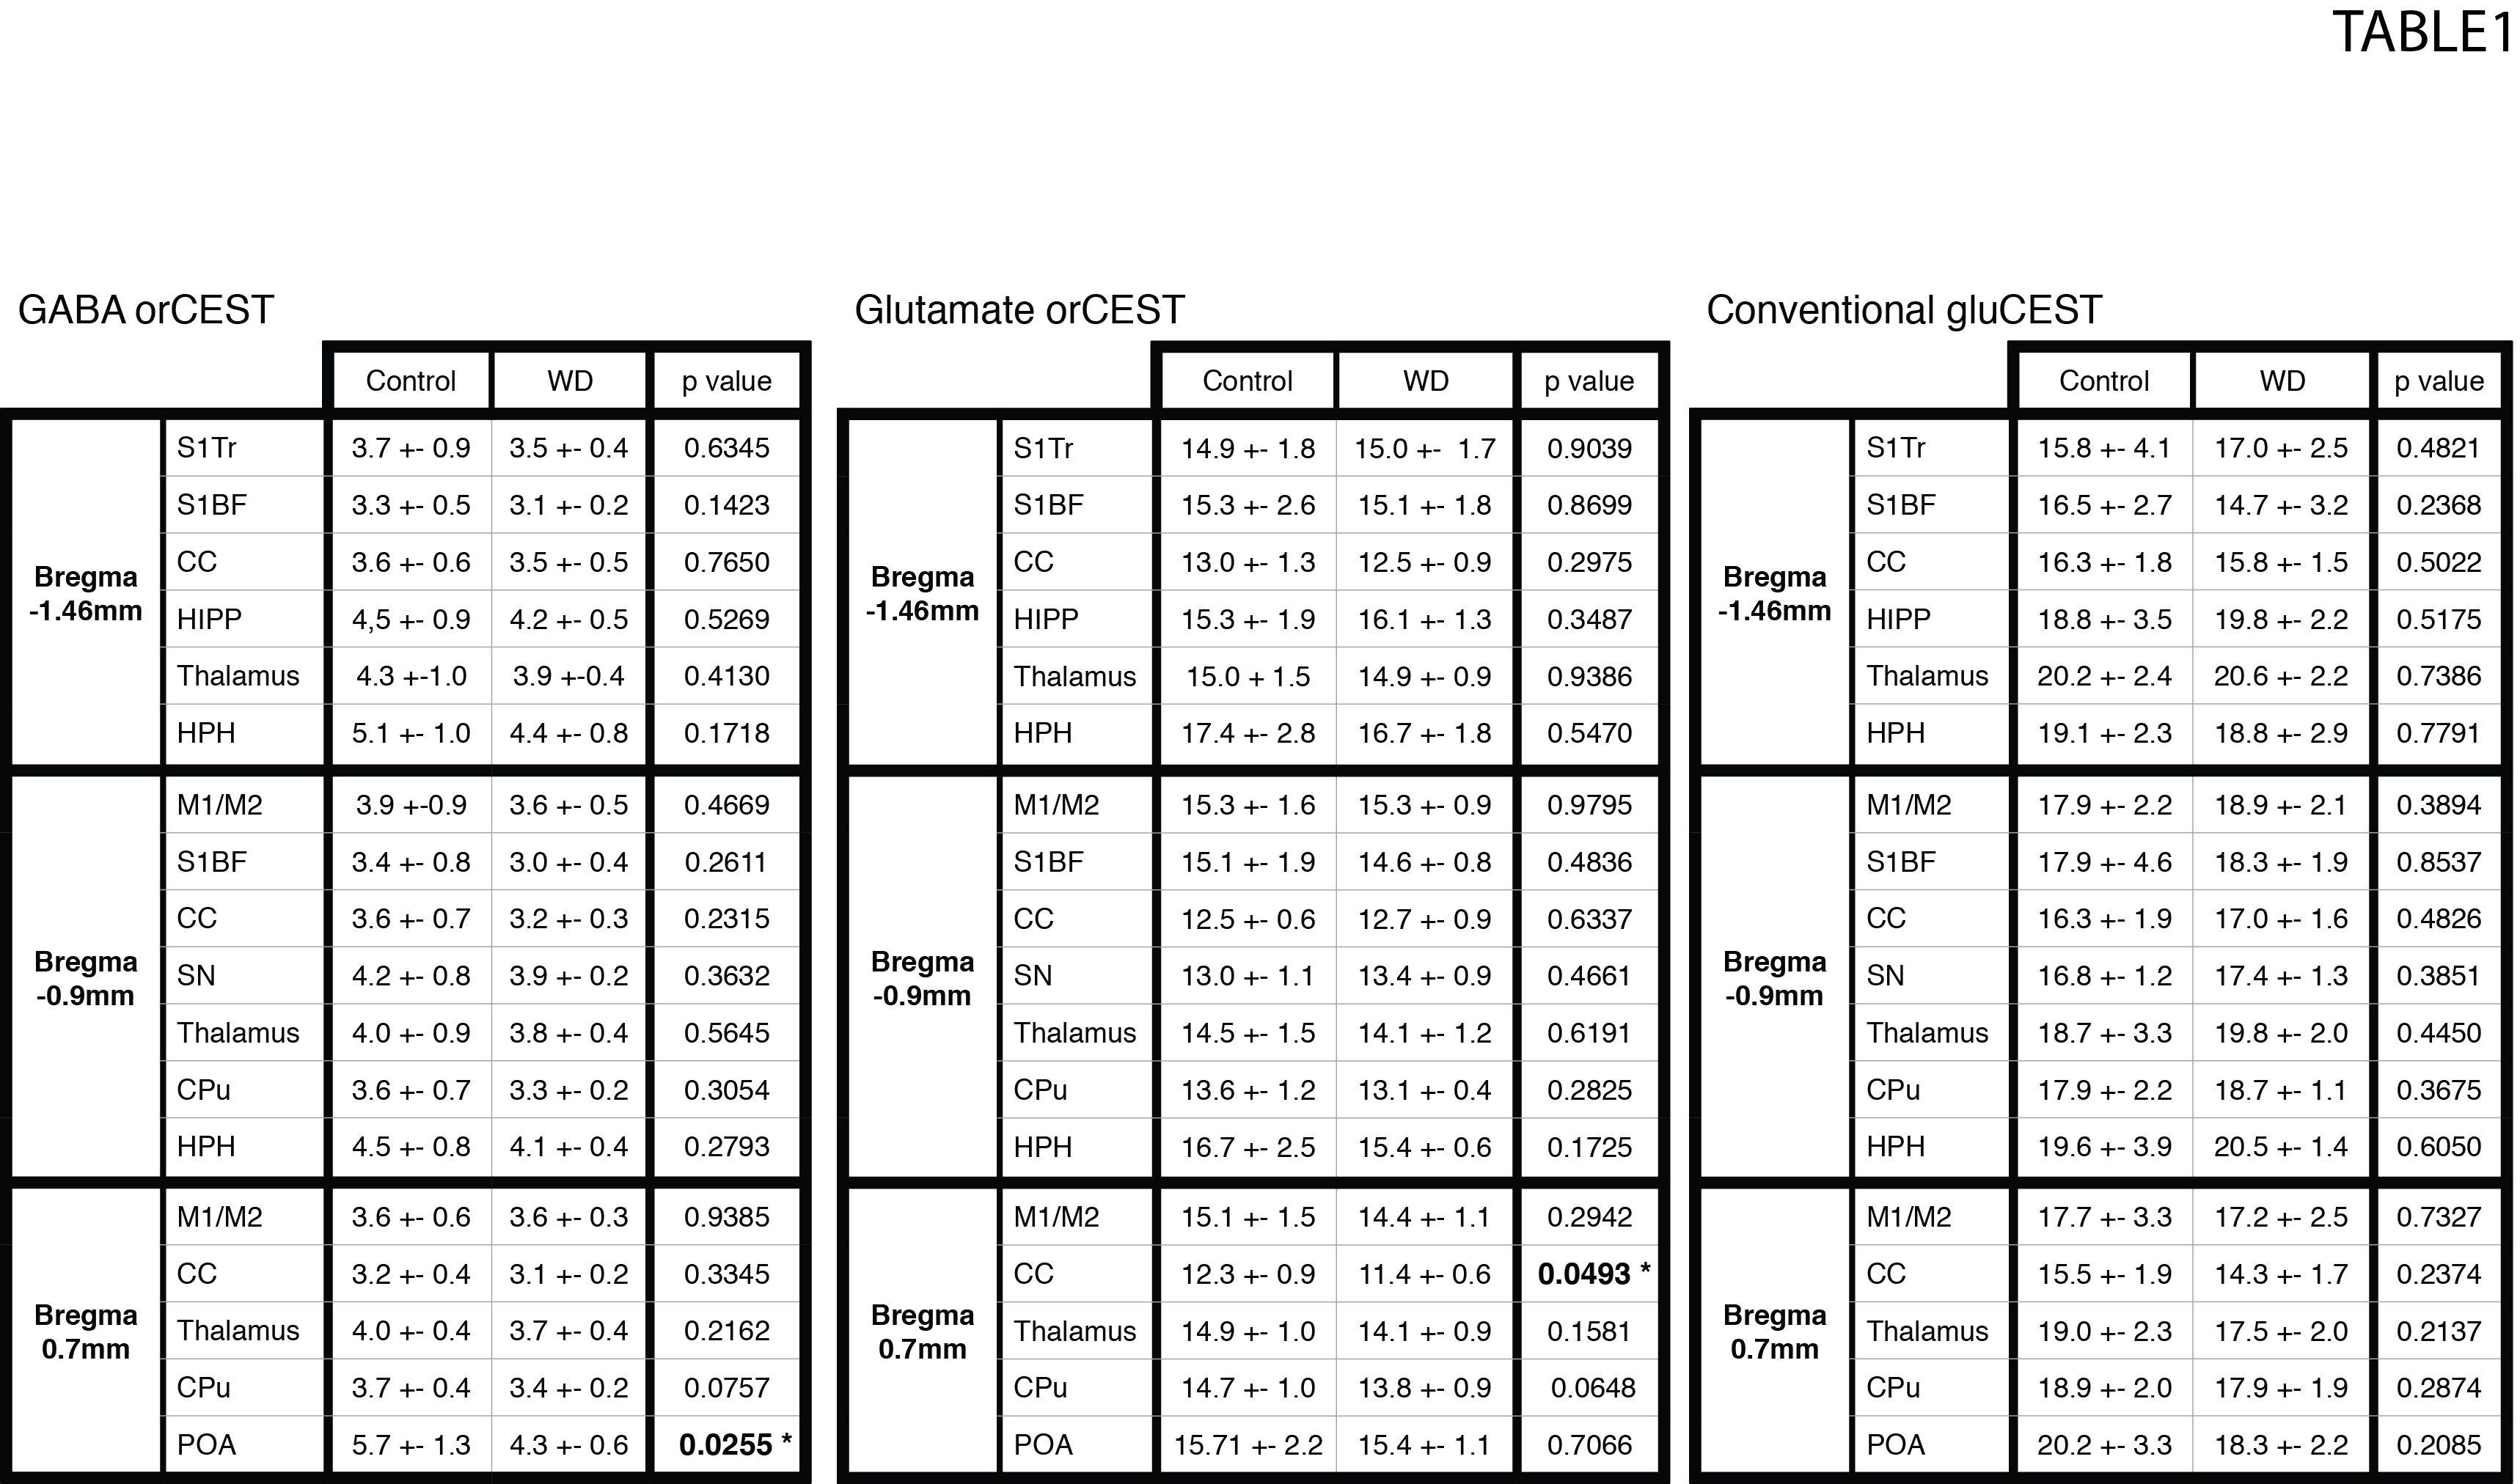
Raw data [Fig. 3] reveals excellent SNR for saturated images in all slices. Upon ROI investigation [Figure 4 and Table 1], statistically significant differences in GABA orCEST were found in the POA (p=0.0255), and borderline significant differences in Glutamate orCEST (p=0.0493) were found in the CC. No other statistically significant changes were observed in other ROIs, for both GABA and Glutamate (derived from orCEST or gluCEST).DISCUSSION
Here, we demonstrate that orCEST MRI can be used to map differences in the brain’s primary neurotransmitters when animals move between normal and thirst states. The GABA decrease found here may suggest reduced inhibition in the POA of the hypothalamus, which then presumably leads the animals to water seeking behaviors. Previous studies have also reported a cyclic variation of GABA in POA in the context of estrogen regulation12,13, but this can be disregarded as only male rats were used in this study. A Glutamate decrease in orCEST was also observed in the Corpus Callosum for the WD group. This region has several structures involved in thirst regulation which may explain this variation14. Other ROIs seemed quite oblivious to water deprivation, suggesting the effects found here are not global (e.g., changes in blood viscosity). Our focus now is on graduating the water deprivation duration from 0 to 48h, and finding correlations between GABA/Glu levels and thirst. Finally, it is encouraging that MRI can be used to map the primary excitatory and inhibitory neurotransmitters in the brain in-vivo and quantitatively, though at this early stage it is difficult to assess whether the contrast arises from synaptic, vesicular, or metabolic pools of Glutamate and GABA.CONCLUSION
Water deprivation induced a decrease in GABA and Glutamate in the preoptic area of the hypothalamus and the corpus callosum, respectively, in the rat brain, measured with the novel orCEST technique that enabled specific and sensitive characterization of GABA and Glutamate in vivo. This bodes well for future applications in health and disease.Acknowledgements
This study was supported by funding from the European Research Council (ERC) under the European Union’s Horizon 2020 research and innovation programme (Starting Grant, agreement No. 679058).References
1. King BM, Gaston MG. Factors influencing the hunger and thirst motivated behavior of hypothalamic hyperphagic rats. Physiol Behav. 1976;16(1):33-41. doi:10.1016/0031-9384(76)90189-X.
2. Zimmerman CA, Leib DE, Knight ZA. Neural circuits underlying thirst and fluid homeostasis. Nat Rev Neurosci. 2017;18(8):459-469. doi:10.1038/nrn.2017.71.
3. Miyakubo H, Yamamoto K, Hatakenaka S, Hayashi Y, Tanaka J. Drinking decreases the noradrenaline release in the median preoptic area caused by hypovolemia in the rat. Behav Brain Res. 2003;145(1-2):1-5. doi:10.1016/S0166-4328(03)00102-5.
4. Cambiasso MJ. The Involvement of the Hypothalamic Preoptic Area on the Regulation of Thirst in the Rat. 1992;195:190-195.
5. Oka Y, Ye M, Zuker CS. Thirst driving and suppressing signals encoded by distinct neural populations in the brain. Nature. 2015;520(7547):349-352. doi:10.1038/nature14108.
6. Abbott SBG, Saper CB. Median preoptic glutamatergic neurons promote thermoregulatory heat-loss and water consumption in mice. J Physiol. 2017. doi:10.1113/JP274667.
7. Abbott SBG, Machado NLS, Geerling JC, Saper CB. Reciprocal Control of Drinking Behavior by Median Preoptic Neurons in Mice. J Neurosci. 2016;36(31):8228-8237. doi:10.1523/JNEUROSCI.1244-16.2016.
8. Cai K, Haris M, Singh A, et al. Magnetic resonance imaging of glutamate. Nat Med. 2012;18(2):302-306. doi:10.1038/nm.2615.
9. Severo F, Shemesh N. Overlap-resolved cest (orCEST) MRI: imaging gaba and glutamate at 16.4T. In: International Society for Magnetic Resonance in Medicine. Honolulu, HI, USA; 2017.
10. Paxinos G, Watson C. The rat brain in stereotaxic coordinates (6th ed.). Acad Press. 2007.
11. Cai K, Singh A, Roalf DR, et al. Mapping glutamate in subcortical brain structures using high-resolution GluCEST MRI. NMR Biomed. 2013;26(10):1278-1284. doi:10.1002/nbm.2949.
12. Herbison AE, Augood SJ, Simonian SX, Chapman C. Regulation of GABA transporter activity and mRNA expression by estrogen in rat preoptic area. J Neurosci. 1995;15(12):8302-8309.
13. Herbison AE. Estrogen regulation of GABA transmission in rat preoptic area. Brain Res Bull. 1997;44(4):321-326. doi:10.1016/S0361-9230(97)00210-4.
14. Gonçalves R, Volk H, Smith PM, et al. Corpus Callosal Abnormalities in Dogs. J Vet Intern Med. 2014;28(4):1275-1279. doi:10.1111/jvim.12371.
Figures