4970
Transient hyperhydration modulates the brain fluid distribution of spontaneous hypertension rats: A T2 relaxometry studyKun-I Chao1, Xia-Yu Lyu1, Pei-Lun Yu1, Sheng-Min Huang1, Shin-Lei Peng2, Kung-Chu Ho3, Ping-Huei Tsai4, and Fu-Nien Wang1
1Department of Biomedical Engineering and Environmental Science, National Tsing Hua University, Hsinchu, Taiwan, 2Department of Biomedical Imaging and Radiological Science, China Medical University, Taichung, Taiwan, 3Nuclear Medicine, Chang Gung Memorial Hospital, Taoyuan, Taiwan, 4Department of Radiology, Taipei Medical University Hospital, Taipei, Taiwan
Synopsis
After 2% of body weight fluid infusion, the homeostasis of fluid distribution was temporally modulated in spontaneously hypertensive rats, which is an animal model of neurodegenerative disease. After fluid infusion, shortened T2 showed in hippocampus and ventricles, and prolonged T2 was in corpus callosum and amygdala. The analysis of T2 distribution with rNNLS showed that a component with T2 around 100-200ms was increased in both T2-altered regions. We attributed this component as a restricted interstitial fluid, which could be correlated to the function of
Introduction
The fluid distribution in brain tissue is in a homeostasis state. However, the robustness of this homeostasis state may be weakened with neurodegenerative disease. The recently discovered glymphatic system demonstrated that the brain fluid circulation contributed to the waste clearance, and the dysfunction of fluid circulation could be associated with neurodegenerative disorders. Spontaneously hypertensive rat (SHR) is a good choice for this study, due to its propensity of dementia and AD.1,2 According to our previous study, water administration of 2% body weight at SHR induced T2 prolonging or shortening in some brain regions, while the control group of Wistar Kyoto rat had no apparent change.3 In this study, we investigate the tissue fluid distribution within voxels by analyzing the multiple spin echo sequence using regularized non-negative least square (rNNLS), which produces robust analyses of multi-component T2 decay curves in terms of a smooth T2 distribution.4Materials and Methods
SHR rats were anesthetized by 1.5 % isoflurane and injected with normal saline (2ml/100g) via tail vein at 7T Bruker Clinscan MRI scanner. Multi-echo spin echo images were acquired before and right after infusion, with the following parameters: TR = 3000ms, TE: from 10 to 320ms with an interval of 10ms, matrix size = 256x256, FOV = 35mm, slice number = 3, slice thickness = 1.5mm, distant factor = 10%. The pre- and post-injection T2 maps were calculated by a monoexponential fitting on all even echoes. T2 distribution was calculated by the even echoes as well with regularized non-negative least square (rNNLS) with 120 logarithmically spaced from 1ms to 2000ms. The regularizer μ is adjusted iteratively until χ2 in the interval between 1.02χ2min and 1.025χ2min, where the χ2min is the unregularized result. Four components of T2 are separated into myelin water (under 30ms, MW) fraction, intra/extracellular water (31-100ms, IEW) fraction, restricted interstitial fluid (100-200ms, rISF) fraction, and CSF (over 200ms) fraction.Results
T2 mapping of one representative SHR was shown in fig. 1. In all SHR (N=7), hyperintensity of T2 map was observed at enlarged ventricles and hippocampus (HC), and it can be attributed to the brain tissue atrophy.2 Significantly shortened T2 was observed in ventricles and HC regions, while significantly prolonged T2 was in corpus callosum (CC) and amygdala (AM). The ROIs were semi-automatically chosen on a T2W image in fig. 2. The rNNLS fitted T2 distribution of these ROIs were shown in fig.3 with log-scaled time axis. In T2-shortened regions (ventricles and HC), the value of MWF was decreased, CSF fraction was left-shifted to rISF fraction. Therefore, the overall T2 was shortened. In the T2-prolonged regions, the rISF and CSF contributed only 2% before infusion. After infusion, a significant increase in the rISF fraction appeared, and lead to the increase of overall T2. In grey matter, all component fraction was unchanged after infusion. For further spatial visualization, we demonstrated the fluid fraction maps of each component before and after infusion in fig. 4. The rISF showed a significant increase, and the regions are consistent with both T2-shortened and T2-prolonged regions in fig. 1. Furthermore, a clear increase also observed in the MW fraction.Discussion
The T2 alteration is clearly observed after massive fluid infusion on SHR rat. Both the T2-shortening and T2 prolonging phenomenon can be attributed to fluid increase with T2 around 100-200ms, i.e. the rISF fraction in our result. The T2 between 100-200ms is lower than the pure CSF. In theory, the rNNLS analysis of T2 distribution had excluded the partial volume effect. Therefore, we anticipated that the infused fluid was in a restricted interstitial space with lower T2 and ADC (data not shown). In the T2 prolonged CC and AM, the IEW peak in T2 distribution spectrum was also left-shifted, and a significant rISF peak appeared after infusion. We suspected that these tissues were abnormally compressed after infusion, which resulted from the loss of cell density. The glymphatic system may be correlated to the rISF, because it is expected that the massive fluid is expelled from the glymphatic pathway. Our results may shed a light on in vivo functional imaging of glymphatic system.Acknowledgements
Center for Advanced Molecular Imaging and Translation, Chang Gung Memorial Hospital, LinkouReferences
- Sabbatini M et al., The hippocampus in spontaneously hypertensive rats: An animal model of vascular dementia? Mech Ageing Dev. 2002;123(5):547-559
- Bedussi B et al., Enhanced interstitial fluid drainage in the hippocampus of spontaneously hypertensive rats. Sci Rep. 2017;7(1):744.
- Chao KI et al., Assessment of hydrodynamics and T2 alterations in spontaneously hypertensive rat under short-term hyperhydration. ISMRM proceedings. 2017
- MacKay A et al., Insights into brain microstructure from the T2 distribution. Magn Reson Imaging. 2006;24(4):515-525.
Figures
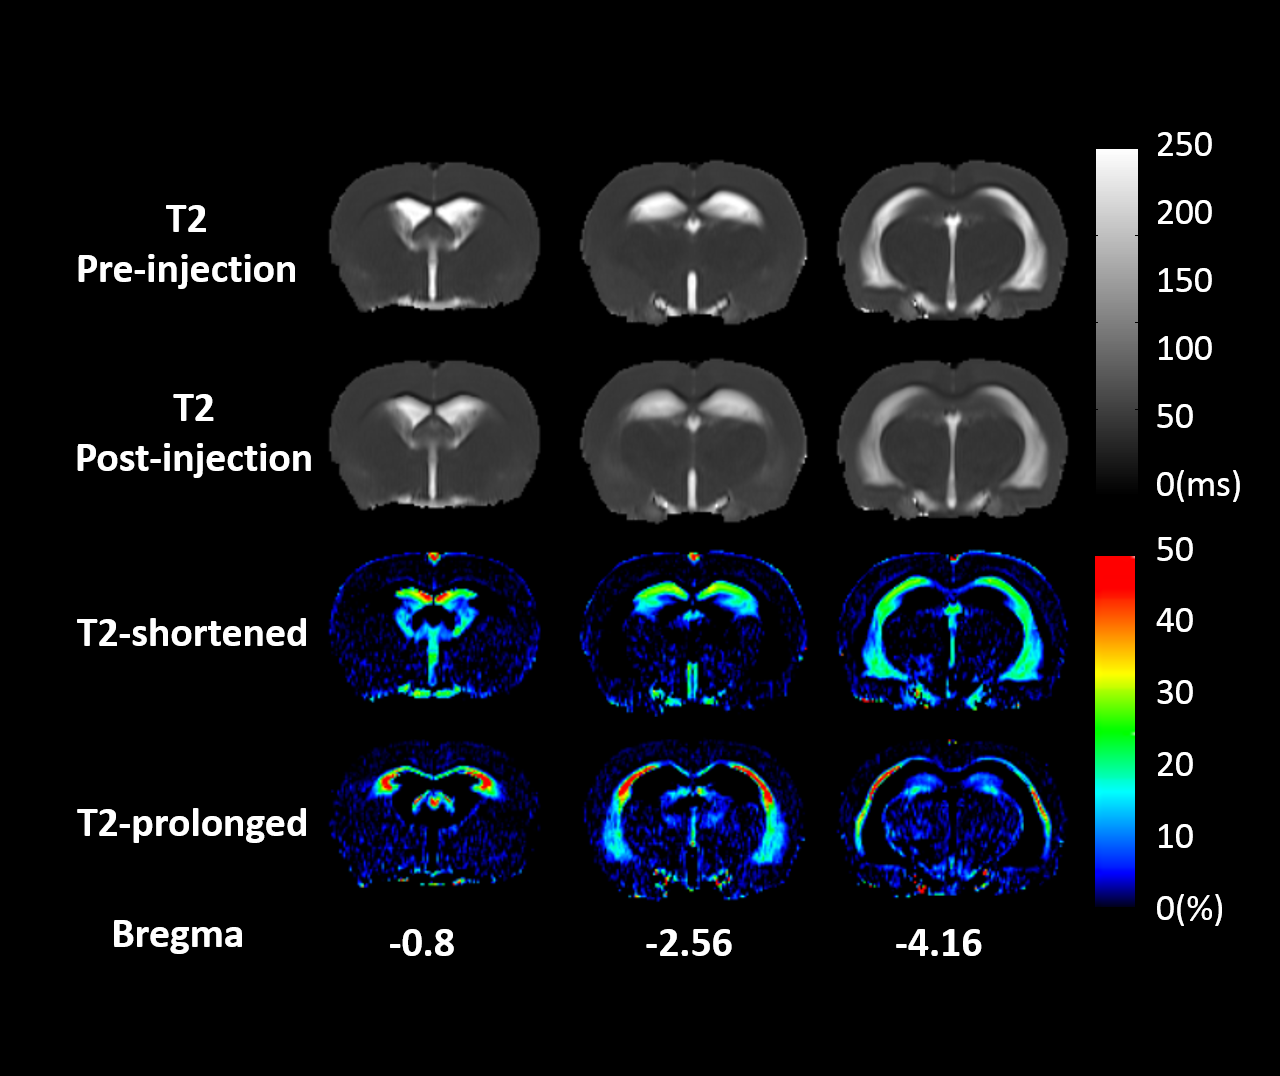
fig. 1 A representative SHR of quantitative T2 maps before (first row) and after injection (second row). The third row showed T2 shortened percentage maps, and the fourth row showed the T2 prolonged percentage maps.
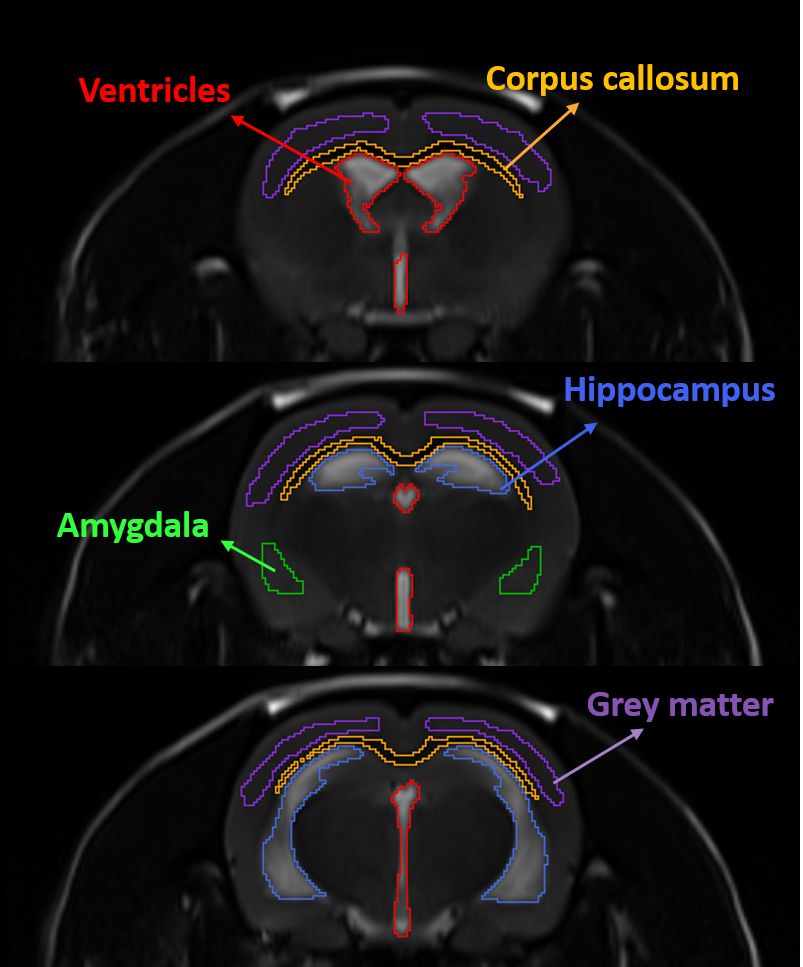
fig. 2 The multi-slice ROI on a T2W TSE image. The T2 is shortened in ventricles (red color) and hippocampus (blue color). The T2 is prolonged in corpus callosum (yellow color) and amygdala (green color). The grey matter (purple) has no significant change in T2.
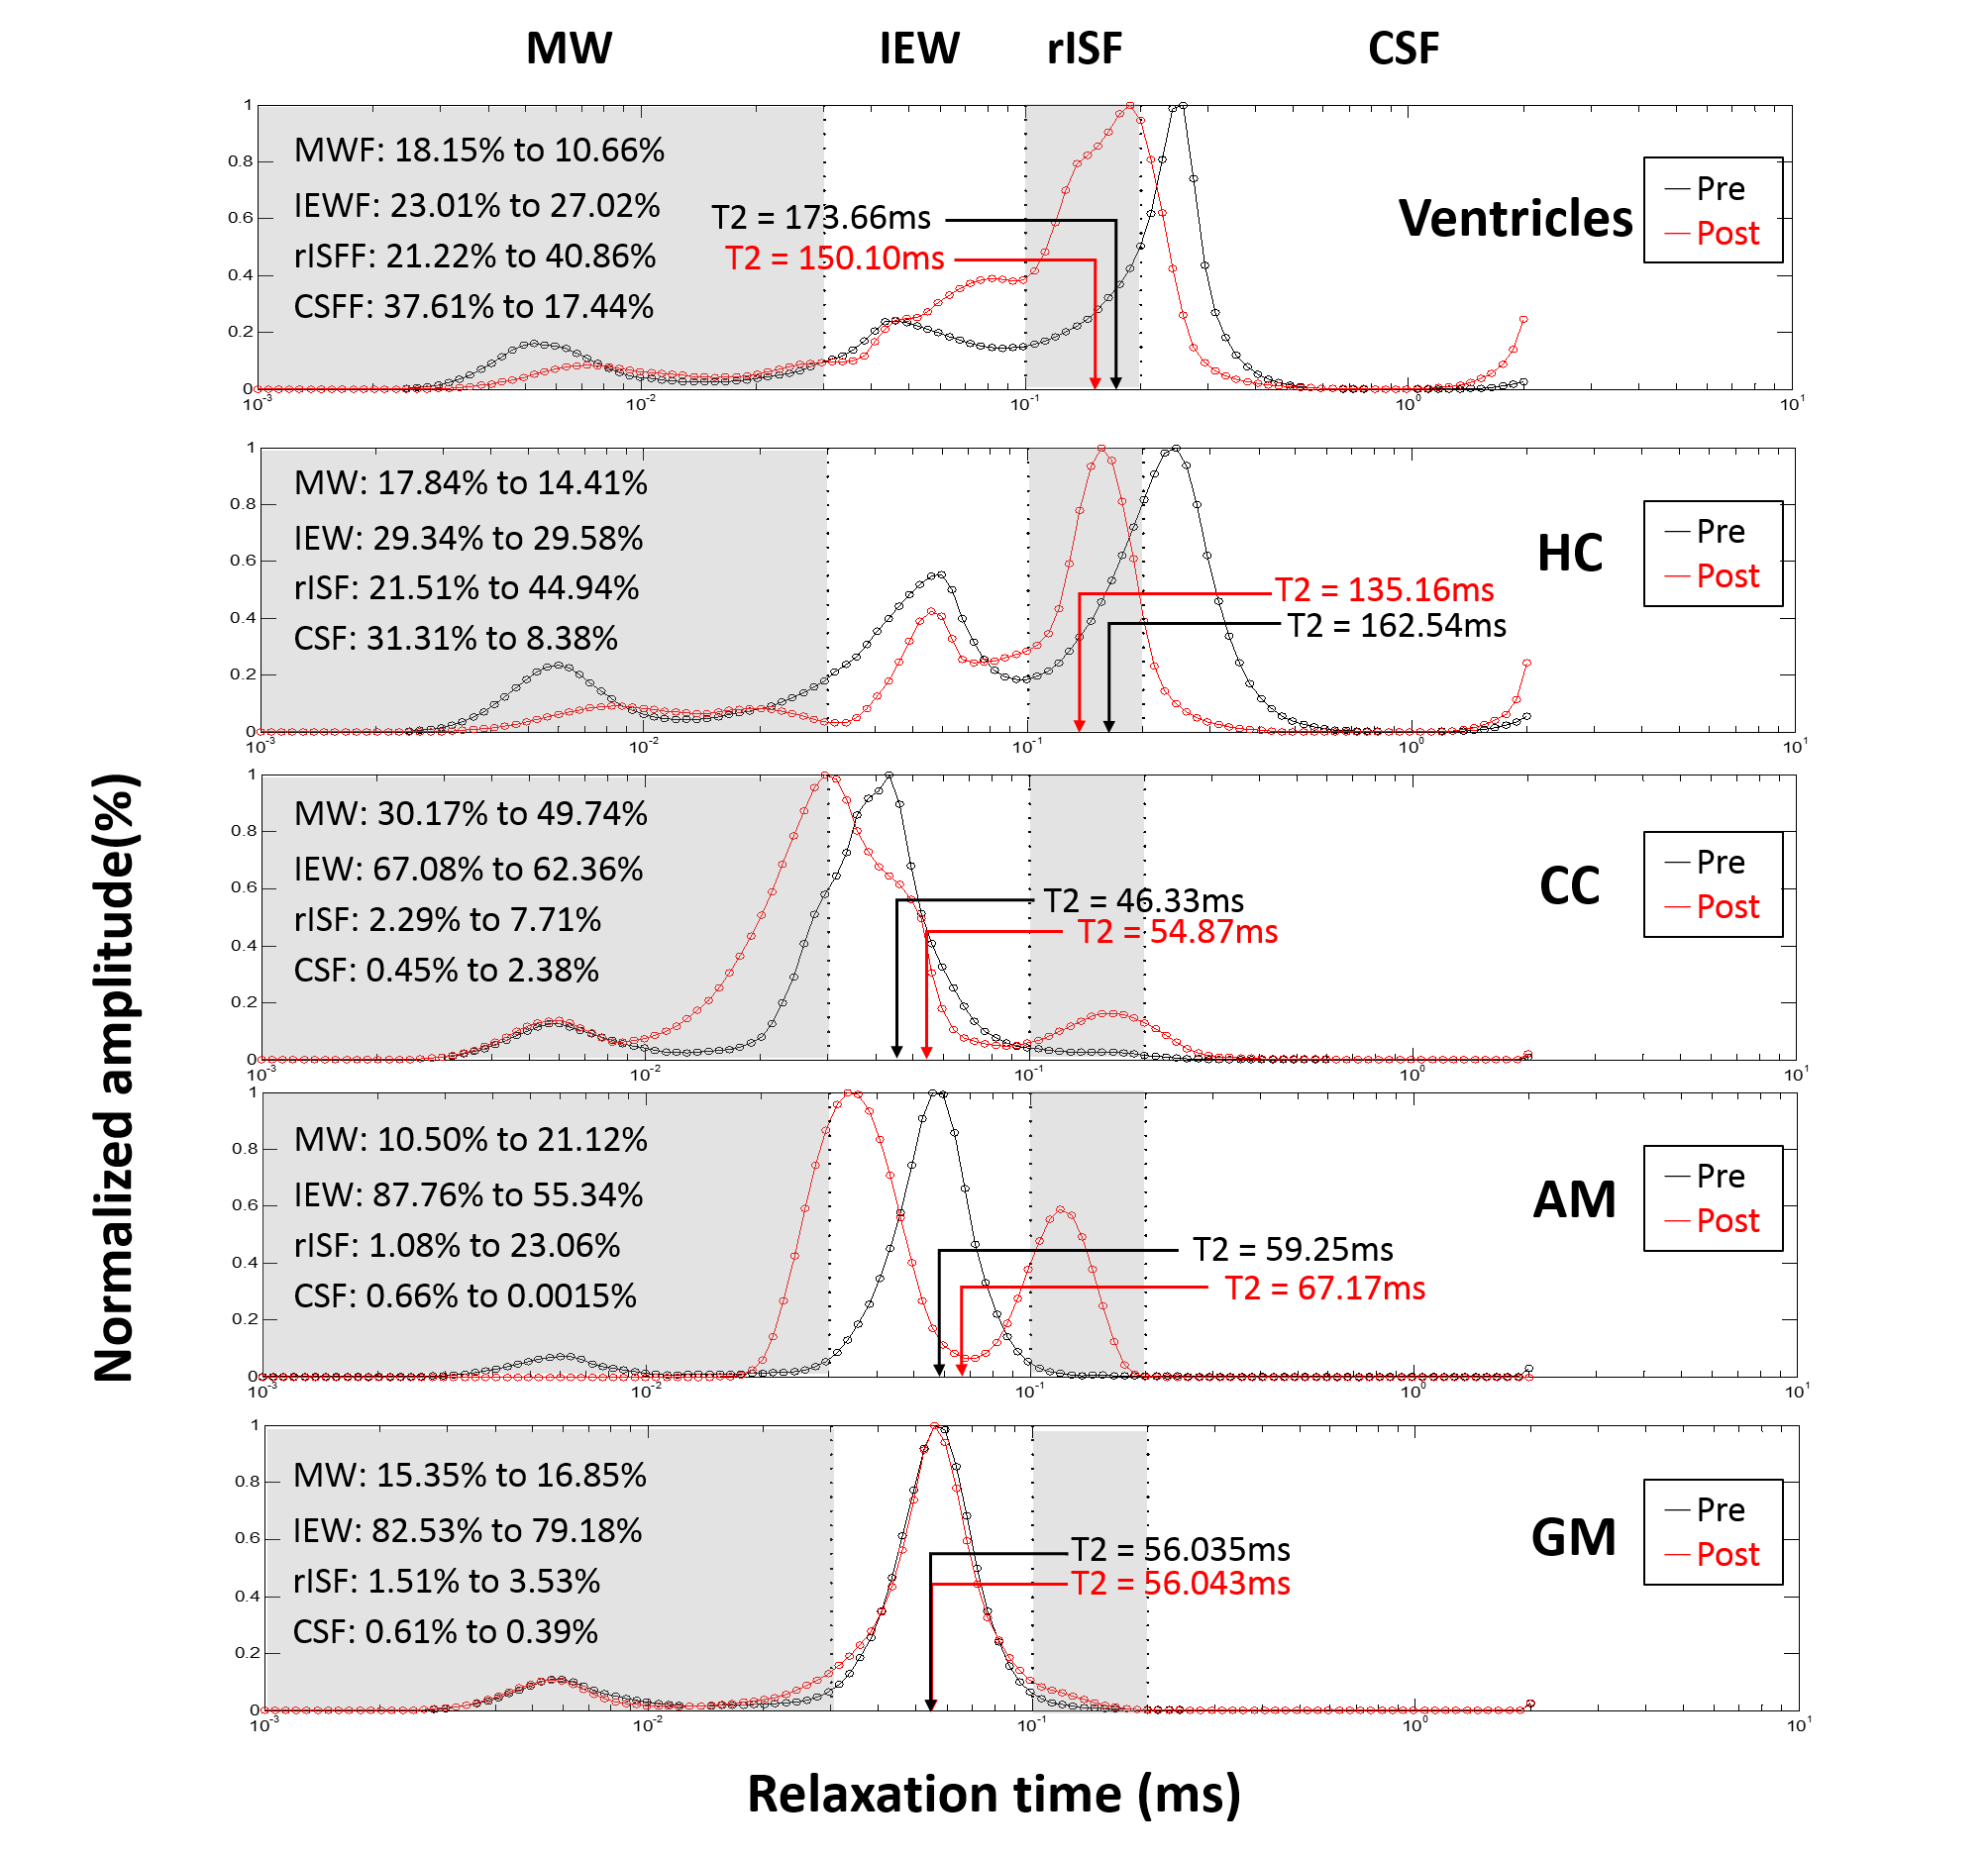
fig. 3 The pre- and post-injection T2 distribution of ventricles, hippocampus, corpus callosum, amygdala and grey matter were shown from upper to lower rows, respectively. Black lines are represented the T2 distribution of pre-injection and red lines are post-injection. The whole T2 spectrum was divided into four components: myelin water, intra/extracellular water, restricted interstitial water, and CSF. Fraction percentages are calculated by the area ratio under curves.
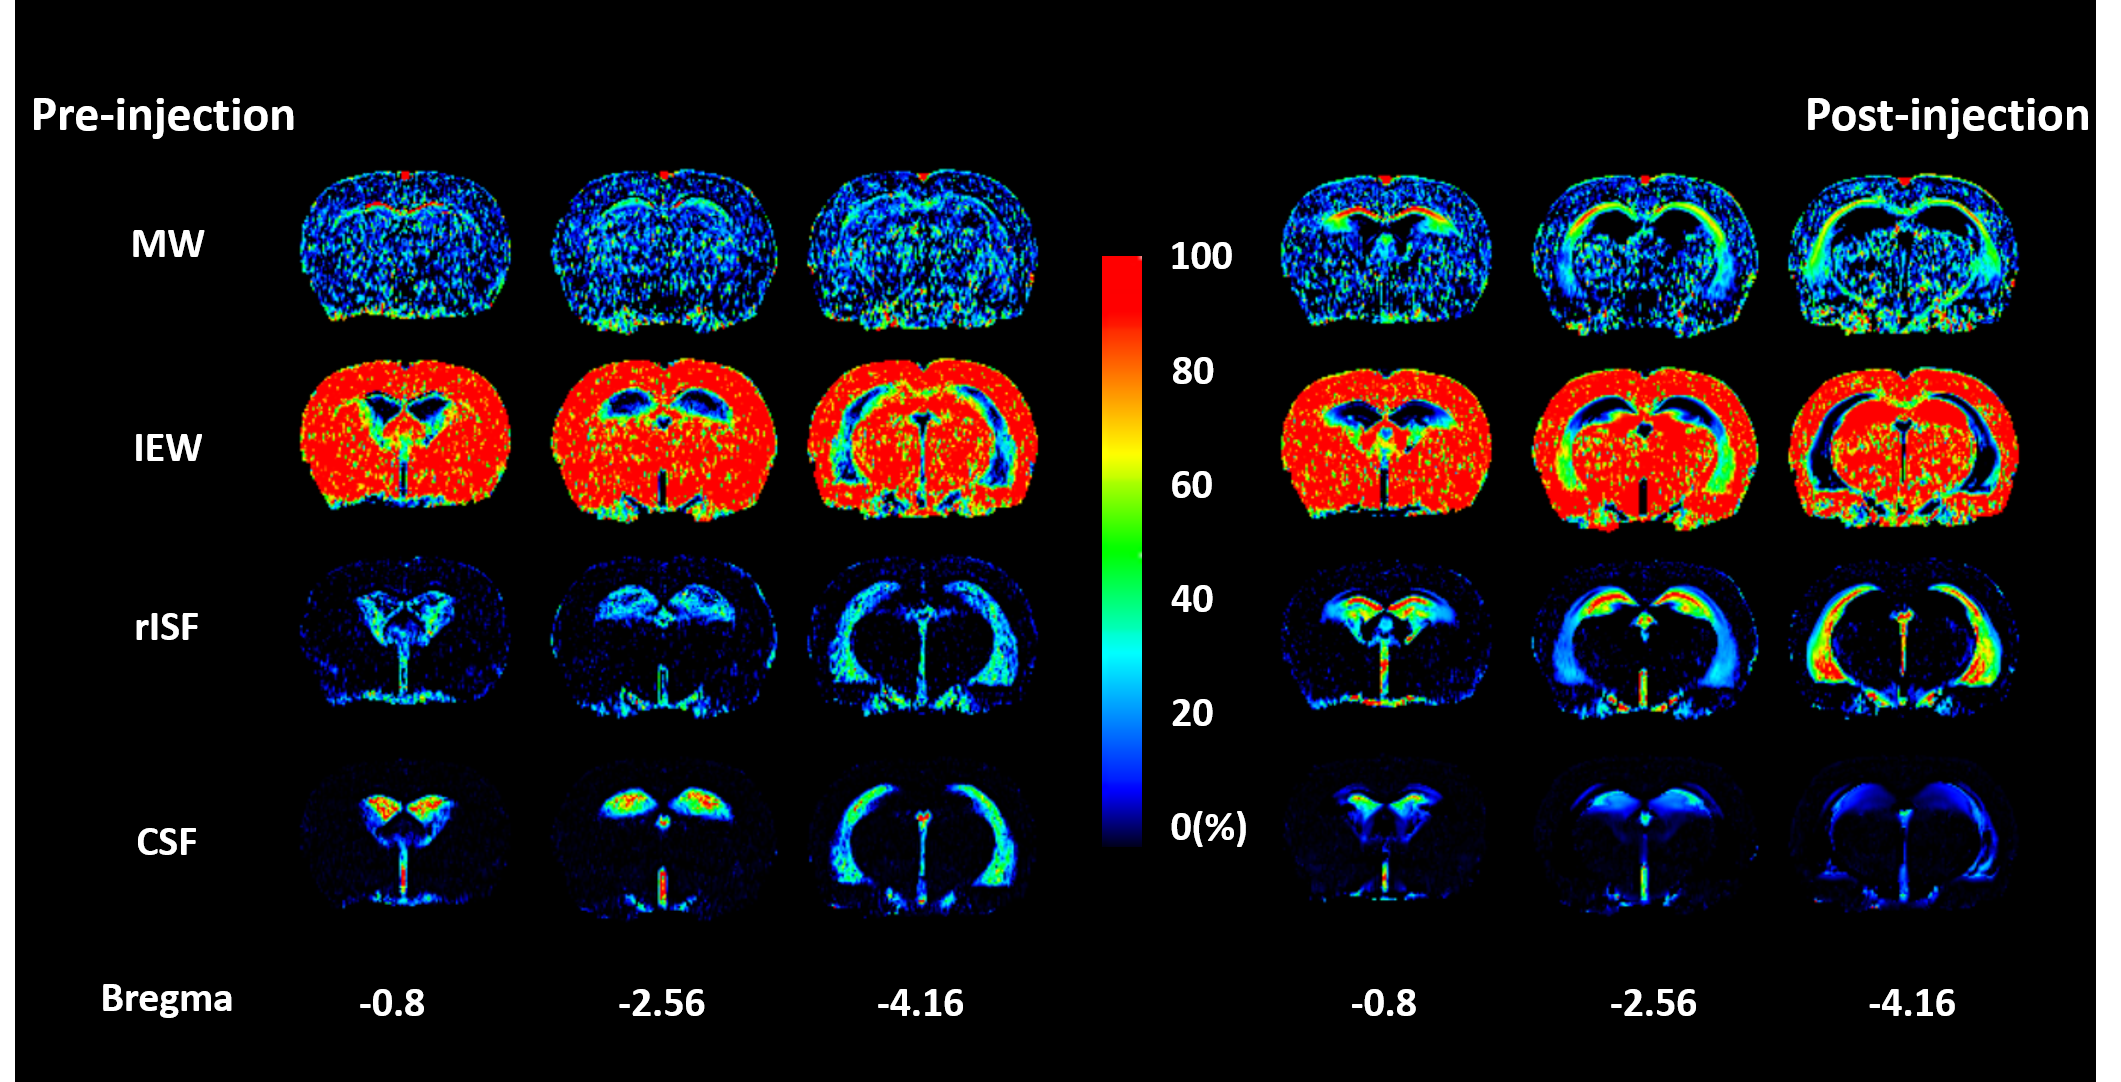
fig. 4 The fluid fraction maps of pre- (left)
and post-injection(right). The MW in CC showed an enhancement after infusion.
The IEW is distributed in whole brain parenchyma with a decrease at AM after
infusion. The rISF fraction significantly increased after infusion, and the
enhancement spatially correlated to both T2-shortened and T2-prolonged regions
in fig. 1.