4968
Tomoelastography of the mouse brain by multifrequency single-shot MR elastography1Department of Radiology, Charité - University Medicine Berlin, Berlin, Germany, 2Department of Neurology, Charité - University Medicine Berlin, Berlin, Germany, 3Department of Medical Informatics, Charité - University Medicine Berlin, Berlin, Germany
Synopsis
The overall aim of this study was to introduce in-vivo multifrequency single-shot MR elastography (MRE) for full-field-of-view stiffness mapping of mouse brain and to compare in-vivo stiffness of neural tissues featuring different white-to-gray matter ratios. Tomoelastography retrieves mouse brain stiffness with greater detail. The measured order of shear vave speed values indicates that white matter in the mouse brain is softer than gray matter within the examined frequency range from 900 to 1400 Hz.
Introduction
Cerebral MRE of the mouse allows the investigation of brain mechanical properties in vivo1-6. Compared to in-vivo human MRE, elasticity measurements in the mouse at high field strengths are challenged by large susceptibility variations making the application of fast multifrequency MRE imaging methods difficult. For this reason, high-resolution MRE in the mouse remains a challenge. Recently introduced tomoelastography has been demonstrated as a noise-robust method for full field-of-view MRE in abdominal and pelvic organs in humans7,8. However, tomoelastography has never been applied to the human brain since heterogeneity and prevalent solid-fluid (slip) interfaces disturb the directional filters required by tomoelastography data processing9. On the other hand, the mouse brain has relatively smooth boundaries which favors the application of directional filters towards high-resolution elasticity maps by tomoelastography. The overall aim of this study was twofold: i) introduction of tomoelastography for high-resolution brain MRE in the mouse and ii) use of the new method for investigating stiffness ratios between neural tissues with different amounts of white and gray matter. To this end, fast single-shot multifrequency EPI-MRE in the mouse was developed and stiffness maps in terms of shear wave speed (SWS) were computed. The feasibility of the introduced MRE modality combined with tomoelastography data processing was demonstrated in phantom experiments and compared to compact-0.5 T-MRE.Methods
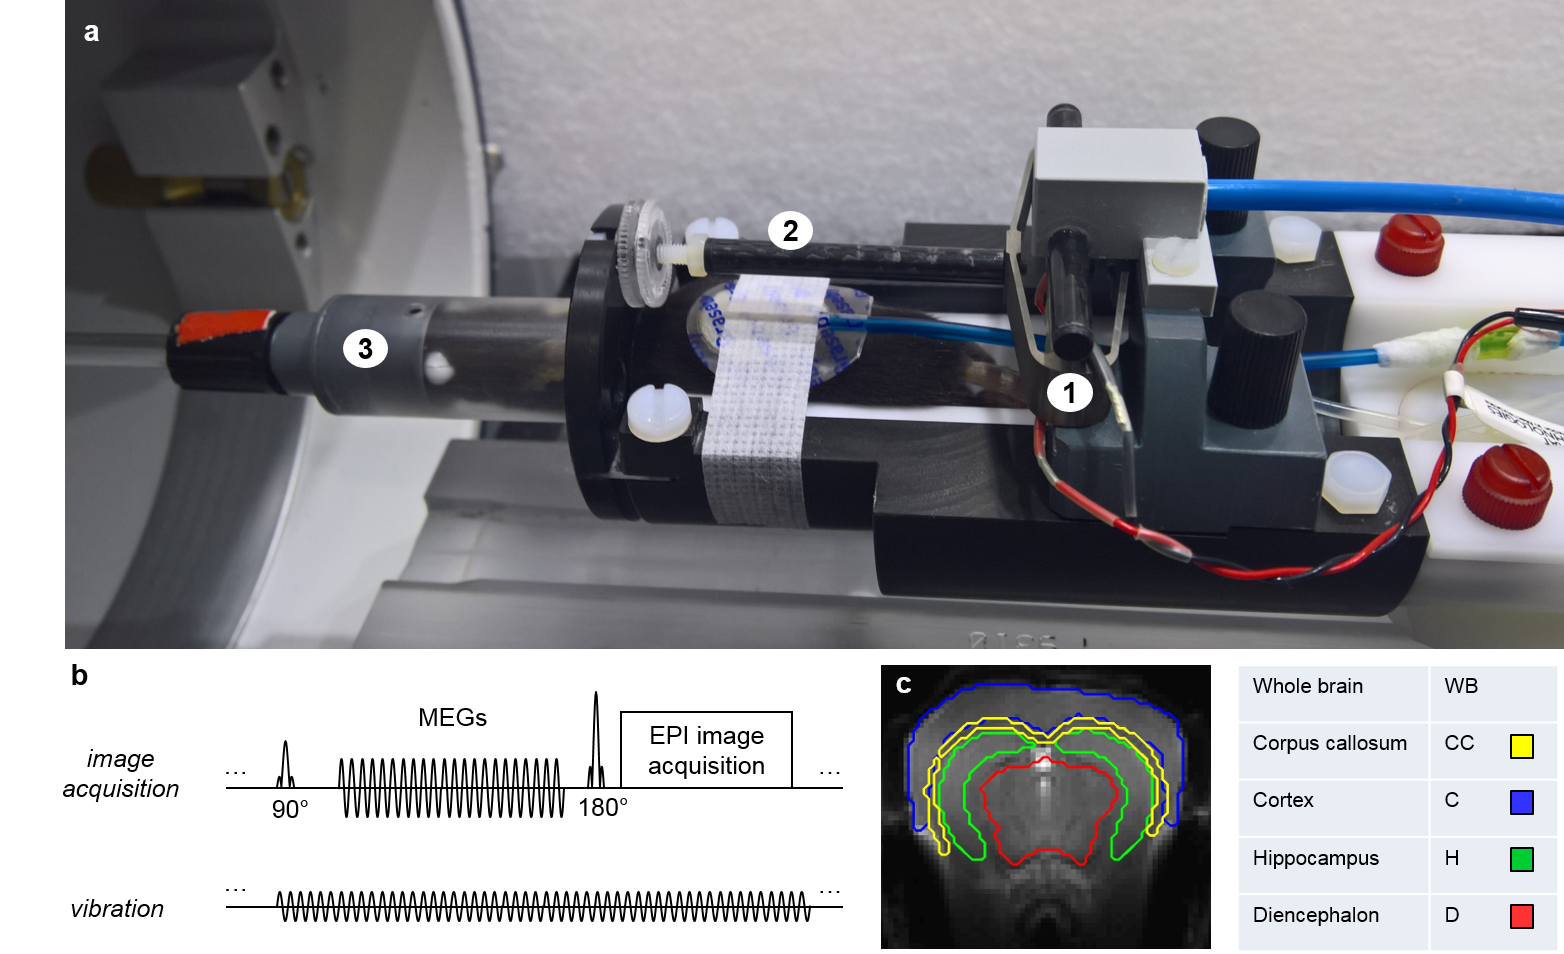
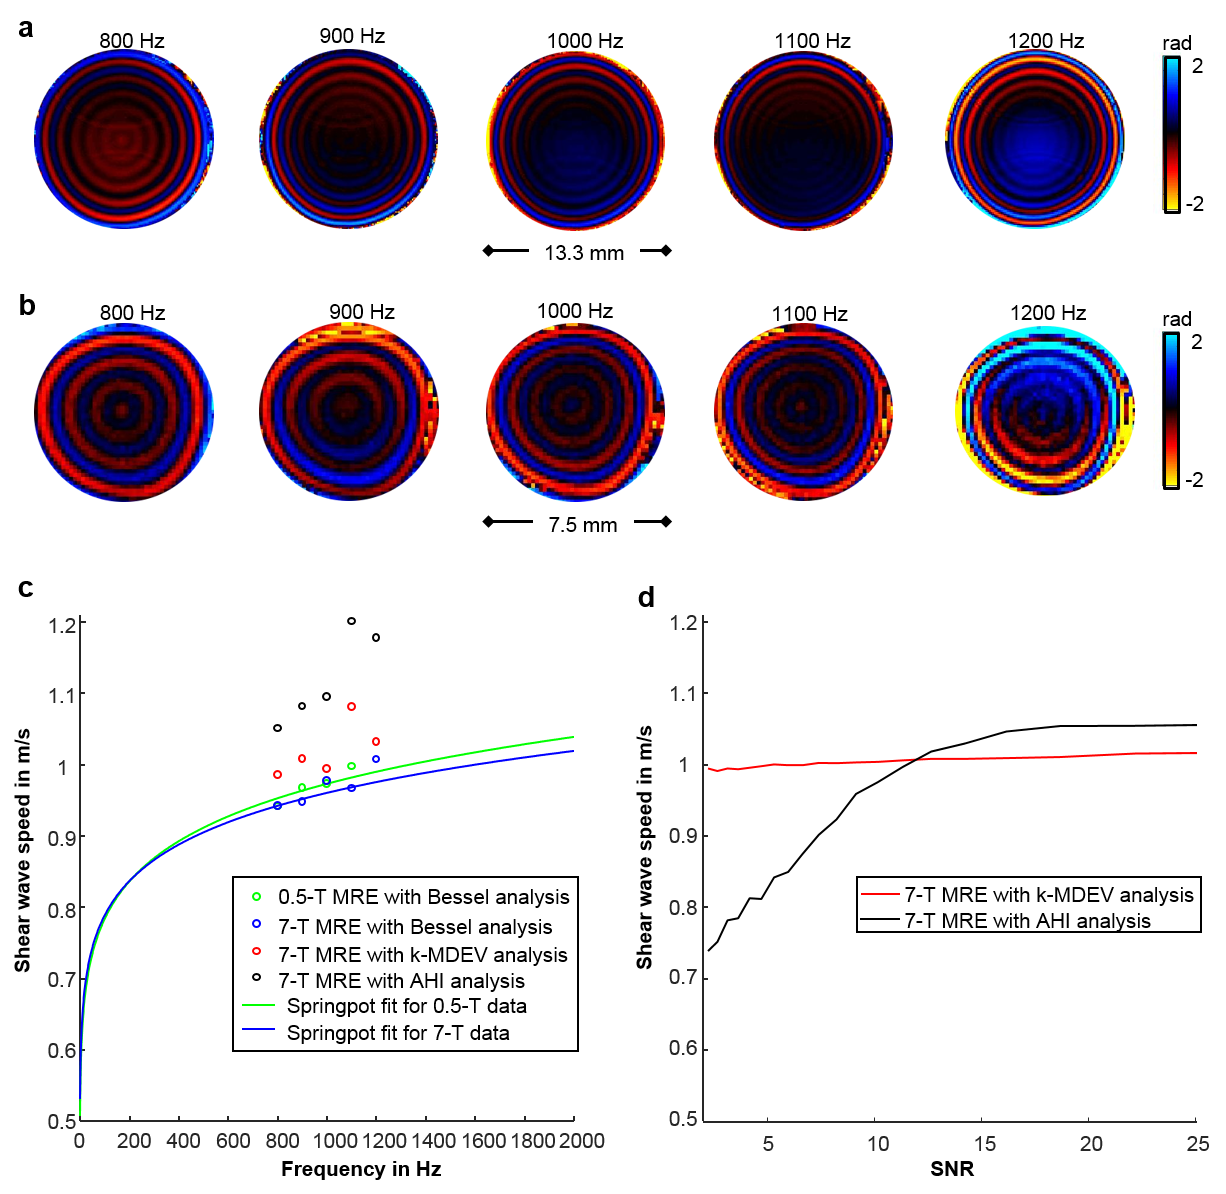
In vivo experiments with 10 healthy 6-weeks old female C57BL-6 mice were performed on a 7 T pre-clinical MRI scanner (Bruker BioSpec 70/16, Ettlingen, Germany). Vibration frequencies from 900 to 1400 Hz with 100 Hz increments and approx. 60 μm peak-to-peak displacement amplitude perpendicular to the principal axis of the magnetic field were generated by a nonmagnetic piezo ceramic actuator (CEDRAT Technologies, Meylan Cedex, France, figure 1a). 3D-wave fields were acquired with 5 axial slices through the mouse brain using a modified spin-echo echo-planar imaging (EPI) sequence (figure 1b). Main acquisition parameters were: 1500 ms repetition time, 68 ms echo time, 96 x 128 matrix size, 14.4 x 19.2 mm2 field-of-view (0.18 mm pixel edge size), 1 mm slice thickness, 2 averages for increased signal-to-noise ratio (SNR), total scan time per animal approx. 10 min. SWS of the whole brain (WB), cortex (C), corpus callosum (CC), hippocampus (H) and the diencephalon (D) mainly consisting of thalamus and hypothalamus (figure 1c) were calculated using algebraic Helmholtz inversion (AHI) and wavenumber (k) based multi-frequency dual elasto-visco (k-MDEV) inversion10 underlying tomoelastography. Additionally, two cylindrical ultrasound gel samples (Sonogel, Germany) were investigated in the 7 T pre-clinical MRI scanner and in a compact 0.5 T tabletop MRE device11. Setup and imaging parameters were similar to in vivo experiments, vibration frequencies were 800 to 1200 Hz (100 Hz increments). SWS were calculated using a Bessel function based analytical solution of shear waves in a z-infinite cylinder11 and subsequently fitted with the Springpot powerlaw model. Additionally, data sets were analyzed with AHI and k-MDEV.Results
Figure 2 shows results of the phantom experiments. Frequency resolved SWS obtained using Bessel regression, AHI and k-MDEV and the curves of the springpot model fit are shown in Figure 2c. The robustness of AHI and k-MDEV to decreasing SNR is plotted in Figure 2d.
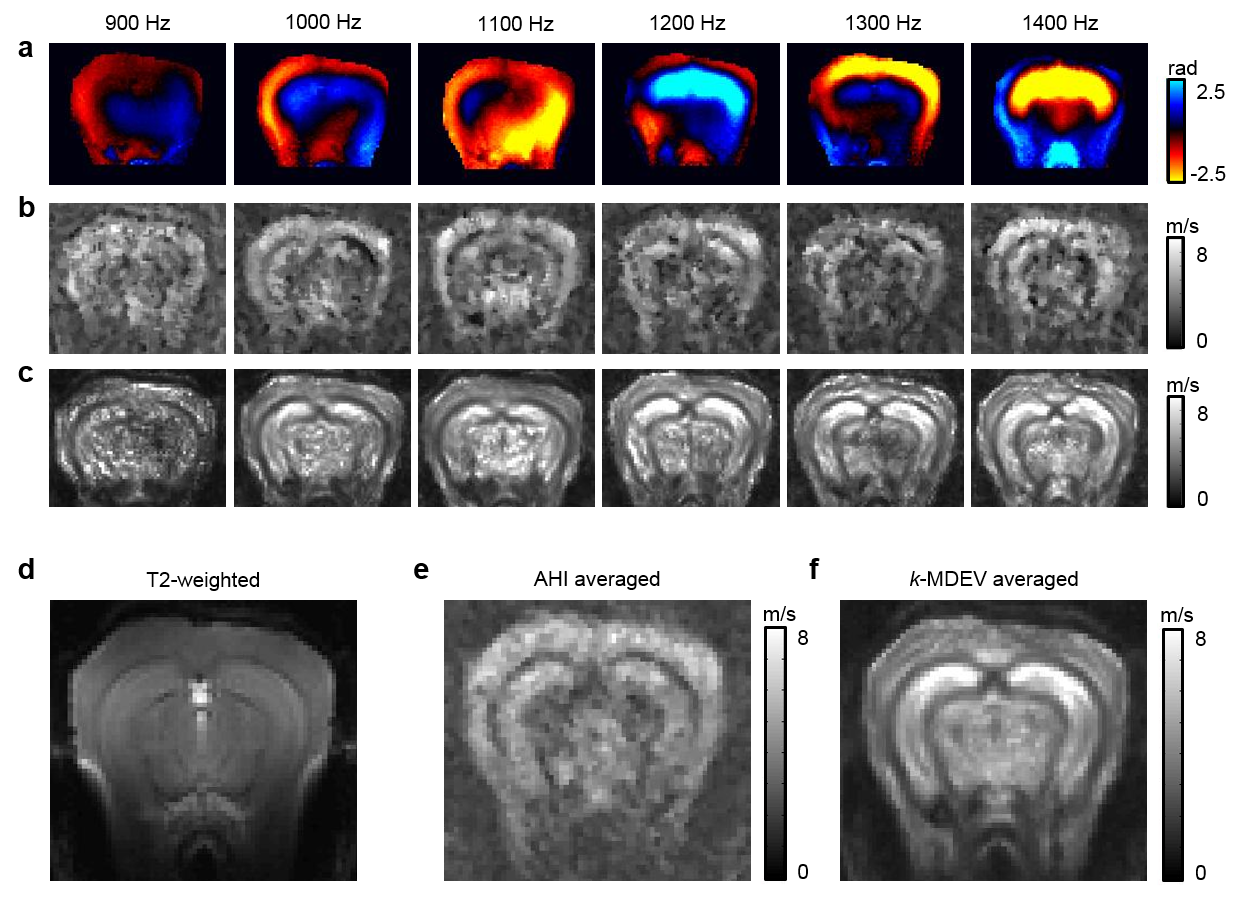
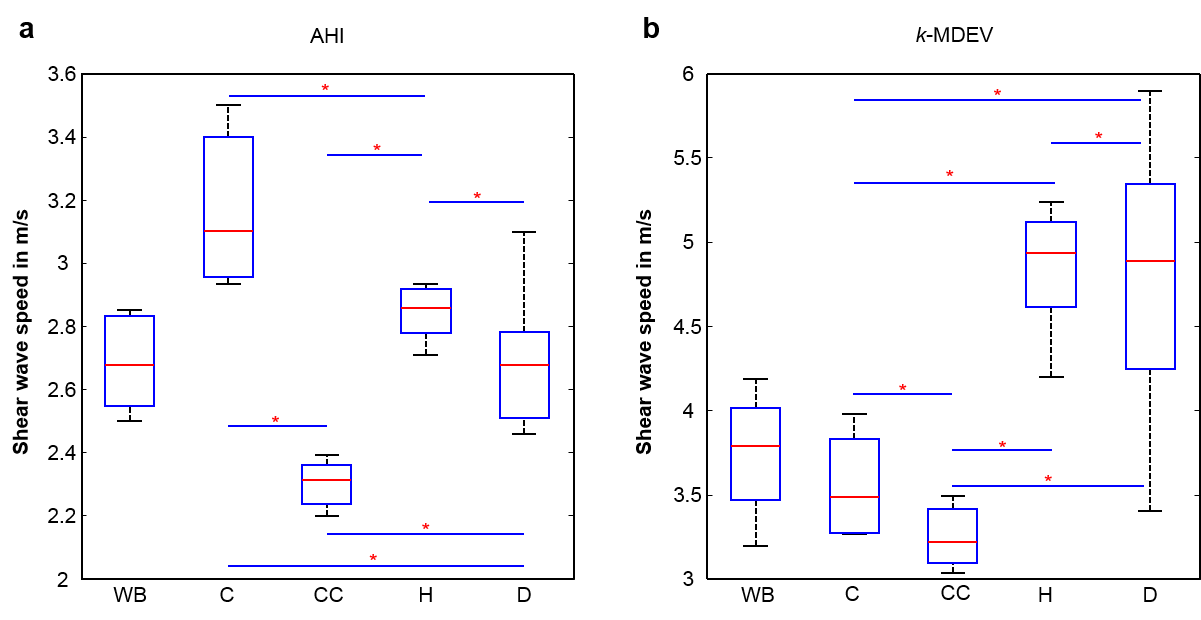
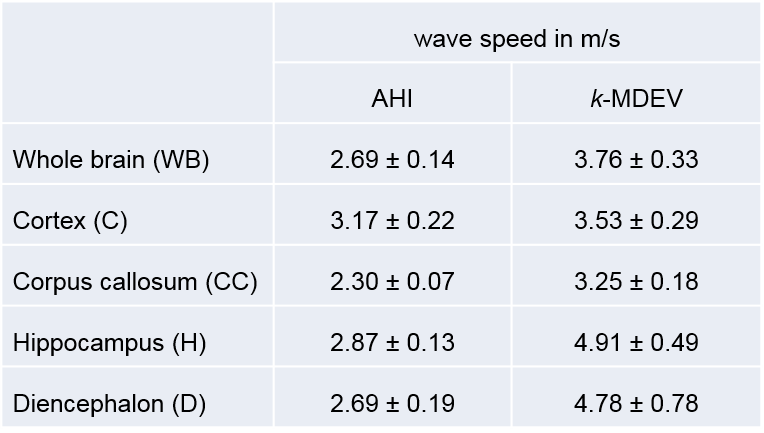
The real parts of frequency resolved complex-valued wave images of one mouse are shown in figure 3a. Figures 3b,c show corresponding SWS-maps obtained from AHI and tomoelastography. The related frequency averaged SWS-maps are shown in figures 3e,f. Group mean values obtained by AHI and tomoelastography for all analyzed brain regions are plotted in figure 4 and summarized in table 1. AHI gave SWS values for WB of 2.69±0.14m/s with highest values in the cortex (C=3.17±0.22m/s, H=2.87±0.13m/s, D=2.69±0.19m/s, CC=2.30±0.07m/s). Tomoelastography based SWS values were 3.76±0.33m/s for WB with highest values in the hippocampus (H=4.91±0.49m/s, D=4.78±0.78m/s, C=3.53±0.29m/s, CC=3.25±0.18m/s).
Discussion/Conclusion
This study introduced fast single-shot EPI-MRE and demonstrated the feasibility of tomoelastography of in vivo mouse brain. Phantom experiments showed that AHI was more biased by noise and provided less details for anatomical structures in SWS-maps than tomoelastography. Results of shear wavelength-based Bessel regression and Springpot modeling of 7 T MRE data are in good agreement with respective results of tabletop MRE suggesting the stability of the obtained parameters and their true quantitative character. High-resolution tomoelastography-based SWS-maps clearly indicated that white matter of CC is softer than H. This finding contradicts previous reports from in vivo MRE of the human brain9 but agrees to micro-indentation measurements of rat brain12. The median stiffness of WB was between values previously reported1-6.Acknowledgements
No acknowledgement found.References
1. Murphy CM et al., Magnetic resonance elastography of the brain in a mouse model of Alzheimer’s disease: initial results, Magn Reson Imaging 30(4): 535–539, 2012.
2. Atay M et al., Measurement of the Dynamic Shear Modulus of Mouse Brain Tissue In Vivo by Magnetic Resonance Elastography, J Biomech Eng 130:021013, 2008.
3. Clayton EH et al., Frequency-Dependent Viscoelastic Parameters of Mouse Brain Tissue Estimated by MR Elastography, Phys Med Biol 56(8): 2391–2406, 2011.
4. Schregel K et al., Demyelination reduces brain parenchymal stiffness quantified in vivo by magnetic resonance elastography. Proceedings of the National Academy of Sciences of the United States of America 109(17):6650-6655, 2012.
5. Riek K et al., Magnetic resonance elastography reveals altered brain viscoelasticity in experimental autoimmune encephalomyelitis. NeuroImage: Clinical 1(1):81-90, 2012.
6. Millward JM et al., Tissue structure and inflammatory processes shape viscoelastic properties of the mouse brain. NMR in biomedicine 28(7):831-839, 2015.
7. Dittmann F et al., Tomoelastography of the abdomen: Tissue mechanical properties of the liver, spleen, kidney, and pancreas from single MR elastography scans at different hydration states, Magn Reson Med 78(3): 976-983, 2017.
8. Dittmann F et al., Tomoelastography of the prostate using multifrequency MR elastography and externally placed pressurized-air drivers, Magn Reson Med. doi: 10.1002/mrm.26769, 2017.
9. Hirsch S et al., Magnetic Resonance Elastography: Physical Background And Medical Applications: Wiley-VCH 2017
10. Tzschätzsch H et al., Tomoelastography by multifrequency wave number recovery from time-harmonic propagating shear waves, Med Image Analysis (30):1-10, 2016.
11. Braun J et al., A compact 0.5 T MR elastography device and its application for studying viscoelasticity changes in biological tissues during progressive formalin fixation. Magn Reson Med. doi: 10.1002/mrm.26659, 2017.
12. Christ AF et al., Mechanical difference between white and gray matter in the rat cerebellum measured by scanning force microscopy, J Bio Mech 43(15):2986-92, 2010.
Figures