4967
Assignment of Two More Fucose-α-(1-2)-Galactose Glycans in the Human Brain Linked in Animal Models to Learning and Memory1Translational Research Institute, Brisbane, Australia, 2Faculty of Health, Queensland University of Technology, Brisbane, Australia, 3University of Newcastle, Newcastle, Australia
Synopsis
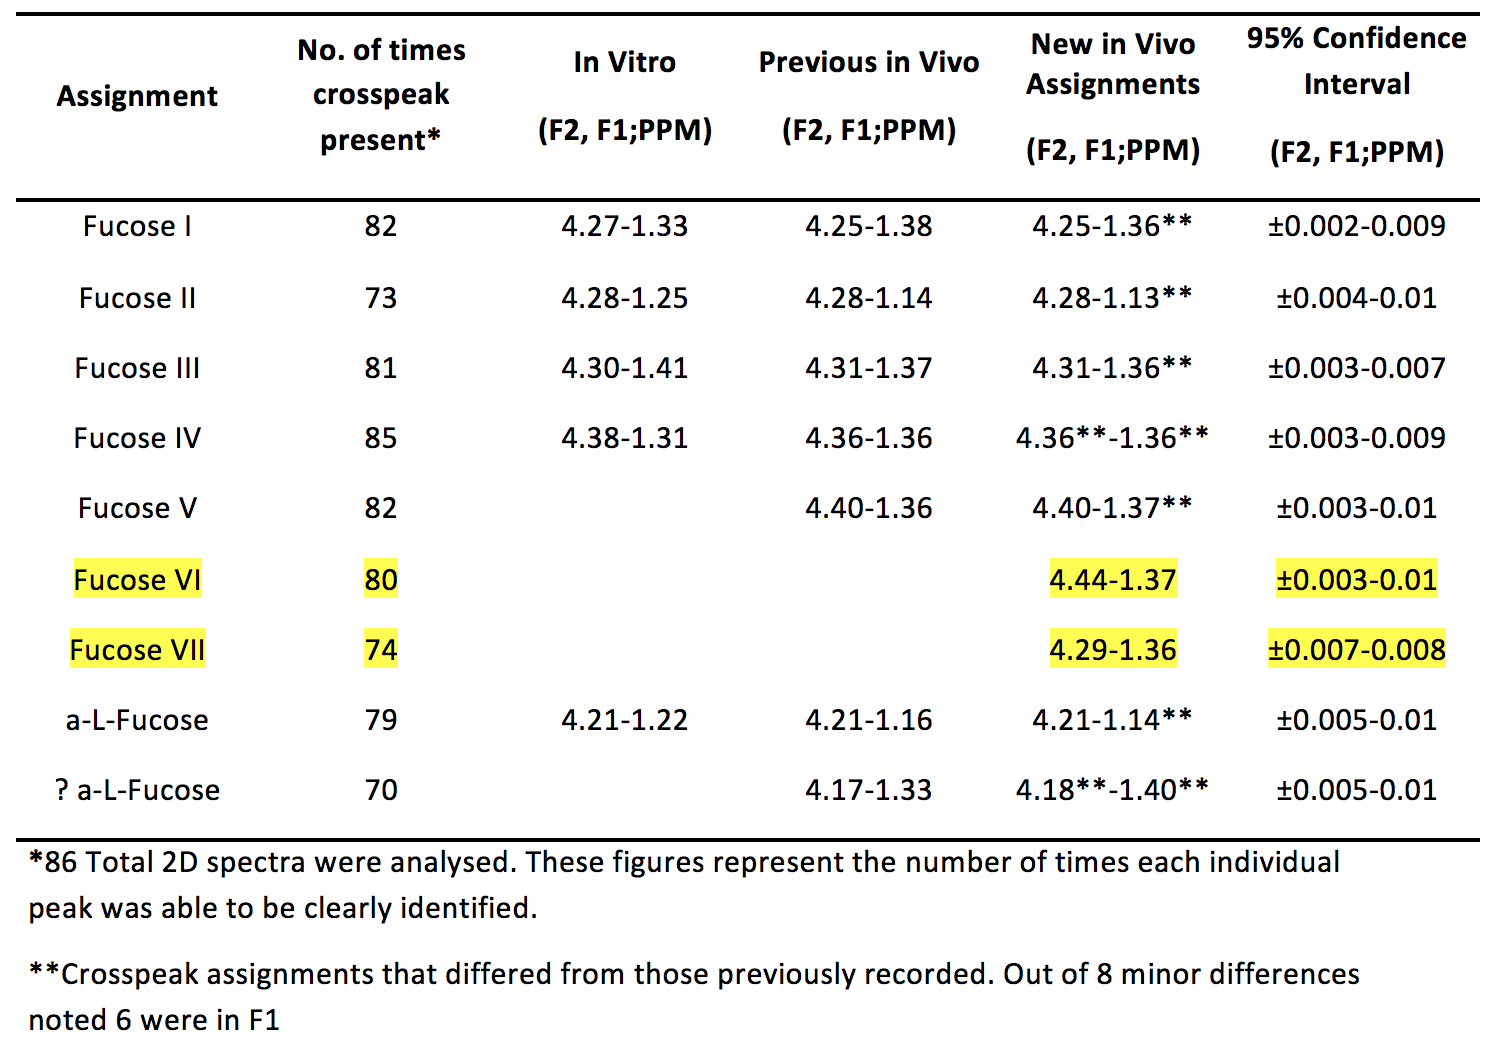
Two-dimensional COSY scans at 3T using a 64 channel head and neck coil have enabled the inspection of fucose-α-(1-2)-galactose glycans that resonate in the region of F1=0.9-1.7ppm; F2= 4.1-4.5ppm. With accurate shimming and water suppression, two new peaks were identified (Fuc VI at 4.44-1.37 ppm and Fuc VII at 4.29-1.36 ppm). These cross-peaks were consistently visualised across 86 participants.
INTRODUCTION:
A group of fucosylated glycans have been identified in animal models, using immunostaining techniques, to be involved in the neuronal processes that underlie development, learning and memory [1-4]. It has previously been reported that six fucose-α-(1-2)-galactose residue cross peaks are available for inspection in two dimensional (2D) COrrelated SpectroscopY (COSY) at 3T using an 8 or 32 channel head coil [5, 6]. This study aimed to use more advanced MR hardware and technology to expand our knowledge of the fucosylated glycan region of the 2D COSY spectrum. We also examined the role of careful shimming and water suppression since the fucose region of the spectrum extends to 4.5 ppm, which is close to the water signal.METHODS:
Data Acquisition: Eighty-six human 2D COSY data sets have been used to make these new assignments. All data were collected on a Siemens 3T PRISMA with a 64 channel head and neck coil. A 3D MPRAGE (TR/TE=2530/1.7 ms, 12-degree flip angle, FOV= 256x256mm, voxel size 1x1x1 mm, NEX 4) was used for voxel localisation. 2D COSY data was obtained using Point RESolved (PRESS) volume selected spectroscopy (TE 33ms, TR 1500 ms) with a 3x3x3 cm voxel placed in the Posterior Cingulate Gyrus (PCG). 2D COSY data were collected with the following acquisition parameters: RF carrier frequency at 2.0 ppm; TE/TR 33/1500ms; water suppression (35Hz); spectral width of 2000Hz; increment size of 0.8 ms in 96 t1 increments giving an indirect spectral width of 1250Hz; 8 averages per increment; and 1024 data points. Careful placement of the voxel ensured mainly grey matter tissue. If the voxel were placed over either the corpus callosum, lateral ventricles or the superior sagittal sinus, then the FWHM values would consistently be greater than 15Hz.
Data Processing: Raw 2D COSY TWIX files were combined in MATLAB from multiple elements, rows concatenated into a 2D matrix and reformatted. The resulting 2D file was processed and analysed using FelixNMR. Each cross-peak within the F2=4.1-4.6 ppm and F1=0.9-1.7 ppm was selected and integrated to determine the peak chemical shift, intensity and volume.
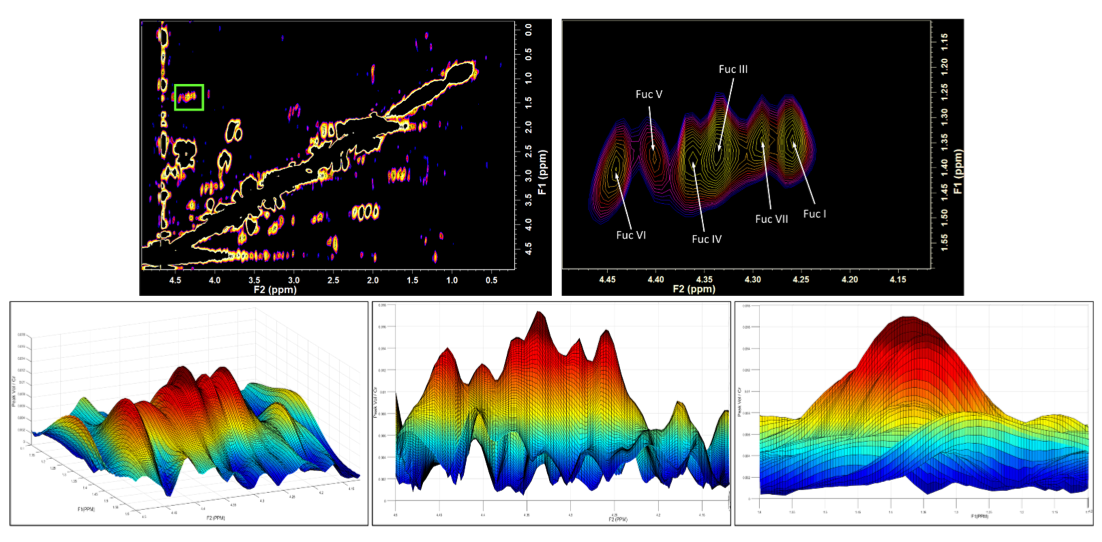
Cross Peak Identification: The region of interest was plotted as a contour plot and as a three-dimensional surface plot in MATLAB. Peaks were identified in MATLAB by rotating the surface plot on both axes. The cross-peaks were then cross-referenced against the Felix contour plot to assign peak intensity co-ordinates (Figure 1).
RESULTS:
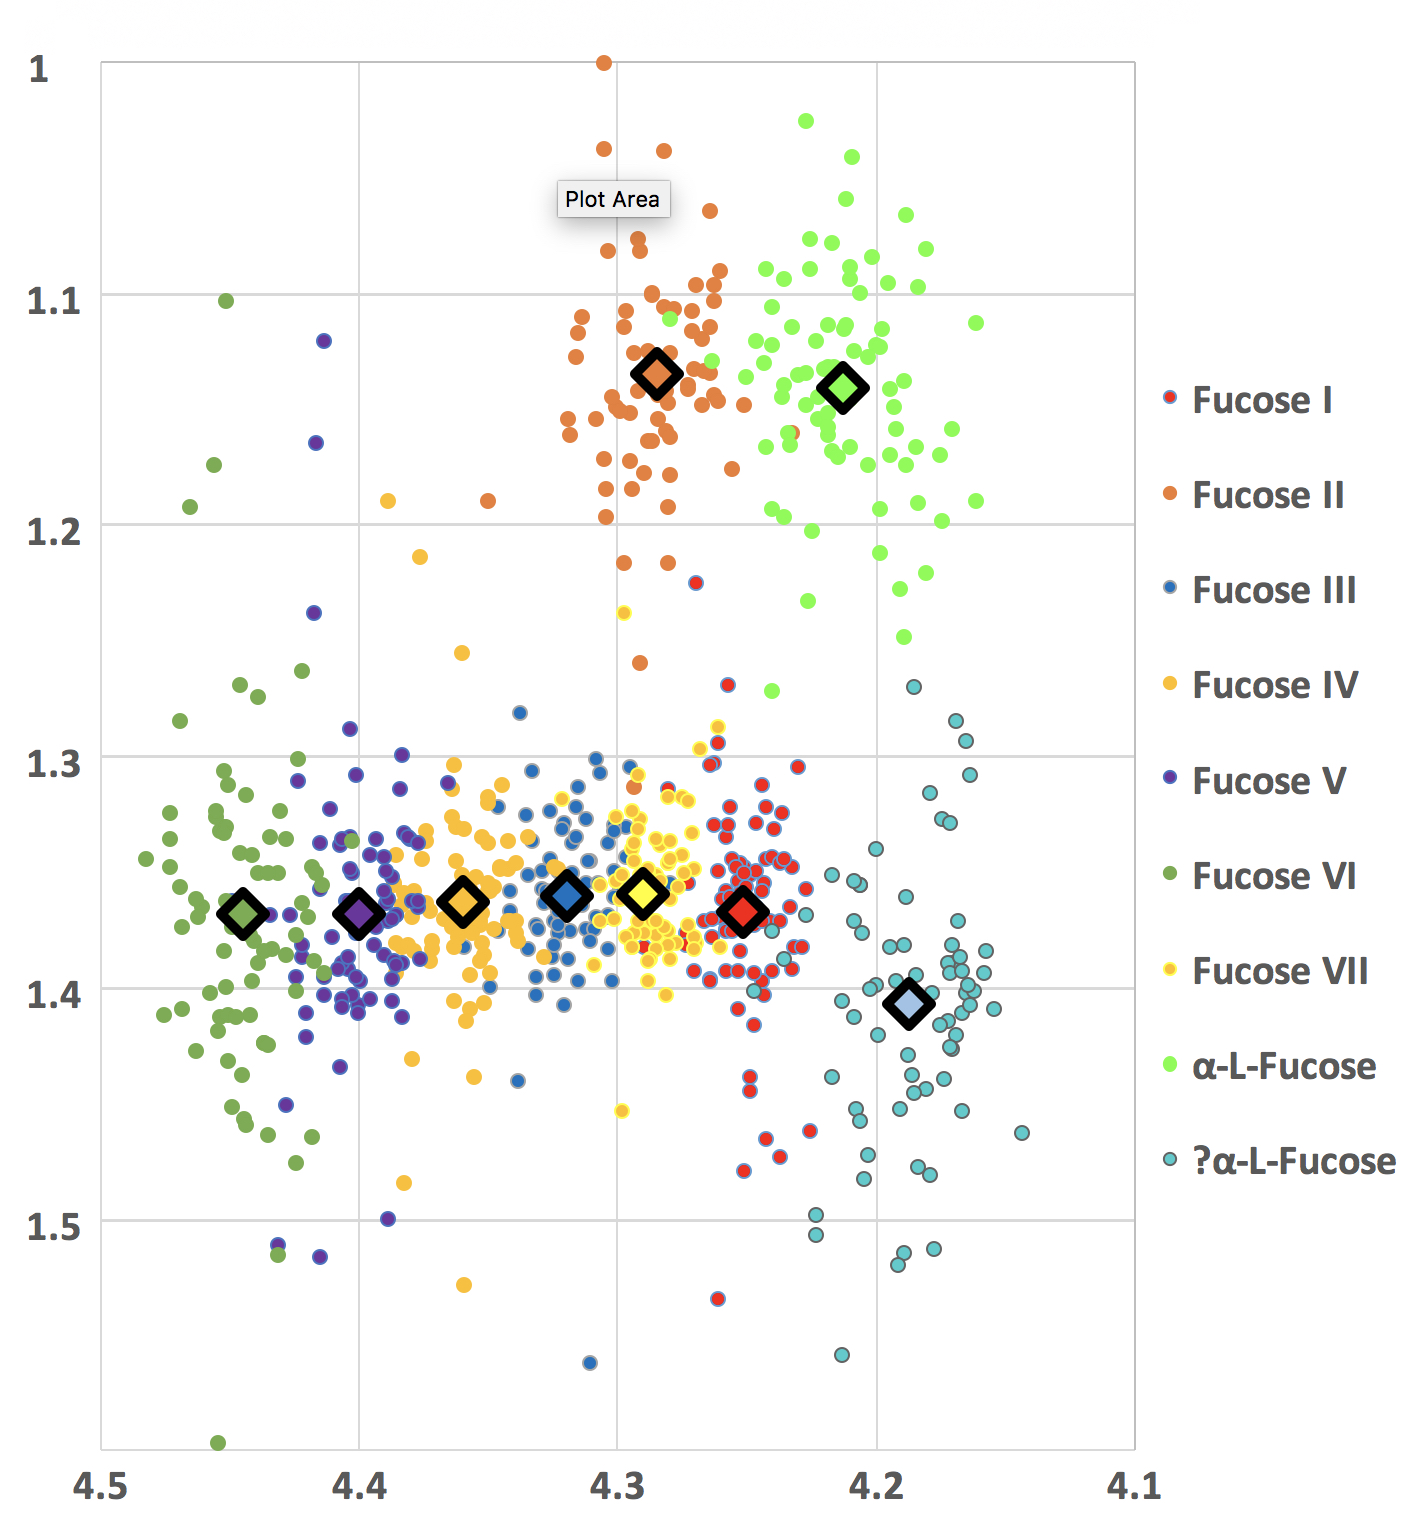
A full 2D COSY contour plot of the spectrum is displayed in figure 1 (top left), the zoomed-in fucose region (top right) (F1=0.9-1.7ppm; F2= 4.1-4.5ppm) is shown as is the 3D plot of this region. Each cross-peak was viewed in all directions to ensure accurate cross-peak assignments. These are summarised in Figure 2 and include the two new assignments at 4.44-1.37 ppm and 4.29-1.36 ppm respectively. These are to be known as Fuc VI and Fuc VII. Figure 3 shows all cross-peaks recorded and averages for all 86 examinations undertaken. Some variance with each cross-peak was noted. However, each mean cross-peak was observed with significant confidence intervals.DISCUSSION:
Evaluation of data from the state-of-the-art Prisma scanner in the 2D COSY spectral region containing the fucose-α-(1-2)-Galactose glycans showed the resolution of two additional cross-peaks which were reliably recorded. These two cross-peaks can only be seen with adequate shimming and good water suppression since both resonate close to the water signal (4.7ppm). Moreover, these cross-peaks can be unobservable in a contour plot, and it is only by plotting a 3D spectrum and rotating the plot they can be accurately visualised. The in-vivo chemical shift assignments of fucosylated glycans reported here are marginally different from those reported previously [5] using the 8 and 32 channel heads and older magnets. The Prisma magnet used in these examinations is heavier and more stable than the Trio, Tim Trio and Skyra systems. It also has less magnet drift. Also of note, there is slight variation in the chemical shifts compared with those previously reported. However, the majority of the chemical shifts are in F1, which is expected since fewer data points are collected in this frequency.CONCLUSION:
Using state of the art Prisma scanner and 64 channel head and neck coil a total of 7 Fucose-α-(1-2)-galactose glycans cross-peaks can now be recorded. This includes two new assignments-Fuc VI at 4.44-1.37 ppm and Fuc VII at 4.29-1.36 ppm. The precise structure of each glycan remains to be determined, including their relationship to memory and learning as suggested by the Caltech group [2, 3, 7].Acknowledgements
Funding was provided by the US and Australian DoD. The authors acknowledge the support of team members Aaron Urquhart, Valerie Graves and Lisa Rich for project management, Dr Saad Ramadan, for development of the L-COSY sequence, and radiographers Jameen Arm and Kylie Waters for implementing the protocols and running the scanner. We thank Defence personnel Drs Helen Cartledge, Patrick Cullinan and Amanda Toman for operational aspects.References
1. Murrey, H.E., et al., Protein fucosylation regulates synapsin Ia/Ib expression and neuronal morphology in primary hippocampal neurons. Proceedings of the National Academy of Sciences of the United States of America, 2006. 103(1): p. 21-26.
2.Murrey, H.E., et al., Identification of the Plasticity-Relevant Fucose-α (1− 2)-Galactose Proteome from the Mouse Olfactory Bulb. Biochemistry, 2009. 48(30): p. 7261-7270.
3. Hsieh-Wilson, L., The Tangled Web: Unraveling the Molecular Basis for Communications in the Brain. Engineering and Science, 2001. 64(2): p. 14-23.
4. Delikatny, E.J., W.E. Hull, and C.E. Mountford, The effect of altering time domains and window functions in two-dimensional proton COSY spectra of biological specimens. Journal of Magnetic Resonance (1969), 1991. 94(3): p. 563-573.
5. Mountford, C., et al., Six fucose-α(1–2) sugars and α-fucose assigned in the human brain using in vivo two-dimensional MRS. NMR in Biomedicine, 2015. 28(3): p. 291-296.
6. Lin, A.P., et al., Changes in the neurochemistry of athletes with repetitive brain trauma: preliminary results using localized correlated spectroscopy. Alzheimer's Research & Therapy, 2015. 7(1): p. 13.
7. Kalovidouris,
S.A., et al., A role for fucose α (1− 2)
galactose carbohydrates in neuronal growth. Journal of the American
Chemical Society, 2005. 127(5): p.
1340-1341.
Figures