4966
Orbitofrontal-limbic structural development maturation in non-human primates: a longitudinal studyAkiko Uematsu1,2,3, Junichi Hata1,3,4, Yuji Komaki3, Fumiko Seki1,3,4, Chihoko Yamada3, Norio Okahara3, Yoko Kurotaki3, Erika Sasaki1,3,4, and Hideyuki Okano1,4
1Keio University School of Medicine, Tokyo, Japan, 2RIKEN BSI Laboratory for Marmoset Neural Architecture, Saitama, Japan, 3Central Institute for Experimental Animals, Kawasaki, Japan, 4RIKEN BSI, Saitama, Japan
Synopsis
We investigated typical orbitofront-limbic structural development of a non-human primate model, common marmoset, using longitudinal MRI data. Overall, robust volumetric growth was observed during infancy. This rapid brain volumetric growth was associated with the largest decrease in diffusivities of diffusion tensor imaging. That suggest that the volume increment result from an increase in the number and size of cells, dendrites, and spines in the regions. In addition, our result suggested familial factors contributed the development of the orbitofrontal-limbic brain regions. Overall, this study provides further data on the factors and timing important for typical brain development.
Introduction
Brain development involves spatiotemporally complex microstructural changes. To obtain optimal cognitive and behavioral functions, proper structural brain development is essential. Especially for abilities to construct and maintain smooth social relationships between individuals, the orbitofrontal-limbic regions of the brain are important. These brain regions include the orbitofrontal cortex, cingulate cortex, amygdala, and hippocampus, which induce and regulate emotion, do self-monitoring and self-control, associate memories, expect outcomes from actions, and enhance memories for emotionally-arousing events. A detailed understanding of the typical developmental patterns and connectivity of these orbitofrontal-limbic regions may help to clarify the anatomical mechanisms underlying their functions. In addition, it would be a normal reference for the disorders and diseases that impair the region-related functions described above. Thus, in this study, we assessed development of the orbitofrontal cortex, cingulate cortex, amygdala, and hippocampus in a non-human primate species, the common marmoset (Callithrix jacchus) by using longitudinal MRI data. We used common marmoset because 1) they reaches adult size and sexually gets matured at around 24 months ,and 2) like human beings, they are raised and grown by family.Method
The 23 animals were obtained from healthy five pairs. They had grown in family, including parents, either/both elder or younger siblings and littermates, at least for first 9 months after birth. We constantly collected their longitudinal T2-weighted and diffusion weighted images (two b0 volumes and 30 volumes with b=1000s/mm2) from 1 to 18 months, total 114 time points, using 7 Tesla Biospec 70/16 MRI scanner (Bruker Biospin GmbH; Ettlingen, Germany) Receiver coil; Bespoke 4ch phased array coil (Takashima Seisakusho Co., Ltd.,Tokyo Japan) with actively shielded gradients at a maximum strength of 700mT/m. To estimate the regional volumes, the T2-weighted images were nonlinearly registered to the reference T2-weighted image of marmoset brain, which has its relative hippocampus labelmap cropped from the published common marmoset brain parcellation map1. Then using the registration information, the regional labels were inverted to the relative native spaces and modified manually if necessary. To assess the changes over all cell integrity in the orbitofrontal-limbic structures, we acquired diffusion tensor imaging (DTI) metrics, calculated from diffusion weighted MRI. The obtained volumes and DTI metrics were then statistically analyzed using mixed effect regression analysis, which generally used in longitudinal data, to investigate the age-related changes of the regions.Results and Discussions
Volume growth followed a non-linear, biexponential curve for all brain regions, regardless of sex (Fig. 1). The highest volumetric growth rate occurred during infancy period (1 to 3 months of age) with a corresponding marked decrease in the apparent diffusivities in all the brain regions. It suggests that an increase in the number and size of cells, dendrites, and spines would have occurred, resulting in volume increase during this period. Such developmental neural growth in this period was also qualitatively observed in the image contrast changes (Fig. 2). The volumes were all steadily increased until adolescence (7 to 13 months of age). The diffusivity values of the DTI kept decreasing until approximately 9 months of age. Nevertheless, according to the previous study2, synaptogenesis and enlargement of neuropil reached the peak at 3 months old in common marmosets. Thus, the volmetric growth during this period may be driven by, at least in part, progression of axonal myelination rather than increase of the cell or synapse. Thereafter, the volume of the orbitofrontal and cingulate regions decreased considerably, while there was little change in hippocampus and amygdala. A possible cause of the reduction in grey matter volume involves tissue compression following maturation of adjacent white matter. Indeed, the heatmap derived from fiber density of tractography passing through the regions indicated the increase of fiber bundle density by age (Fig 3). No significant sex difference was found in the development of any measured regions. Rather familial factors seemed to put weight on the developmental patterns of all the measured regions (Fig 4). Marmosets are often multizygotic, sharing placenta circulation during pregnancy, and exposure of testosterone seems to occur soon after birth in males but not before birth3. In other words, maternal status including age, nutrient, and stress levels during pregnancy as well as postnatal rearing environment may be important drivers of brain growth.Conclusion
We investigated the typical developmental patterns of non-human primate brain regions important for social skills, including the amygdala, hippocampus, cingulate cortex, and orbitofrontal cortex. We found a non-linear structural development in orbitofrontal-limbic regions, with robust growth in early life and prolonged white matter changes until adolescence. Further, familial factors, rather than sex, were important contributors to structural development in the orbitofrontal-limbic regions.Acknowledgements
This research is partially supported by the program for Brain Mapping by Integrated Neurotechnologies for Disease Studies (Brain/MINDS) from Japan Agency for Medical Research and development, AMED and Grant-in-Aid for Japan Society for the Promotion of Science(JSPS) Research Fellow.References
- Hashikawa, T., Nakatomi, R., & Iriki, A. (2015). Current models of the marmoset brain. Neuroscience research, 93, 116-127.
- Oga, T., Aoi, H., Sasaki, T., Fujita, I., & Ichinohe, N. (2013). Postnatal development of layer III pyramidal cells in the primary visual, inferior temporal, and prefrontal cortices of the marmoset. Frontiers in neural circuits, 7.
- Abbott, D. H., Barnett, D. K., J., C. R., Yamamoto, M. E., & Schultz-Darken, N. J. (2003). Aspects of common marmoset basic biology and life history important for biomedical research. Comparative Medicine, 53(4), 339-350.
Figures
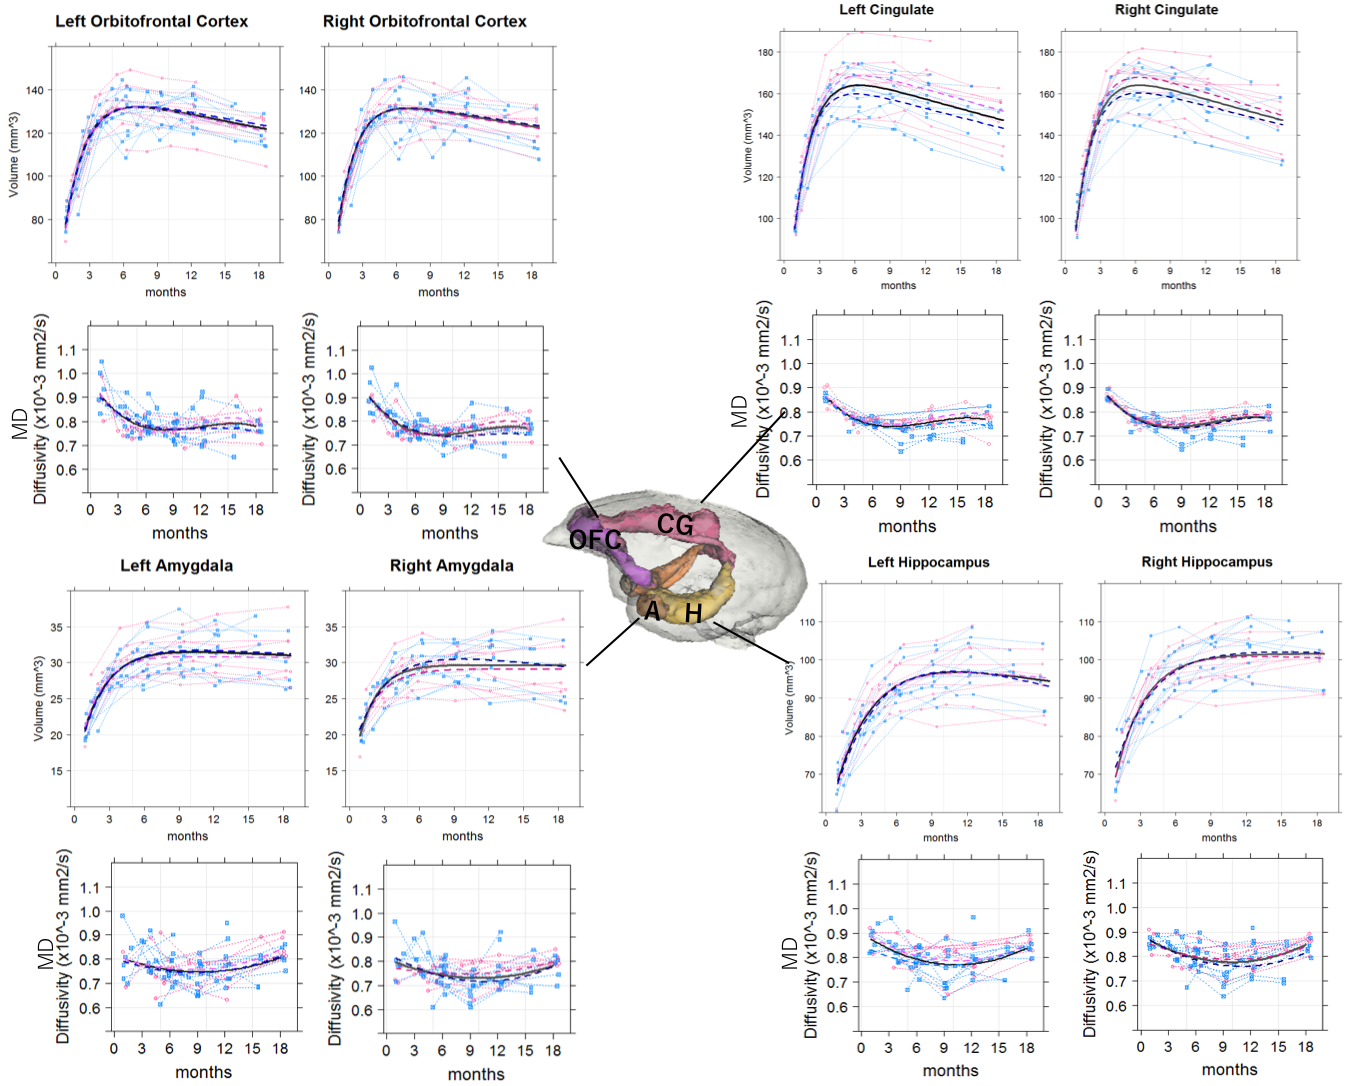
Fig 1. Spaghetti scatter plots and age-related regression
lines for volumes and mean diffusivity (MD) in orbitofrontal cortex, cingulate
gyrus, amygdala and hippocampus. The black lines are the regression lines for the
whole group, red dotted lines are regression lines for females, and the blue
dotted lines are regression lines for males.
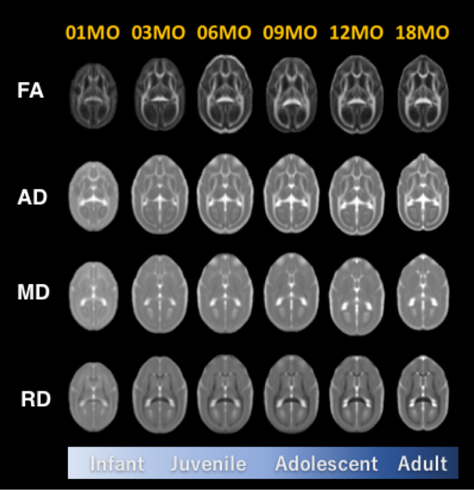
Fig 2. The age-specific averaged images of diffusion
tensor image metrics.
FA:
Fractional Anisotropy, AD: Axial Diffusivity, MD: Mean Diffusivity, RD: Radial
Diffusivity.
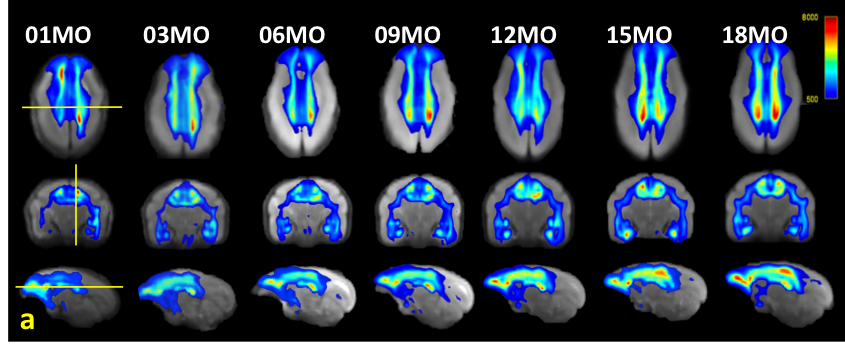
Fig 3. Track density
imaging (TDI) heat maps generated from the averaged fiber
orientation distribution (FOD) images.
The sections of the displayed images represent the crossing points of the
centerline of the thalamus (coronal view), the lines between the right and left
lateral sulcus (axial view), and the boundary between the left cingulate cortex
and the corpus callosum (sagittal view). The threshold of the color scale is
500 tracks.
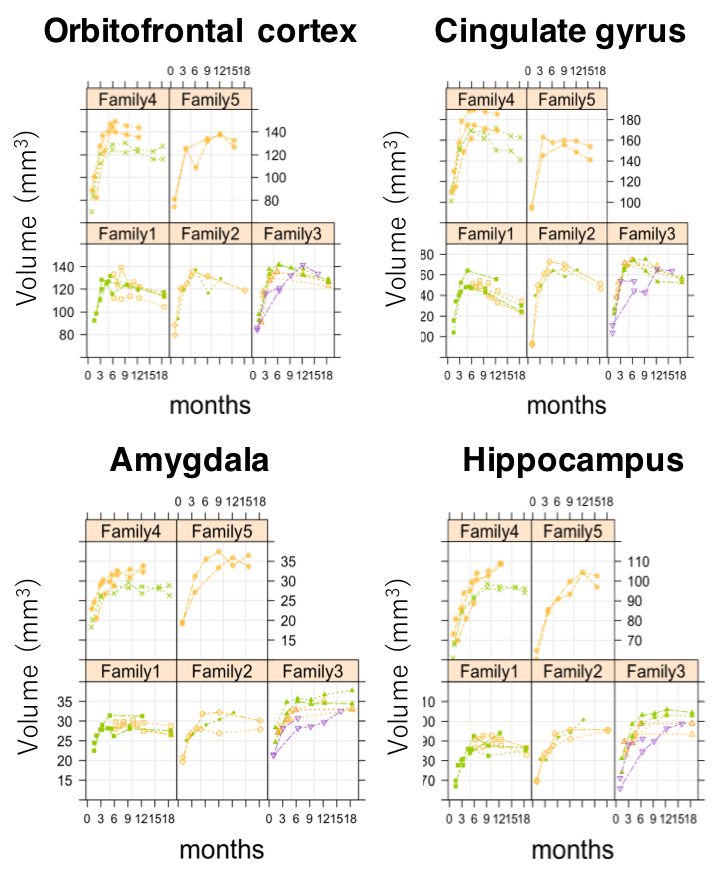
Fig 4. The spaghetti plots of volumes in left hemisphere,
divided by family group. The plots are colored by the same littermates.