4964
Longitudinal voxel-based morphometry in juvenile zebra finch brains reveals volume changes linked to distinct stages of the critical period for song learning1Bio-Imaging Lab, University of Antwerp, Wilrijk, Belgium, 2Department of Physiology and Ethology, Institute of Animal Biochemistry and Genetics, Slovak Academy of Sciences, Bratislava, Slovakia
Synopsis
We present an in vivo longitudinal MRI study that traces relative volume changes in the brain of juvenile male zebra finches from 20 to 200 days post hatching. In parallel, we also characterized song behavior to explore whether improvements in song performance can be linked to regional volume changes in the developing bird brain.
INTRODUCTION
Remarkable parallels have been observed between human speech and bird song learning, making songbirds –especially zebra finches– currently the best animal model to study aspects of vocal learning in a laboratory setting1. Zebra finches learn their song during a critical period, consisting of three partly overlapping sub-phases, within the first 4 months of post-hatch life. First, during the sensory phase (20-40 days post hatching (dph)), juvenile birds memorize the song of an adult male bird. Second, during the sensorimotor phase (40-90dph), male birds will try to match their own vocalization to the previously memorized tutor song. Last, during the crystallization phase (90-120dph), the song will crystallize and, in normal circumstances, never change again. Recently, structural MRI has been used in adult zebra finches2-3. MRI studies investigating structural development of the zebra finch brain during song learning, however, are still lacking. Therefore, the goal of this study was to perform whole-brain voxel-wise volumetric analyses on in vivo MR data to uncover localized volume changes in the brain during the different phases of vocal learning in male zebra finches.
METHODS
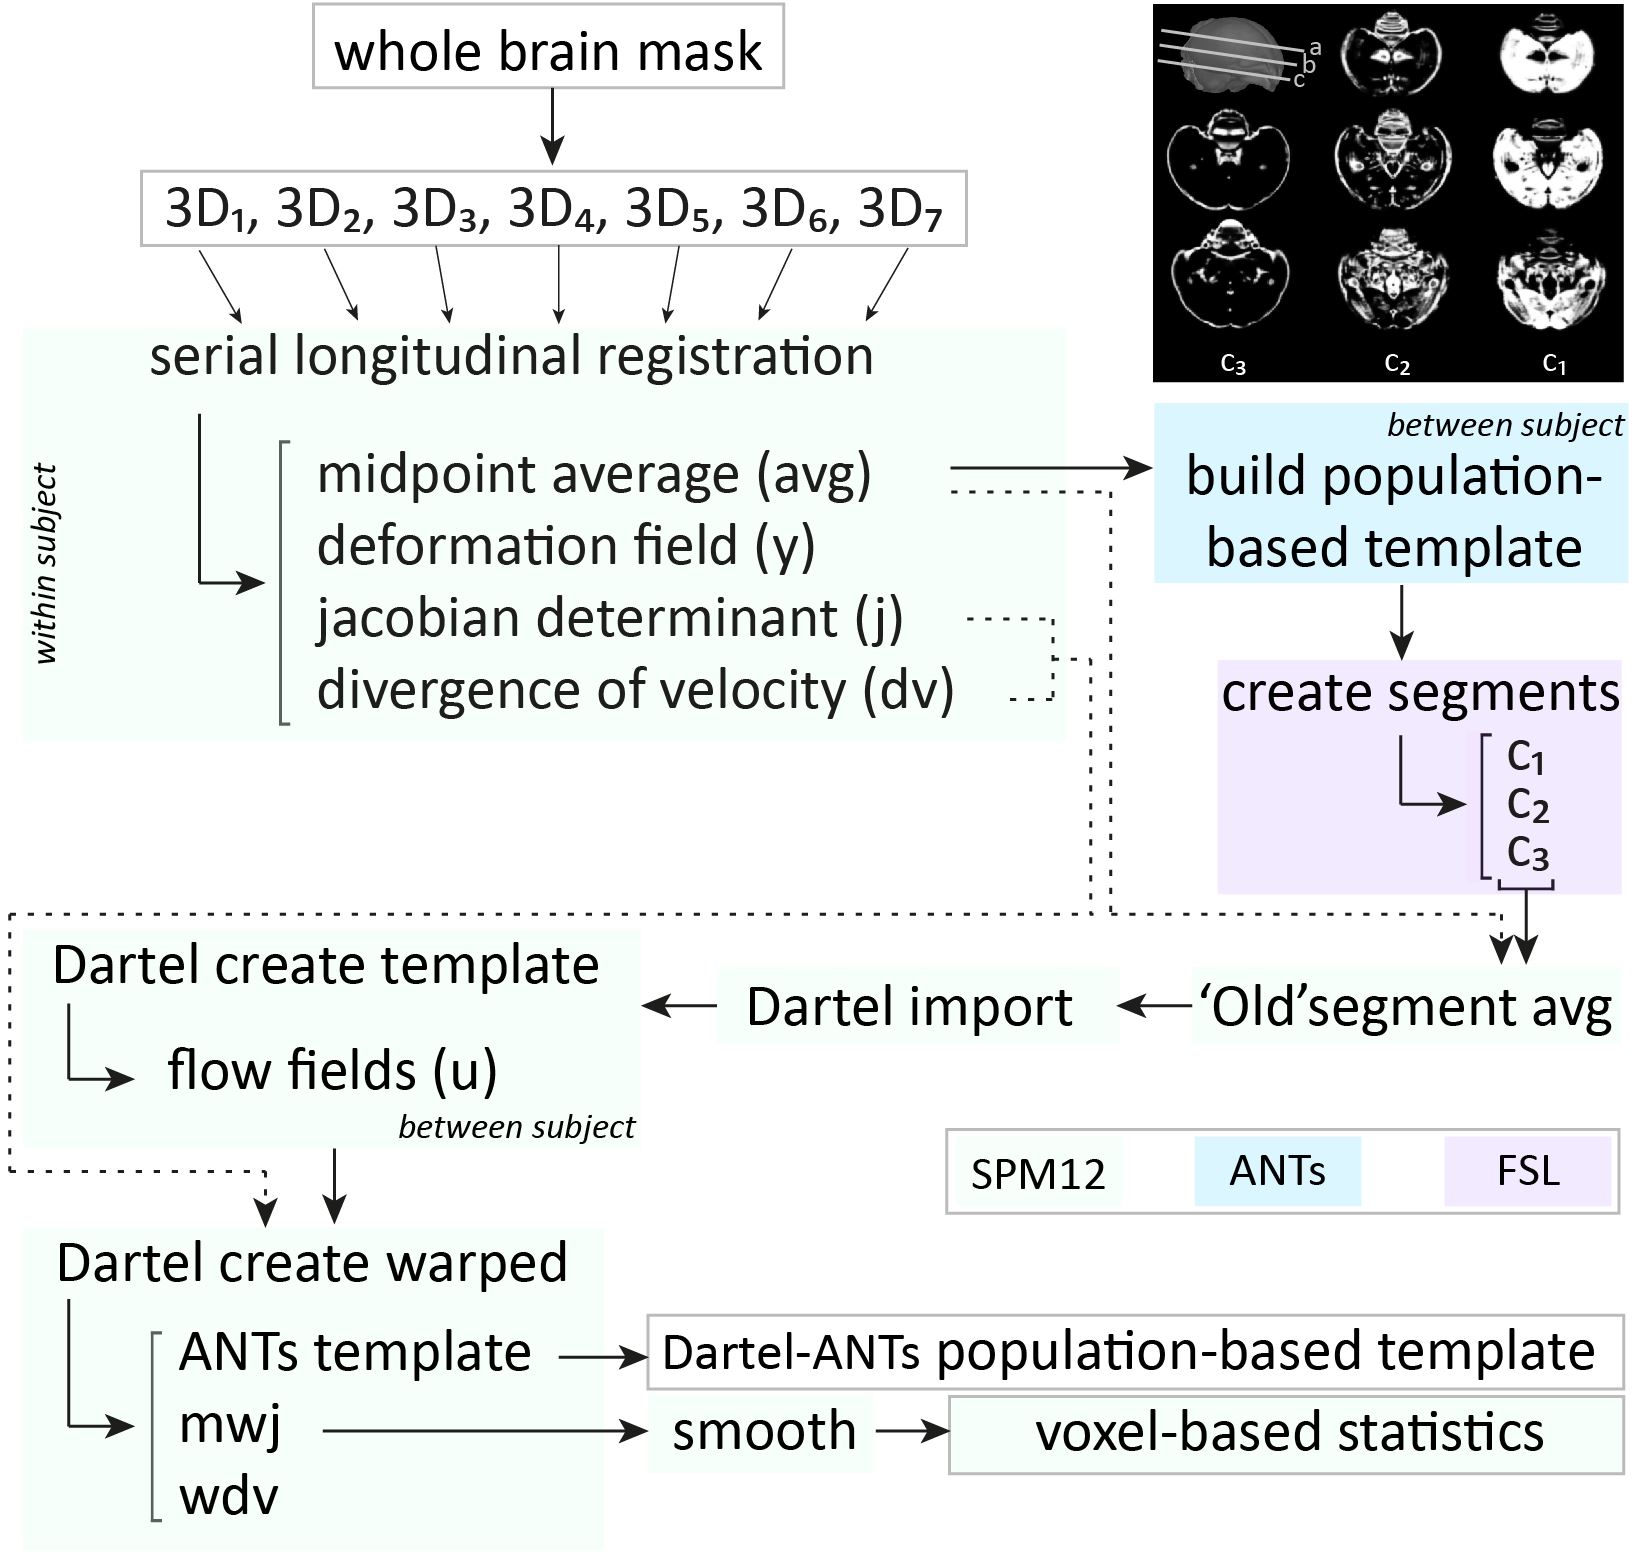
Acquisition– Male (n=16) zebra finches (Taeniopygia guttata), bred at the local animal facility, were scanned at seven time points during the critical period for vocal learning, i.e. 20, 30, 40, 65, 90, 120 and 200 dph. The birds were anaesthetized by isoflurane (induction: 2.5%; maintenance: 1.4-1.6%) and scanned on a horizontal 7T small animal MRI scanner. Each imaging session, we acquired a T2-weighted 3-dimensional (3D) RARE scan with the following parameters: TR/TE: 2500/55ms; RARE factor: 8; matrix zerofilled to (228x256x142) with voxel resolution (0.07x0.07x0.07)mm3. Processing– Figure 1 presents a schematic overview of the processing pipeline. All 3D RARE scans were first masked to exclude non-brain tissue. Next, one average 3D (‘midpoint average’) was created for each bird based on all scans acquired at the different ages using the serial longitudinal registration (SLR4) tool of SPM12. Then, the midpoint averages of all birds were used to create a population-based template in ANTs5. The resulting population-based template was parcellated in three tissue segments using the FAST tool of FSL6. The latter managed to discriminate three tissue classes (Figure 1, top right corner) that served as tissue priors to enable segmentation of the individual midpoint averages of each animal in SPM, so that the ‘regular’ processing pipeline for VBM implemented in SPM could be used. Next, the midpoint-average segments were imported to Dartel and used to create a Dartel-(ANTs-) population-based template. This template was used as anatomical reference. Subsequent, jacobian determinant maps outputted by the SLR were warped (with modulation) to the template space and smoothed in plane (FWHM (0.14x0.14)mm2). Last, the smoothed, modulated jacobian determinant maps were inputted in a repeated-measures ANOVA (fixed factors: age; random factor: subject) to assess main effects of age. Further, from 65 dph onwards, the first two days after each MRI session, the songs were recorded and analyzed using Sound Analysis Pro7.RESULTS & DISCUSSION
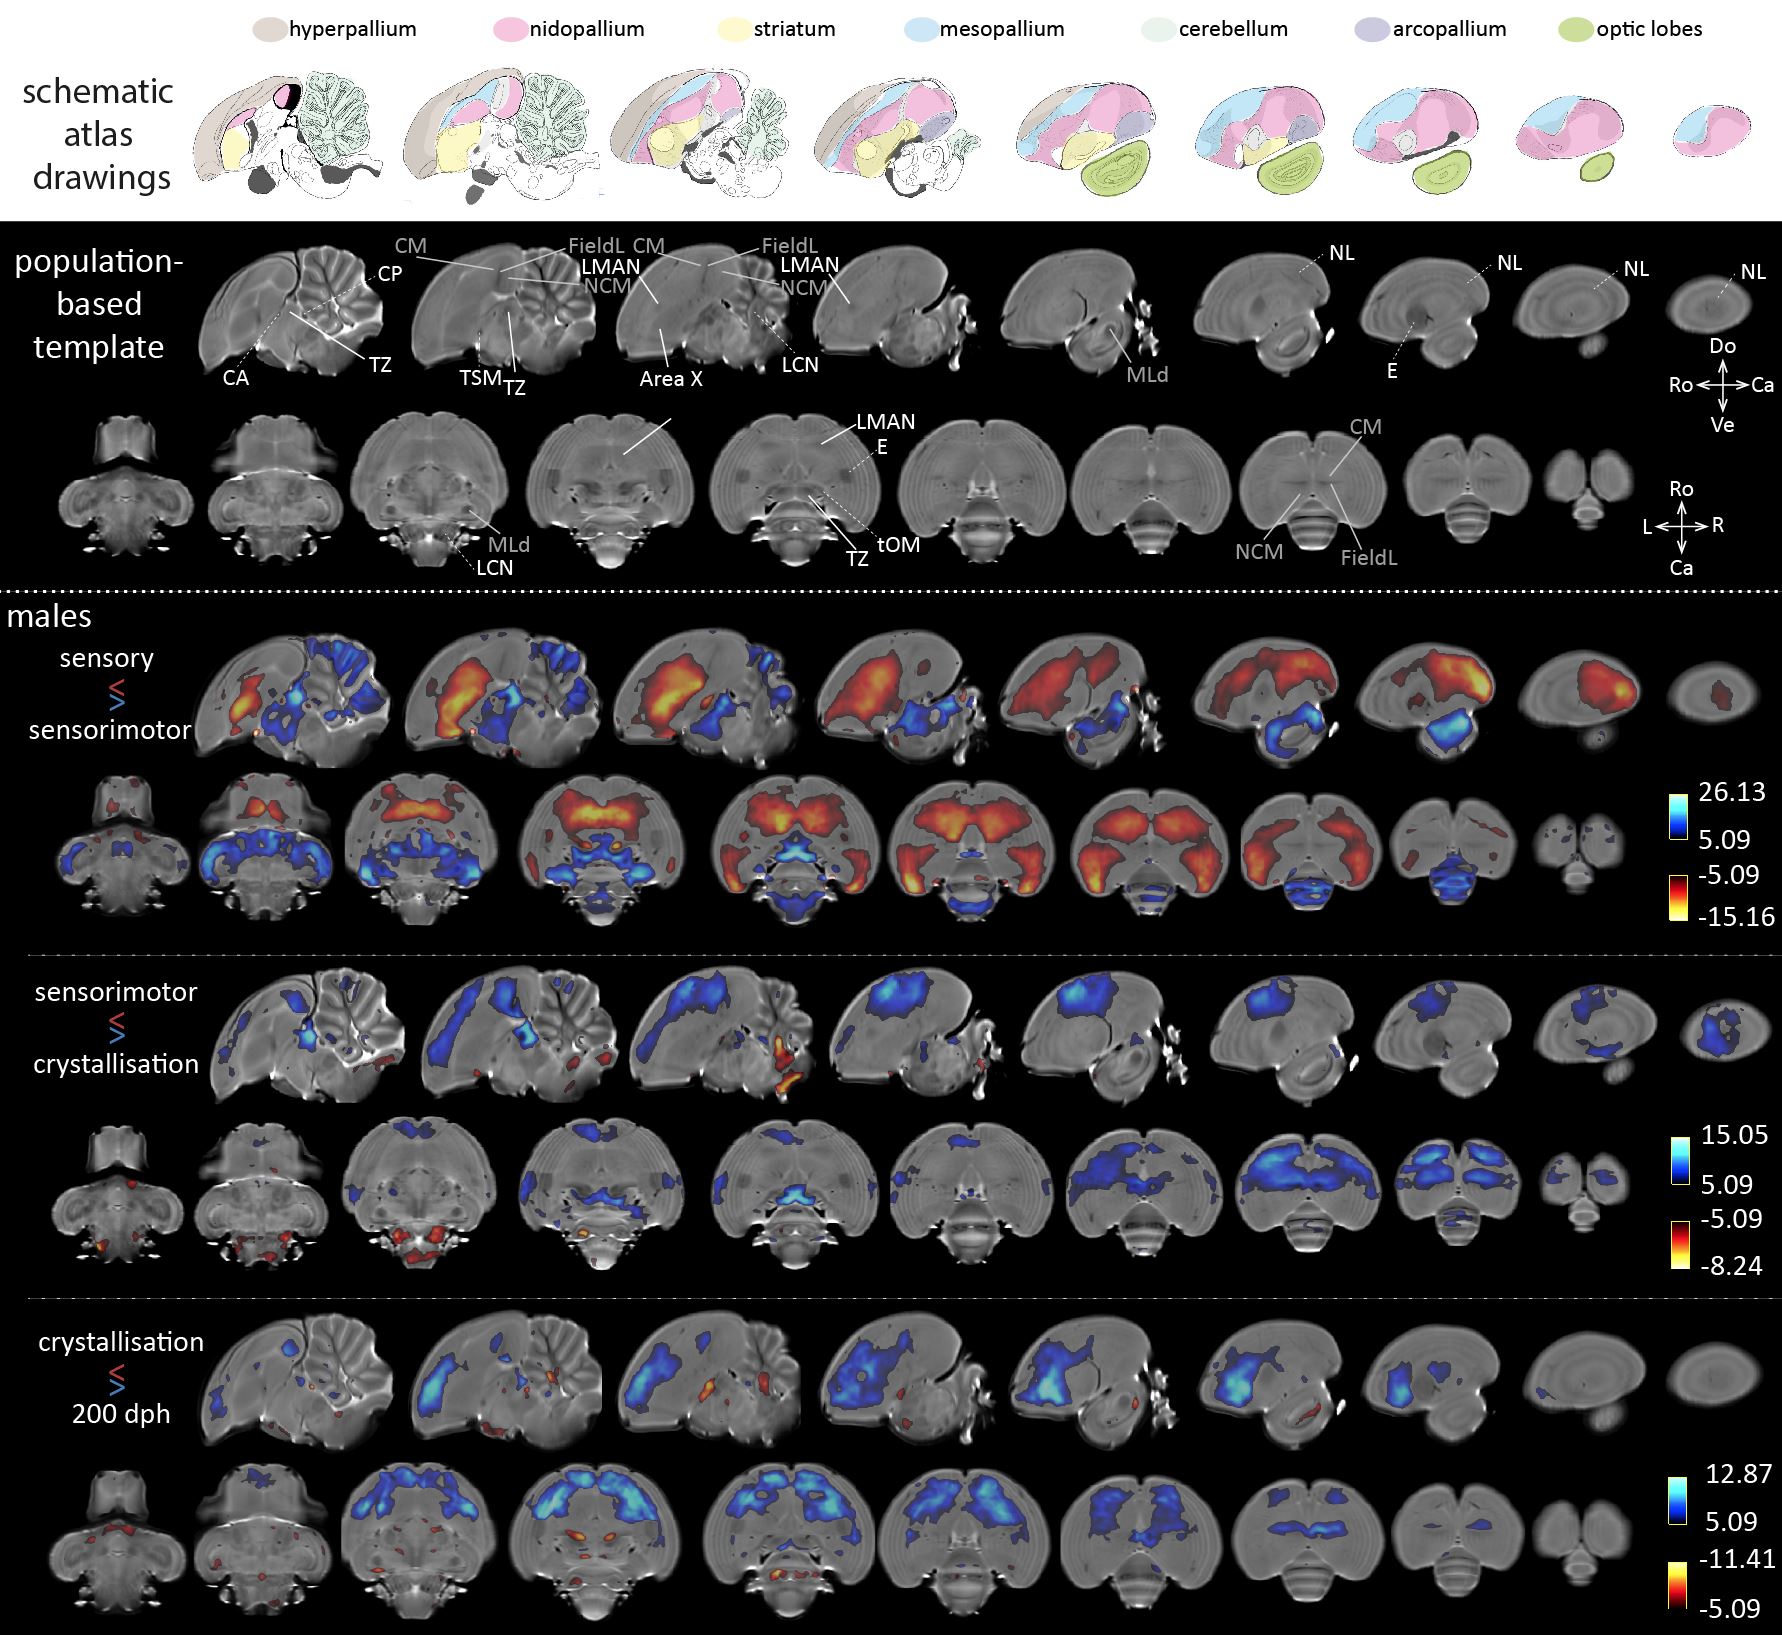
The main effect of age informs that almost the entire brain experiences local volume differences from 20 to 200 dph. Figure 2 displays statistical maps (thresholded at pFWE<0.05) informing on relative volume changes between consecutive phases of vocal learning in male zebra finches. When contrasting the sensory and sensorimotor phases, the striatum including Area X, mesopallium, nidopallium including LMAN and extending to the lateral nidopallium (NL) appear to increase in volume, while the thalamic zone (TZ), the mesencephalon (including auditory area MLd, analogue of the mammalian inferior colliculus), and large parts of the cerebellum decrease in volume. Area X and LMAN are two song control nuclei implicated in trial-and-error vocal practicing1. From sensorimotor to crystallization phase, the caudal mesopallium (CM) extending rostrally and laterally, hyperpallium and TZ decrease in volume, while the lateral cerebellar nuclei (LCN) increase in volume. After the crystallization phase, the CM, the rostral portion of the hyperpallium, the rostral parts of the nidopallium specifically excluding LMAN, decrease in volume, whereas several anatomically discrete areas appear to expand, i.e. the commissura anterior and posterior (CA, CP) and tractus septo-mesencephalicus (TSM). Song similarity to tutor song7 increases from 65 to 200 dph (p=0.0251 F(3,37.0)=3.4890; mixed model: fixed effect: age; random effect: subject).CONCLUSION
Most brain areas implicated in song learning appear to change between the sensory and sensorimotor phase. Afterwards, only more rostrally situated brain areas appear to decrease in volume. In a next step, we will explore whether correlations can be found between song performance and the observed volume changes during or beyond the critical period for vocal learning.Acknowledgements
This research was supported by grants from the Hercules Foundation (Grant Nr AUHA0012), Interuniversity Attraction Poles (‘PLASTOCINE’: P7/17) and the research foundation –Flanders (Grant Nr G044311N) to AVdL.References
1: Brainard & Doupe, 2013, Translating birdsong: songbirds as a model for basic and applied medical research. Annu Rev Neursci. doi: 10.1146/annurev-neuro-060909-152826.
2: Lukacova, Baciak, Pavukova, Pichova, Kasparova, Kubikova, 2017, Imaging of striatal injury in a songbird brain. Gen Physiol Biophys. doi: 10.4149/gpb_2016025.
3: Hamaide, De Groof, Van Steenkiste, Jeurissen, Van Audekerke, Naeyaert, Van Ruijssevelt, Cornil, Sijbers, Verhoye, Van der Linden, 2017, Exploring sex differences in the adult zebra finch brain: In vivo diffusion tensor imaging and ex vivo super-resolution track density imaging. NeuroImage. doi: 10.1016/j.neuroimage.2016.09.067.
4: Ashburner, 2007, A fast diffeomorphic image registration algorithm. NeuroImage. doi: 10.1016/j.neuroimage.2007.07.007.
5: Avants, Tustison, Song, Cook, Klein, Gee, 2011, A reproducible evaluation of ANTs similarity metric performance in brain image registration. NeuroImage. doi: 10.1016/j.neuroimage.2010.09.025.
6: Zhang, Brady, Smith, 2001, Segmentation of brain MR images through a hidden Markov random field model and the expectation-maximization algorithm. IEEE Trans Med Imaging. doi: 10.1109/42.906424.
7: Tchernichovski, Nottebohm, Ho, Pesaran, Mitra, 2000, A procedure for an automated measurement of song similarity. Anim Behav. //doi.org/10.1006/anbe.1999.1416
8: Karten, Brzozowska-Prechtl, Lovell, Tang, Mello, Wang, Mitra, 2013, Digital atlas of the zebra finch (Taeniopygia guttata) brain: a high-resolution photo atlas. J Comp Neurol. doi: 10.1002/cne.23443.
Figures