4963
In utero monitoring of early embryonic mouse brain development and injury progression with localized diffusion MRI1Radiology, Johns Hopkins University school of Medicine, Baltimore, MD, United States, 2Gynecology and Obstetrics, Johns Hopkins University school of Medicine, Baltimore, MD, United States
Synopsis
In utero diffusion MRI (dMRI) of the embryonic mouse brain is challenging due to maternal and fetal motions and limited resolution. We have previously developed a localized imaging technique and achieved fast dMRI of the live embryos. Here we explored the capacity of this technique to image embryonic mouse brains from mid-to-late gestation stages during development. Furthermore, we monitored the progression of embryonic brain injury in a mouse model of intrauterine inflammation. Our results suggested in utero dMRI is an indicator of fetal outcome after inflammatory injury, and the embryonic brain injury correlates with placental injury in this animal model.
Introduction
Diffusion MRI (dMRI) of the embryonic brain is important for monitoring early brain development and examining fetal neuropathology1, 2. dMRI of the live embryos, however, remains extremely challenging due to the maternal body and embryo motions, and therefore, has not been well-utilized. Our group previously developed a fast in utero dMRI technique using selective excitation and motion correction methods, with feasibility test on embryonic mouse brains at late gestation3. In this study, we tested the capacity of this technique in imaging embryos starting from mid-gestation, when the greater embryonic motion is expected, and followed the brain development, with and without intrauterine inflammatory injury. Histogram analysis of the dMRI data revealed acute brain injury as well as developmental changes in embryonic mice.Methods
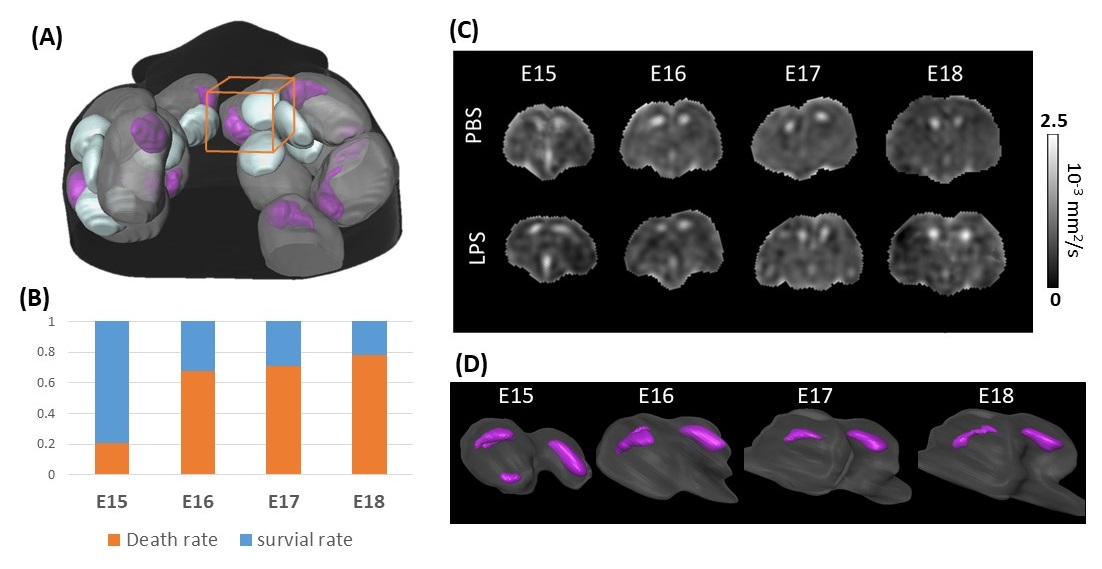
On embryonic day 15 (E15, full gestation is 19 days), 14 pregnant dams were subjected to inflammatory injury4, 5 with intrauterine injection of lipopolysaccharide (LPS), and 5 dams received intrauterine phosphate buffered solution (PBS; control). In utero MRI was performed on pregnant CD-1 mice on an 11.7T horizontal MRI scanners, at 6hrs, 24hrs, 48hrs, and 72hrs after injury (E15-E18). Localized dMRI of the embryonic mouse brains (one embryos per dam, Fig. 1A) was achieved using spatially selective excitation pulses3, 6, transmitted through a 72 mm quadrature volume coil. The pulses were integrated in a 3D DW-GRASE sequence7, 8, along with twin-navigator echoes9 for motion correction. dMRI of the embryonic mouse brains was acquired using an 8-channel mouse-body phased coil at TE/TR = 22/800 ms; two averages; two b0 images and 10 diffusion directions; b = 800 s/mm2; FOV = 12.8 × 9.6 × 8 mm3; and 0.2 mm isotropic resolution in 30 mins. Motions were monitored and corrected by the twin navigators, and images with un-correctable motion artifacts were rejected and re-acquired in a real-time fashion. T2 maps of the entire abdomen (5-8 embryos within FOV) were obtained with a multi-slice multi-echo sequence at 10 spin echoes with echo spacing of 4ms, FOV = 32 x 32 mm2, in-plane resolution of 0.25 × 0.25mm2, 30 slices with slice thickness of 1mm. Statistical tests were performed by one-way or two-way ANOVA followed by post-hoc pairwise t-tests.Results
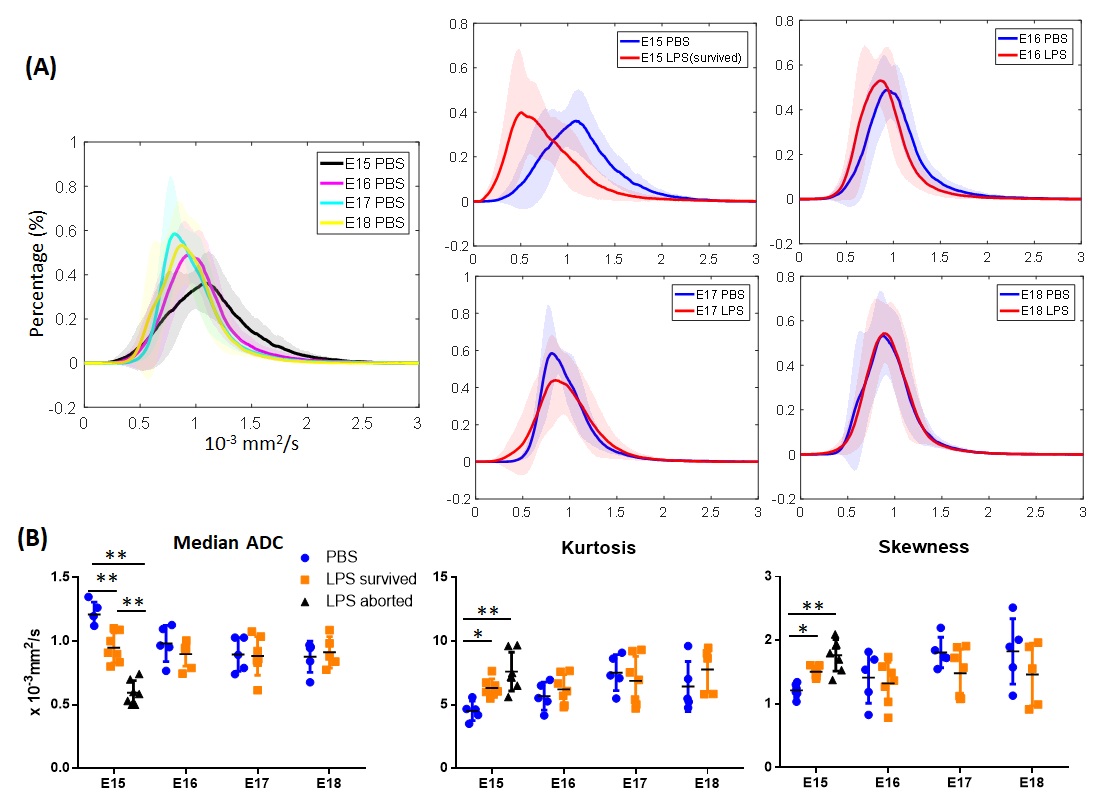
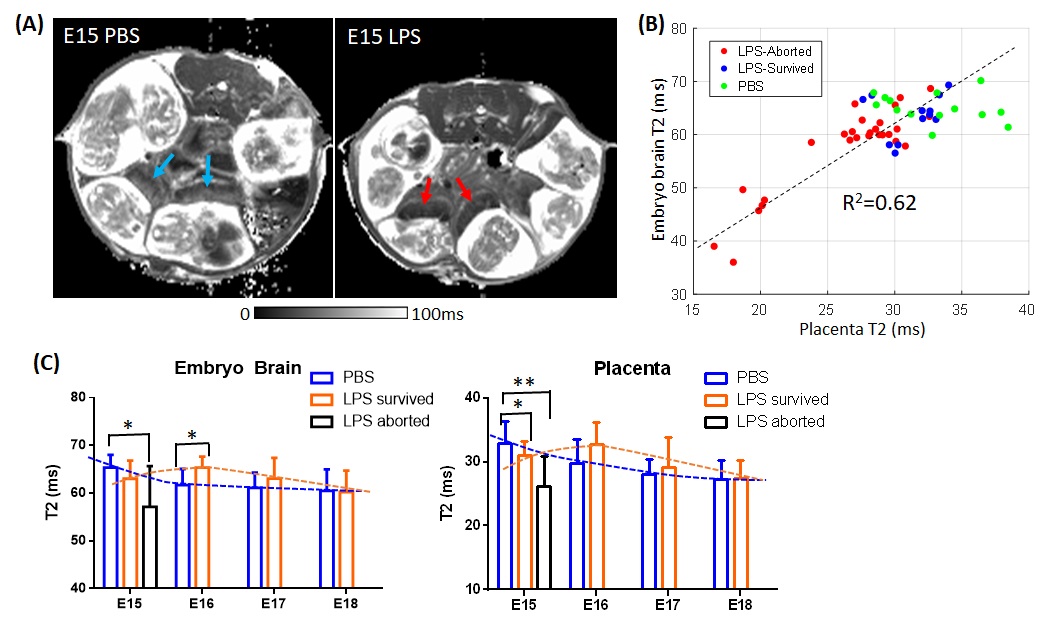
Approximately 20% pregnant dams aborted or died within 6hrs after injury before imaging, and another 50% dams aborted within 24hrs after injury. The survival statistics is summarized in Fig. 1B. Fig. 1C shows representative ADC maps of the embryonic mouse brains from E15 to E18, with or without injury. 3D rendering of the embryonic brains was illustrated in Fig. 1D, which showed that the ventricular space decreased with growth. Histogram analysis of the ADC maps was performed, which revealed a clear developmental change from E15 to E18 in the PBS dams (controls) (Fig. 2A). Differences between the PBS and LPS histograms were observed at E15 and E16, with reduced ADC after LPS, but the differences diminished at E17 and E18 (Fig. 2A). Quantitative analysis of the histograms demonstrated that, median ADC decreased with gestational age, while kurtosis and skewness of the histogram increased with gestation (p<0.01, two-way ANOVA) in the PBS group (Fig. 2B). In the LPS group, median ADC significantly reduced at 6hrs after injury on E15, while kurtosis and skewness significantly elevated, compared to PBS group. The LPS mice that aborted within 24hrs after injury showed even lower median ADC than those survived. Interestingly, no statistical differences were found at E16-E18 between the survived LPS and PBS mice. T2 maps of the E15 dams (Fig. 3A) showed lower T2 values in the LPS-exposed placentas and embryonic brains, compared to the PBS-exposed. A strong correlation was observed between the embryonic brains and the corresponding placentas (Fig. 3B-C). In the PBS group, T2 values of the embryonic brains and placentas both decreased with gestation, whereas in the LPS group, the developmental curves were altered (Fig. 3B-C).Discussion and Conclusion
In summary, in utero dMRI of mid-gestation embryonic mouse brain is feasible using the localized fast imaging and real-time processing techniques. Our results suggested that ADC of the embryonic mouse brain can be a useful indicator of fetal outcome after intrauterine inflammation, e.g., extremely low ADC (<0.7x10⁻³mm2/s) in the embryonic brain is an indicator of abortion after injury. Differences between the survived embryos and the controls becomes insignificant over time, indicating a potential recovery mechanism after the initial injury in the survived embryos. The tight connection between placenta and embryonic brain suggests that placental insufficiency could be one of the contributors to embryonic brain injury. Immunohistological examination is undergoing to confirm these findings.Acknowledgements
This work is made possible by NIH grants R21NS098018 and K08HD073315.References
1. Huppi PS. Cortical development in the fetus and the newborn: advanced MR techniques. Topics in magnetic resonance imaging : TMRI. 2011; 22: 33-8.
2. Glenn OA. Fetal central nervous system MR imaging. Neuroimaging clinics of North America. 2006; 16: 1-17, vii.
3. Wu D, Lei J, Rosenzweig JM, Burd I and Zhang J. In utero localized diffusion MRI of the embryonic mouse brain microstructure and injury. Journal of magnetic resonance imaging : JMRI. 2015; 42: 717-28.
4. Burd I, Bentz AI, Chai J, et al. Inflammation-induced preterm birth alters neuronal morphology in the mouse fetal brain. Journal of neuroscience research. 2010; 88: 1872-81.
5. Burd I, Balakrishnan B and Kannan S. Models of fetal brain injury, intrauterine inflammation, and preterm birth. American journal of reproductive immunology. 2012; 67: 287-94.
6. Pauly J, Nishimura D and Macovski A. A Linear Class of Large-Tip-Angle Selective Excitation Pulses. J Magn Reson. 1989; 82: 571-87.
7. Wu D, Xu J, McMahon MT, et al. In vivo high-resolution diffusion tensor imaging of the mouse brain. NeuroImage. 2013; 83: 18-26.
8. Aggarwal M, Mori S, Shimogori T, Blackshaw S and Zhang J. Three-dimensional diffusion tensor microimaging for anatomical characterization of the mouse brain. Magnetic resonance in medicine. 2010; 64: 249-61.
9. Mori S and van Zijl PCM. A motion correction scheme by twin-echo navigation for diffusion-weighted magnetic resonance imaging with multiple RF echo acquisition. Magnetic resonance in medicine. 1998; 40: 511-6.
Figures