4962
ASL-based fMRI phenotyping of high-anxiety Fischer rat strain reveals two unexpected sub-traits or -states: caveat for rodent studies1Roche Pharma Research & Early Development, Neuroscience Discovery & Translational Area, Roche Innovation Center Basel, F. Hoffmann-La Roche Ltd, Basel, Switzerland
Synopsis
Fischer rats serve as a rodent model of high trait anxiety in neuroscience and drug discovery. Using ASL-based fMRI, we characterized Fischer rats with respect to their regional brain activity patterns and with reference to the standard Sprague-Dawley rat strain. Fischer rats clearly differed from Sprague-Dawley rats, but also split into two distinct subpopulations, with one showing a more deviant pattern than the other. Although it has remained elusive whether this is a trait or a state phenomenon, our data suggest that neuronal networks related to anxiety and/or depression are implicated.
Introduction
Fischer rats serve as a model of high trait anxiety,1,2 while Sprague-Dawley rats represent a standard strain supposed to be “normal” with no particular behavioral condition. Such strain differences are of high interest in neuroscience and drug discovery to explore neurocircuitry and obtain proof of concept for novel putative treatment options.3 In this context, functional MRI has become an invaluable tool. Here we used arterial-spin-labeling (ASL)-based MRI to assess regional brain perfusion as a surrogate for neural activity in Sprague-Dawley and Fischer rats. Capitalizing on our large in-house database comprising vehicle-control arms from >70 pharmaco-MRI studies carried out over a period of >5 years, we characterized both rat strains with respect to their neural activity profiles and circuitry engagement.Methods
fMRI data were obtained from 370 adult male Sprague-Dawley rats and 307 adult male Fischer F344 rats (Charles River Laboratories, France and Germany). Animals received vehicle treatment either orally or intraperitoneally 30–120min prior to imaging. For imaging, animals were kept under isoflurane anaesthesia. MRI was performed on a 4.7T/40cm Bruker Biospec horizontal-bore small-animal scanner with a bird-cage resonator for excitation and an actively decoupled quadrature surface receiver coil. Perfusion images were acquired in 8 coronal planes (FOV 4cm×4cm, slice thickness 1mm) using continuous ASL with single-slice centered RARE readout (TR/TE 3.75s/5.7ms, RARE-factor 32, matrix 128×64, labeling pulse 2.5s, post-labeling delay 0.4s). After affine and nonlinear spatial normalization to an in-house digital rat-brain atlas, perfusion maps of each individual were normalized slice-wise to the brain-mean value (=100%) in order to account for global strain differences, and to partly eliminate inter-individual variability. Finally, perfusion was determined within a set of anatomically pre-defined regions of interest (ROIs). Strain comparisons were performed using mass-univariate as well as multivariate pattern analysis approaches: ROI-wise t-tests, multivariate ANOVA (MANOVA), principal component analysis (PCA), hierarchical cluster analysis (HCA).Results
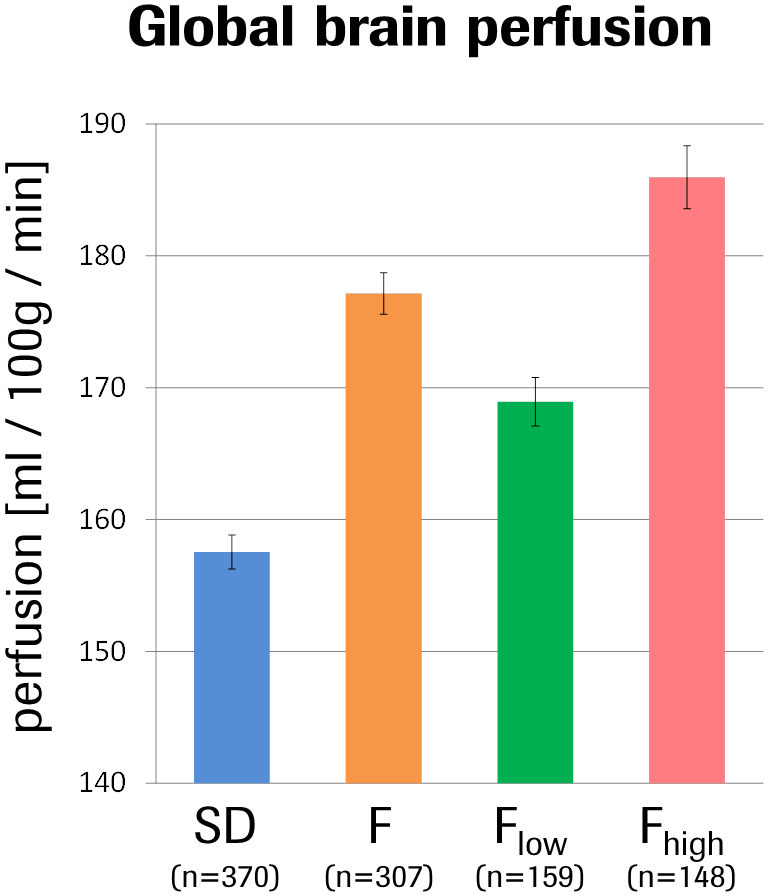
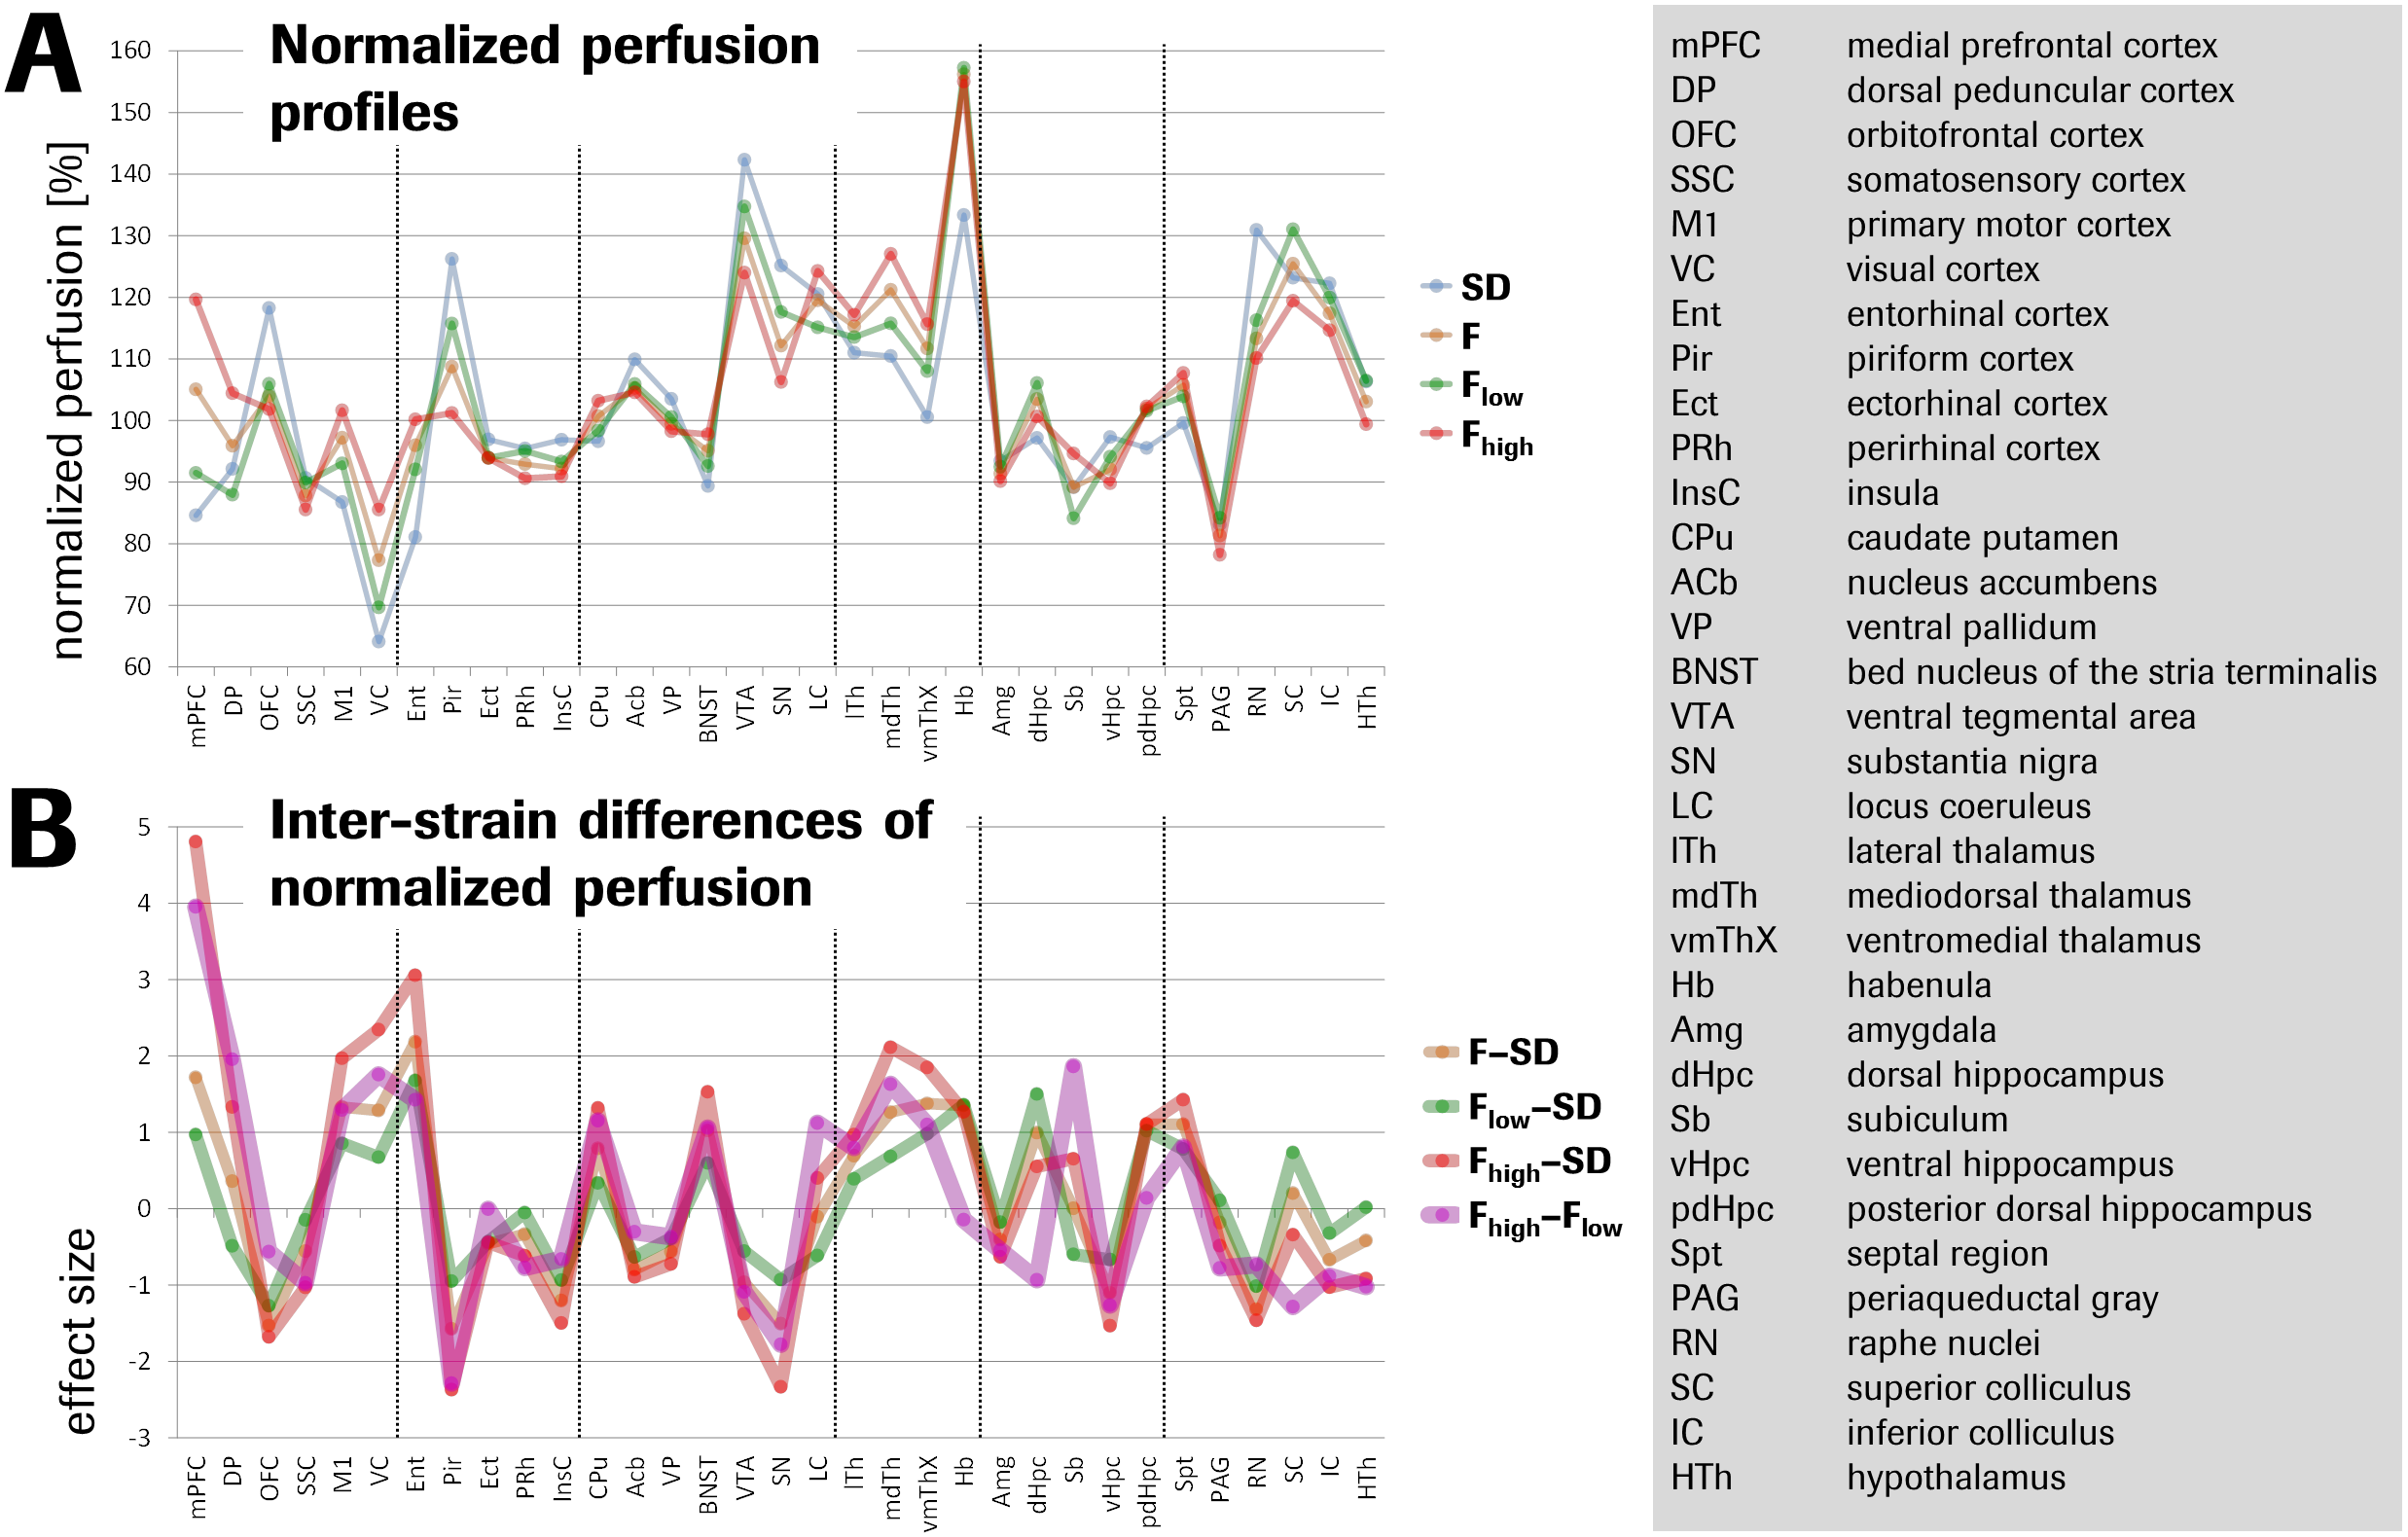
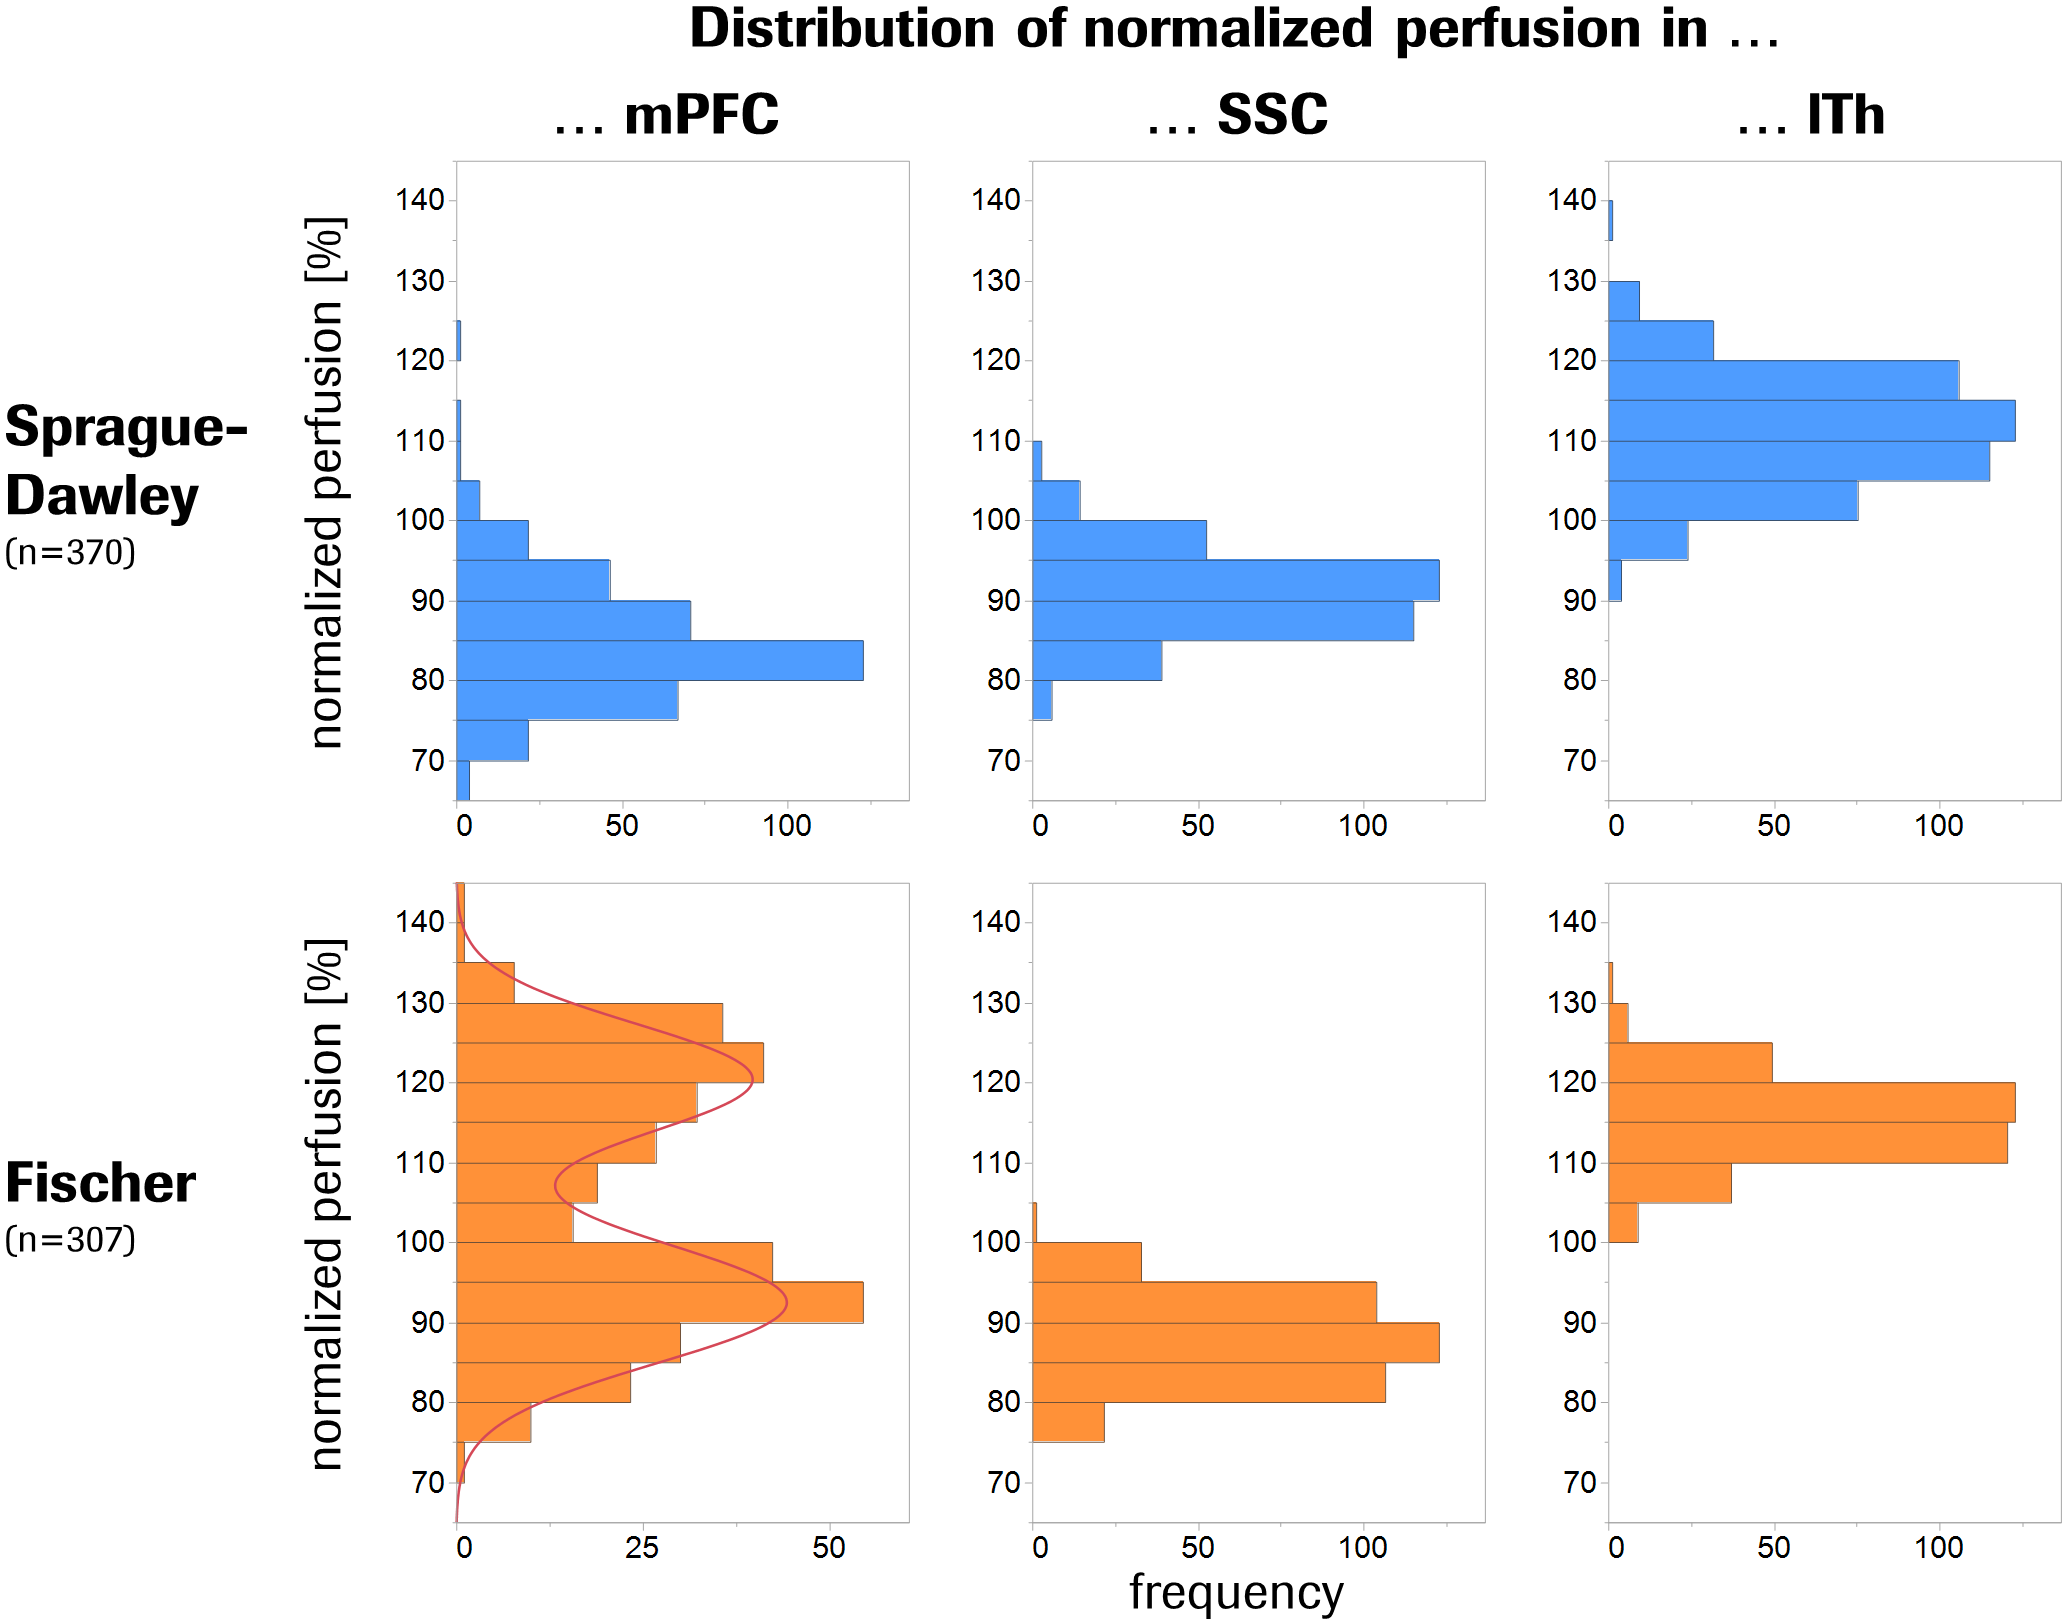
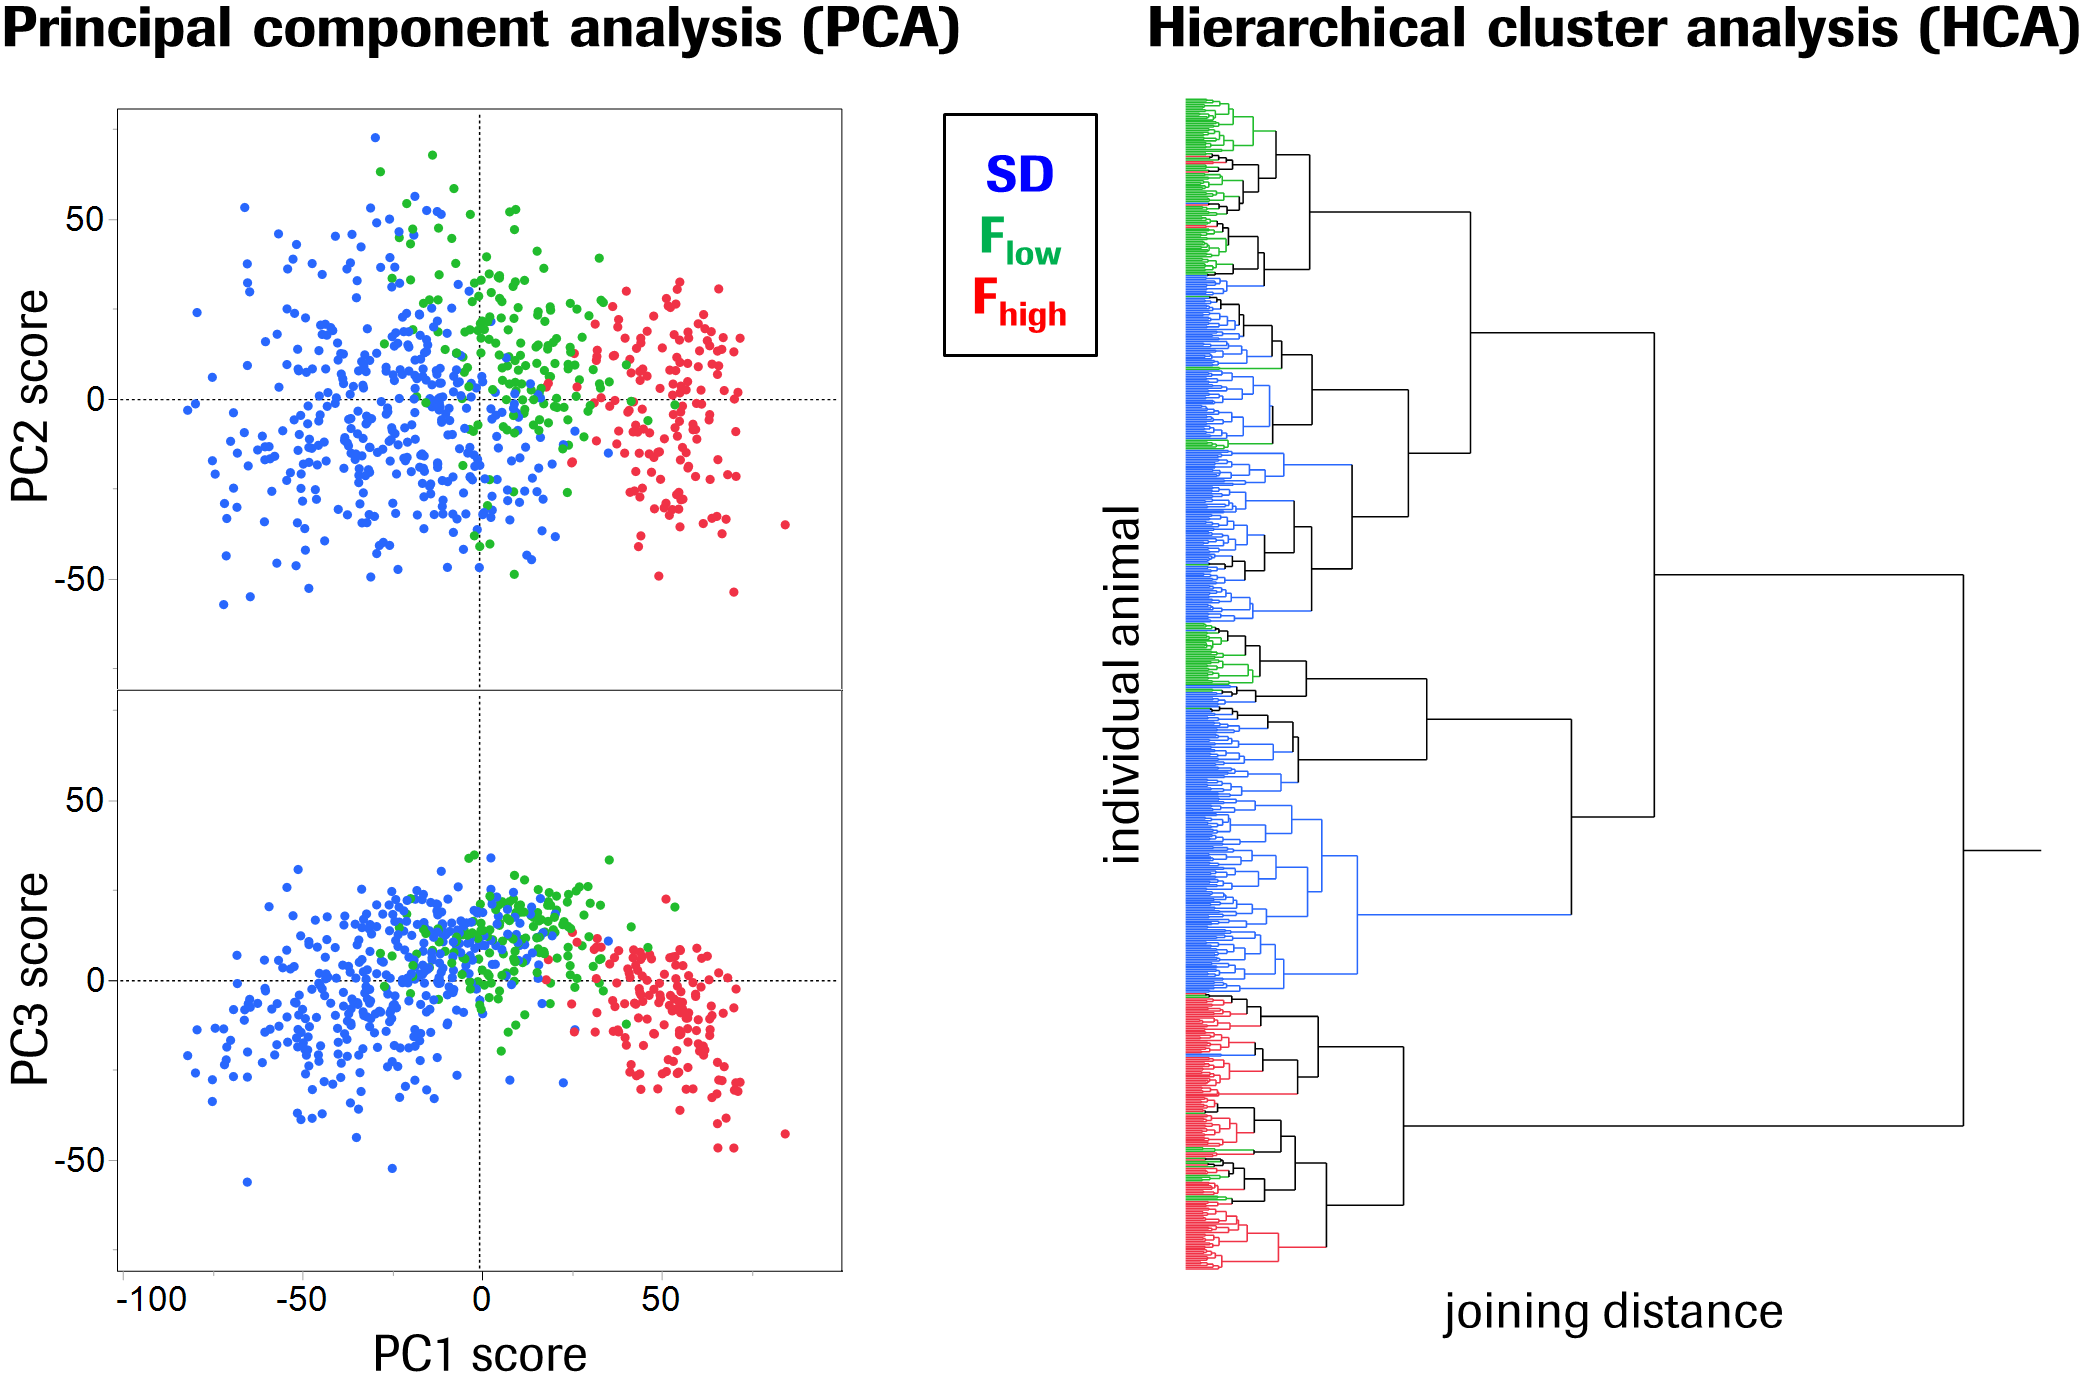
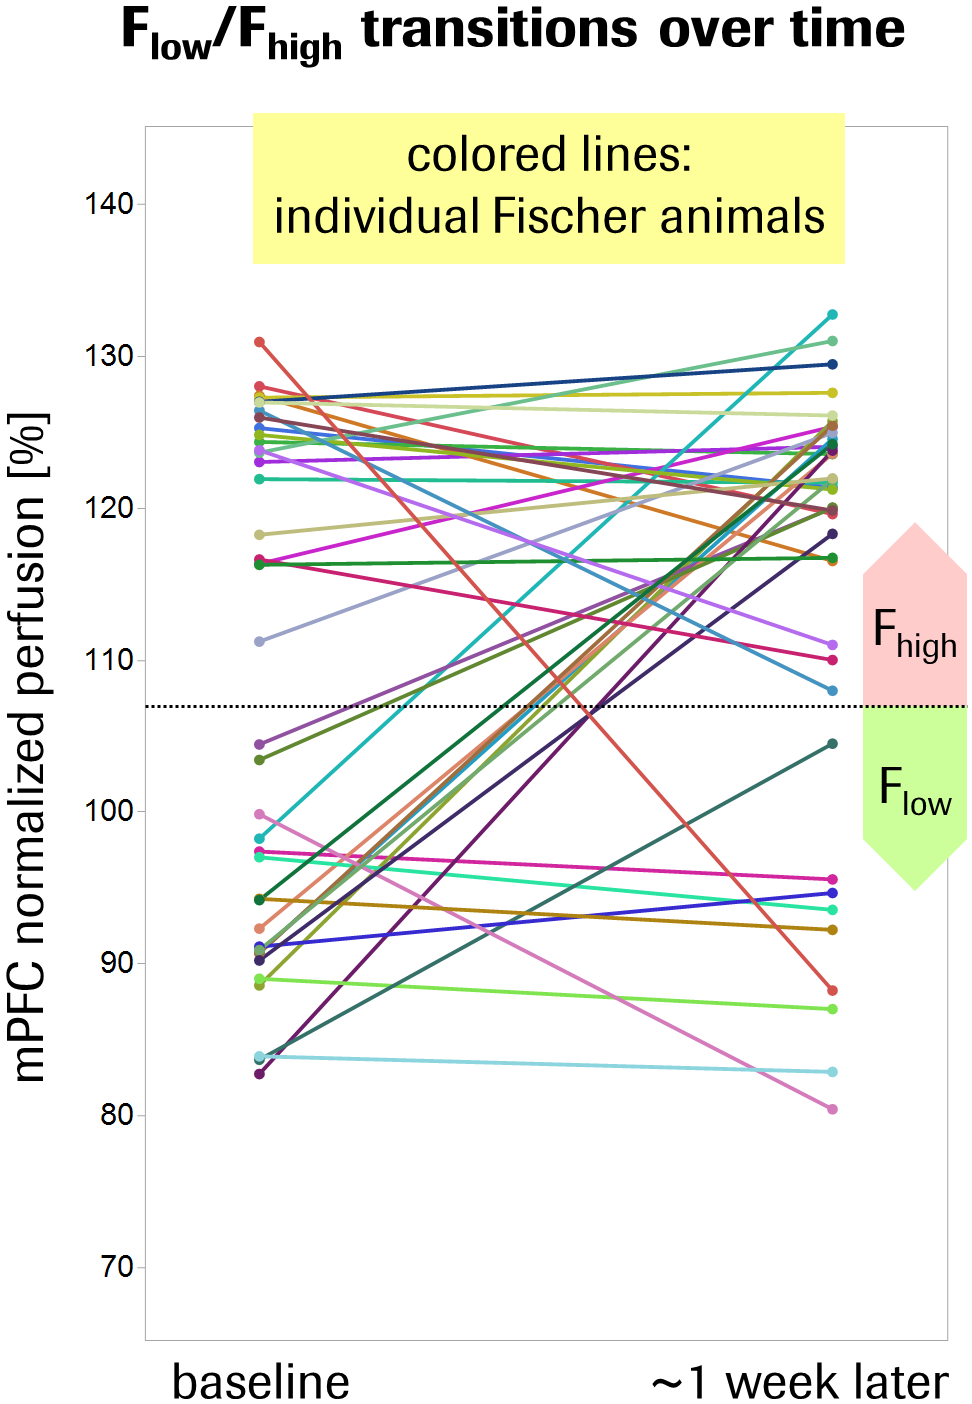
Fischer rats exhibited a 12% elevated global brain perfusion as compared to Sprague-Dawley rats (Fig.1). For regional perfusion normalized to the brain mean (Fig.2A), strain differences were highly significant in >90% of the ROIs and notably showed an effect size >1 in ~50% of the ROIs (Fig.2B), suggesting biological relevance. Unexpectedly, a clearly bimodal distribution of perfusion values was observed uniquely in the mPFC of Fischer animals (Fig.3), indicating the existence of two distinct subpopulations of nearly equal size. We therefore subdivided the Fischer animals into two subgroups (termed “Flow” and “Fhigh” in the following), based on their mPFC perfusion lying below or above the trough minimum of the distribution (around 107%). The Fhigh rats exhibited more elevated global perfusion (+18%) than the Flow rats (+7%) (Fig.1), and in general, their spatial perfusion pattern showed more extreme deviations from the Sprague-Dawley pattern (Fig.2B), as quantified by root-mean-square effect sizes across ROIs, MANOVA (Fig.2 caption), or PCA (Fig.4). The Fhigh pattern also pointed in a slightly different direction in ROI feature space than the Flow pattern (Figs. 2B, 4). PCA and HCA (Fig.4) as unsupervised/unbiased techniques both corroborated the finding especially of Fhigh rats forming a distinct subpopulation. Both Flow and Fhigh individuals were present throughout the Fischer-rat batches employed over the years. Data obtained from 39 Fischer rats which were re-assessed about 1 week later suggest for Flow animals a tendency towards transition to high mPFC perfusion during that time (Fig.5).Discussion
The ROIs driving the phenotypic differentiation of Fischer and Sprague-Dawley rats overlap with circuits often implicated in anxiety (septum, (para-) hippocampal regions, raphe nuclei; mPFC and orbitofrontal cortex as top-down control regions). Notably, amygdala or periaqueductal gray were not among the drivers, but instead parts of the sensorimotor network. This may be rationalized in so far as we assessed the animals’ basal predisposition rather than an acute condition. Our quantitative analysis implies that Fhigh rats constitute a truly discrete subpopulation that dominates the average Fischer phenotype. The data subset with follow-up assessments of the same individuals suggests that the subpopulations are based on a state rather than a trait phenomenon. Yet, this hypothesis needs to be confirmed with a larger dataset. We could not currently establish a link between the perfusion-based dissociation and biological or environmental factors. However, the Fhigh-vs-Flow pattern is to a considerable degree the inverse of Fischer animals’ response to pharmacological treatment with antidepressants,4 suggesting that the related network(s) may underlie the Fhigh phenotype.Conclusion
Our results provide a reference frame for fMRI in neuroscience and drug discovery using Fischer and Sprague-Dawley rats. In particular, we raise awareness of the existence of Fischer-rat subpopulations with distinct perfusion phenotypes that may also become manifest in other phenotypic features.Acknowledgements
We thank our technical staff Stephanie Schöppenthau and Sébastien Debilly for the extremely reliable animal handling and data acquisition, as well as Thomas Bielser for implementing the powerful in-house data management and image preprocessing software.References
Sudakov SK, Medvedeva OF, Rusakova IV, Terebilina NN, Goldberg SR (2001): Differences in genetic predisposition to high anxiety in two inbred rat strains: role of substance P, diazepam binding inhibitor fragment and neuropeptide Y. Psychopharmacology 154, 327-335.
Bert B, Fink H, Huston JP, Voits M (2002): Fischer 344 and Wistar rats differ in anxiety and habituation but not in water maze performance. Neurobiol Learn Mem 78, 11-22.
Prinssen EP, Nicolas LB, Klein S, Grundschober C, Lopez-Lopez C, Kessler MS, Bruns A, Von Kienlin M, Wettstein JG, Moreau JL, Risterucci C (2012): Imaging trait anxiety in high anxiety F344 rats: Focus on the dorsomedial prefrontal cortex. Eur Neuropsychopharmacol 22, 441-451.
Bruns A, Mueggler T, Künnecke B, Risterucci C, Prinssen EP, Wettstein JG, Von Kienlin M (2015): “Domain gauges”: A reference system for multivariate profiling of brain fMRI activation patterns induced by psychoactive drugs in rats. Neuroimage 112, 70-85.
Figures