4961
Hippocampal-Cerebellar metabolic investigation in TBI rats: NMR spectroscopy study1NMR Research Centre, Institute of Nuclear Medicine & Allied Sciences(INMAS), DELHI, India
Synopsis
Cerebellar atrophy and dysfunction has been reported in clinical TBI. hippocampal-cerebellar cognitive collaborations and its manifestation in TBI is being reported. This study investigated TBI mediated metabolic irregularities in CB and HP in animal model of TBI. These results indicated that CB and HP are metabolically different regions. The models generated from the changes due to trauma could accurately discriminate CB and HP and injury severity. We speculate that reduced NAA and Cho levels may be due to substantial focal neuronal loss after weight drop TBI. Edema and excitotoxity following injury leads to altered levels of osmolytes and Glu/Gln.
Introduction
Cerebellar atrophy and dysfunction has been reported in clinical TBI even when cerebellum (CB) is not the primary site of injury1. Also, there is a growing evidence of hippocampal-cerebellar cognitive collaborations and its manifestation in TBI2. Cerebellum and hippocampus (HP) are metabolically different regions yet temporal metabolic profile of these regions may contribute in understanding their interaction and manifestation. In the present study, we are trying to investigate TBI mediated metabolic irregularities in CB and HP in animal model of TBI.Methods
15 Sprague–Dawley rats (8–10 weeks, 200–250 g), were used in 3 groups of control, 65cm and 85 cm. TBI was induced using Marmarou’s weight drop model3. Briefly, 450gm brass rod was dropped (from 65cm and 85 cm) freely over 1mm thick aluminium coin placed over rat head. Guidelines of the institutional ethics committee were followed. Control and injury rats were sacrificed at 24hrs post injury (PI). CB and HP tissue (80-100 mg) were isolated, freezed (-80°C overnight) and extracted using the acetonitrile extraction method. Spectra from each sample was acquired on a Bruker 600‐MHz NMR spectrometer (Bruker Biospin, Germany) using NOESYGPPR1D sequence with following parameters: acquisition time:8min42s, 64 scans, 32K data points, 9009.009Hz spectral width.Processing and statistical analysis
The FID (line broadening, 0.3 Hz) was Fourier transformed; phase and baseline corrected manually using Bruker TOPSPIN 3.1. The concentrations of the metabolites were determined(mmol/g). Each spectrum (δ0.02–4.30) was integrated into equi‐width bins (0.04 ppm) which were normalized (mean centered and pareto‐scaled) and principal component analysis (PCA) was performed. Partial least‐squares discriminant analysis (PLS‐DA) was performed for the identified metabolites(succinate, aspartate, creatine, lactate, acetate, taurine, myo-inositol, glutamate-GLU, glutamine-GLN, ɣ-amino butyric acid-GABA, N-acetylaspartate (NAA), choline, alanine and branched amino acids (BAA). Variable importance in projection (VIP) scores was used to identify metabolites with maximum contribution to separation of clusters in PLS-DA. Metabolic pathways were analyzed using the pathway topology search tool where pathway library for Rattus norvegicus (rat) and ‘Out degree centrality’ algorithm was chosen. The metabolic difference between CB and HP in controls was analysed using t-test. Inter‐group (control, 65cm and 85cm) and inter-region (CB and HP at 65 and 85cm) differences were analysed. p-value≤ 0.05 was considered to be significant. All statistical analysis was done on Metaboanalyst 3.0 and SPSS 16.0.Results
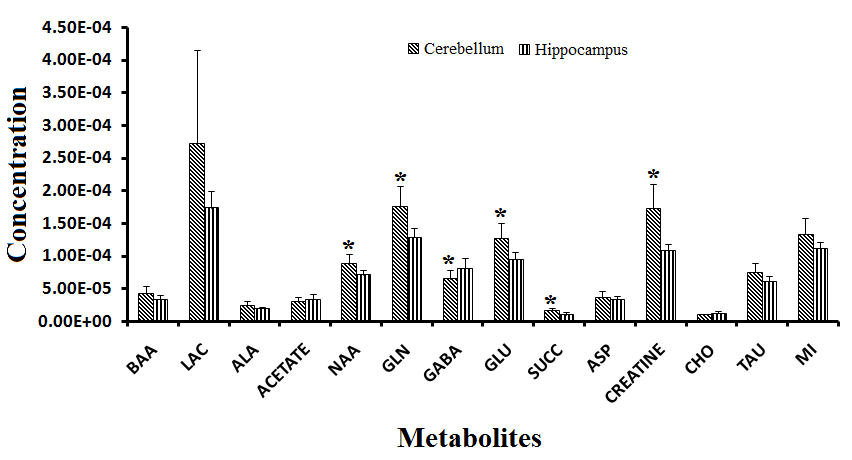
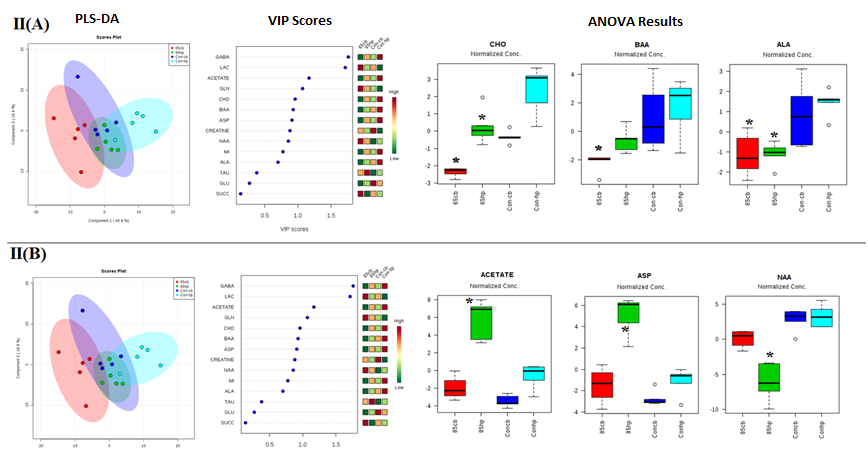
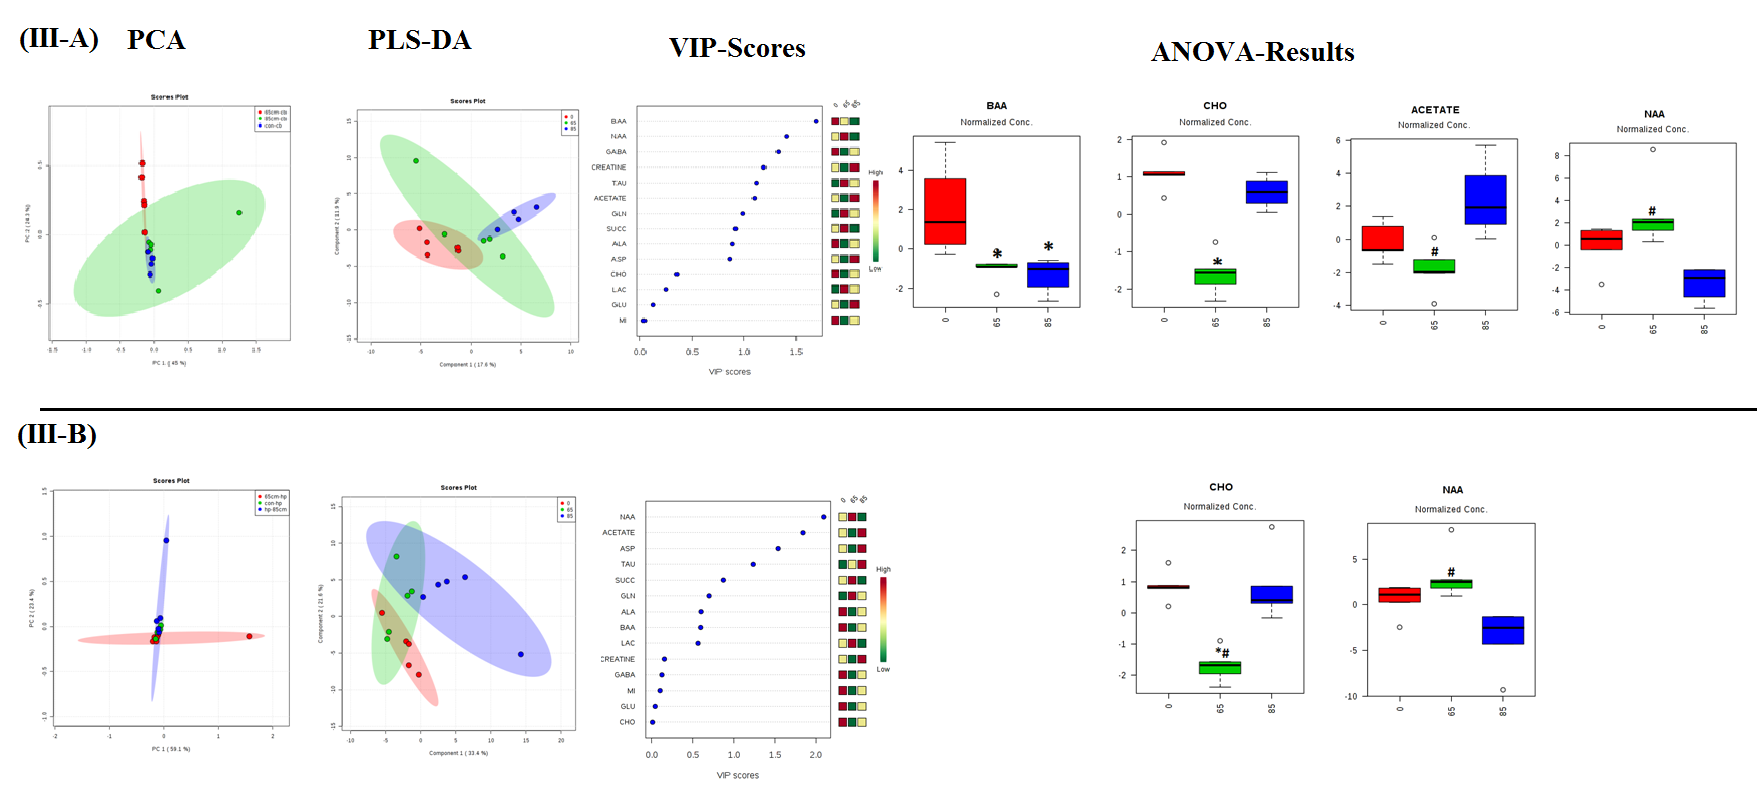
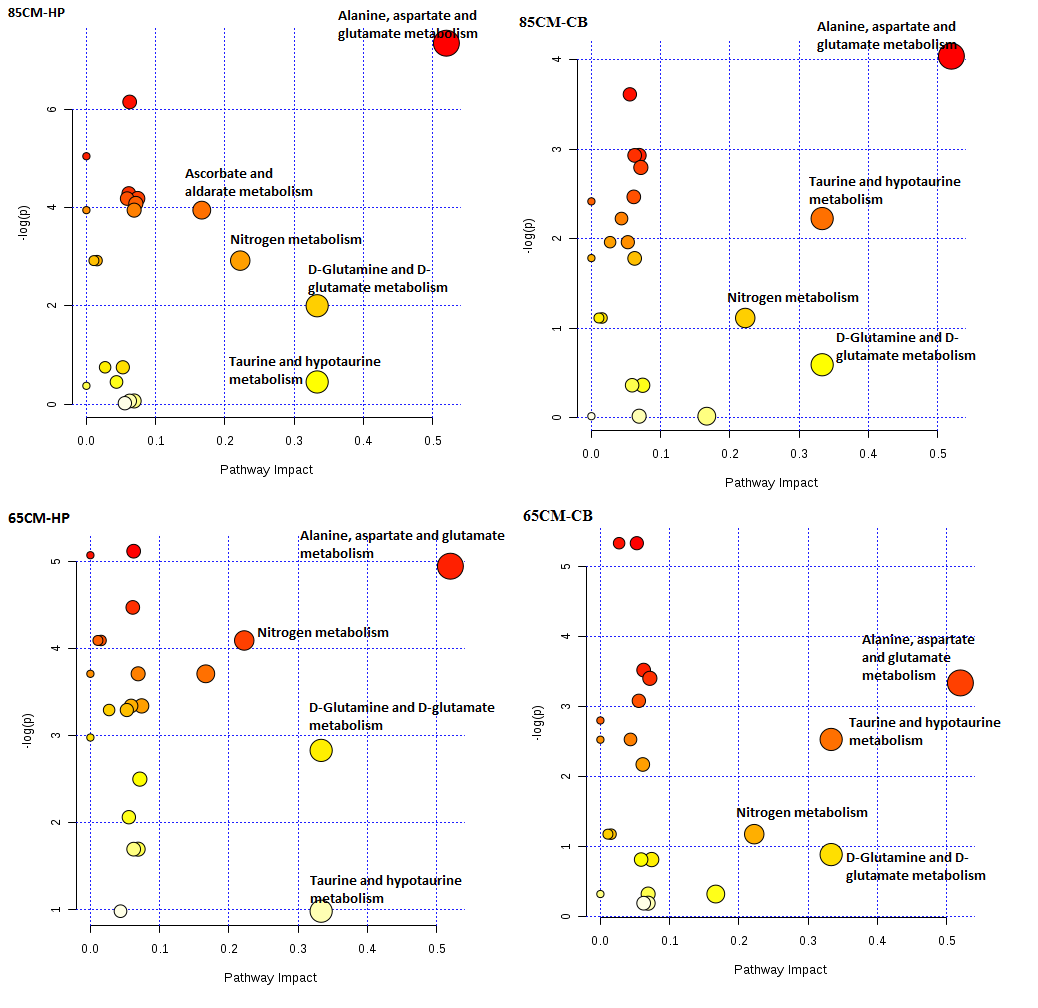
t-test showed significant increase in NAA, GLU,GLN, Creatine, succinate and decrease in GABA levels in CB as compared to HP in control rats (Fig-I). Within group differences: PCA and PLS-DA of 65cm group showed control-CB, control-HP, 65cm-CB and 65cm-HP as distinct groups. Likewise, control-CB, control-HP, 85cm-CB and 85cm-HP were clustered as distinct groups. Depending on the Q2 value (the total variation predicted by the model), a 1‐component model and 4-component model was identified as the best classifier at 65 and 85cm groups respectively with an accuracy of 0.5 (R2 = 0.64, Q2 = 0.50) for 65cm and 0.95 (R2 = 0.92, Q2 = 0.80) for 85cm.ANOVA showed Alanine, Choline and BAA was significantly reduced in 65cm as compared to control (Fig-IIA, IIB) and their VIP scores were above 1(except Alanine). Acetate and Aspartate were increased while NAA was reduced in 85cm-HP as compared to control (Fig.II-B). Within region differences: PCA of CB group showed control-CB, 65cm-CB and 85cm-CB as distinct groups while PCA of HP group showed control-HP, 65cm-HP and 85cm-HP as distinct groups. Depending on the Q2 value, a 4‐component model was identified as the best classifier with an accuracy of 0.86 (R2 = 0.930, Q2 = 0.4) for CB and 0.8 (R2 = 0.80, Q2 = 0.4) for HP (Fig. III A, B). ANOVA showed BAA, Choline, acetate, NAA were significantly altered in CB and Cho and NAA in HP where they contributed to separation of groups (VIP Scores>1.0). Pathway analysis: Disturbance of Alanine, aspartate and glutamate metabolism; nitrogen metabolism and taurine and hypotaurine metabolism and D-Glutamine and D-glutamate metabolism was observed in both CB and HP in injury groups as compared to control (Fig IV).Discussions
These results indicated that CB and HP are metabolically different regions which present variable outcome PI. Models generated from the changes due to trauma could accurately discriminate CB and HP and injury severity. We speculate that reduced NAA and Cho levels may be due to substantial focal neuronal loss after weight drop TBI. Edema and excitotoxity following injury leads to altered levels of osmolytes and Glu/Gln.Acknowledgements
No acknowledgement found.References
1. Spanos GK et al. Cerebellar atrophy after moderate-to-severe pediatric traumatic brain injury. AJNR Am J Neuroradiol. 2007 Mar;28(3):537-42.
2. Yu W et al. Cognitive Collaborations: Bidirectional Functional Connectivity Between the Cerebellum and the Hippocampus. Front Syst Neurosci. 2015 Dec 22;9:177. doi: 10.3389/fnsys.2015.00177
3. Singh et al. Altered metabolites of the rat hippocampus after mild and moderate traumatic brain injury – a combined in vivo and in vitro 1H–MRS study. NMR Biomed. 2017 Oct;30(10). doi: 10.1002/nbm.3764.
Figures