4959
Novel Processing of Magnetic Resonance Spectroscopy Enables Biomarker Discovery for PTSD and mTB1Draper, Cambridge, MA, United States, 2Department of Radiology, Brigham and Women's Hospital, Boston, MA, United States, 3US Army Institute of Environmental Medicine, Natick, MA, United States
Synopsis
The objective of this study was to determine the neurochemical biomarkers for mild traumatic brain injury (mTBI) and posttraumatic stress disorder (PTSD) among members of the military. A sample of 100 participants were assigned to each cohort (mTBI only, PTSD only, mTBI and PTSD, military control, and civilian control). Analysis of metabolite concentrations in the mTBI and PTSD cohorts showed significant metabolite difference across 3 voxels in the brain (posterior cingulate gyrus (PCG), anterior cingulate cortex (ACC), and posterior white matter (PWM)), indicating that magnetic resonance spectroscopy provides objective biomarkers for distinguishing these conditions.
PURPOSE
Post-Traumatic Stress Disorder (PTSD) and mild Traumatic Brain Injury (mTBI) affect returning soldiers from Operation Iraqi Freedom and Enduring Freedom (OIF / OEF) at an alarming rate. It is estimated that 11 - 28% of U.S. service members have sustained mTBI1 and 10-18% experience PTSD2. Both mTBI and PTSD are undetectable by traditional imaging methods and are traditionally diagnosed from the clinical presentation, but have significant comorbidities that make it difficult to distinguish between the two conditions. Our study focuses on magnetic resonance spectroscopy (MRS) measurements to distinguish among healthy controlsubjects and those with mTBI, PTSD, or both, with the goal of developing biomarkers from the MRS data. The assessment of metabolite concentrations in the brain is critical to understanding neurological disorders. MRS provides a non-invasive in vivo technique for measuring these metabolites.METHODS
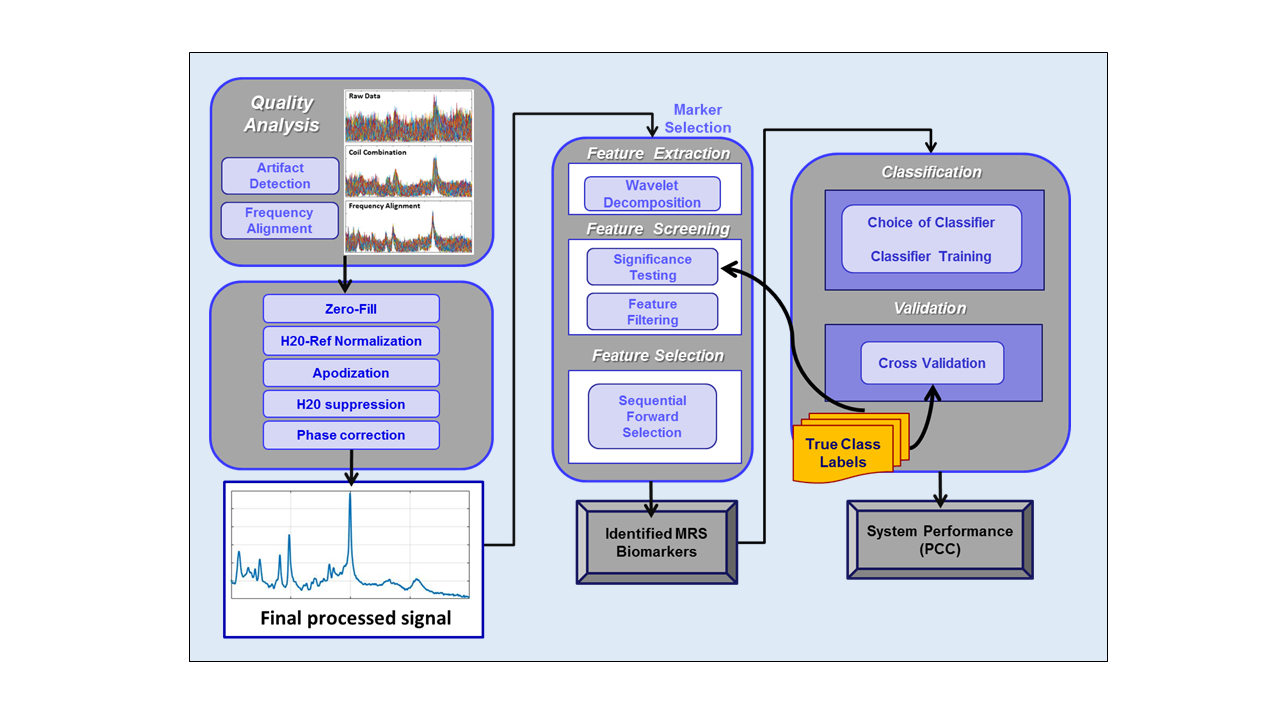
Participants and MRS data acquisition: 100 subjects were recruited and comprise five classes: military personnel with mTBI only, PTSD only, both mTBI and PTSD, or none (military control), and healthy civilian controls. This study was performed in a Siemens 3T MAGNETOM Skyra scanner with a 32-channel head coil. Single voxel MRS was acquired using conventional PRESS in three different brain regions: Posterior Cingulate Gyrus (PCG; 20x20x20mm), Posterior White Matter (PWM; 20x20x20mm), and Anterior Cingulate Gyrus (ACG; 20x20x20mm) using TE = 30 ms, TR = 2 s, bandwidth = 1.2 kHz, 1024 complex data points, water saturation, and 128 averaged acquisitions. Unsuppressed water spectrum with the same parameters but without water suppression and 16 averages was also collected. PRESS data was frequency corrected. Analytic Methods: The processing methods rely on a new approach for analyzing MRS signals that extracts a rich set of wavelet-based features to enable development of a statistical classifier. By capturing the structure of all significant peaks in the signal, the wavelet-based method allows for the discovery of previously unknown signatures that are not observed in traditional methods, such as LCModel3. The post-acquisition processing consists of a series of algorithms operating on the raw MRS signals to identify and correct signal quality issues, remove the residual water signal, perform phase correction and baseline removal, and compute the wavelet decomposition to represent the features embedded in the signal (Figure 1). Feature extraction was performed on the real-valued absorption spectra derived from the post-processed MRS spectra using wavelets4 to extract features that are local to specific intervals in the frequency domain. Features were then evaluated using a combination of statistical criteria to identify those statistically significant wavelet-based features that are also least likely to be attributable to random effects (noise). This approach, therefore, isolates just those features that are discriminating between the two groups, but also maximizes the probability that the features are due to distinct biochemical differences between the two groups. In each binary comparison, several wavelet-based features were identified that met the thresholding criteria that screen features.RESULTS
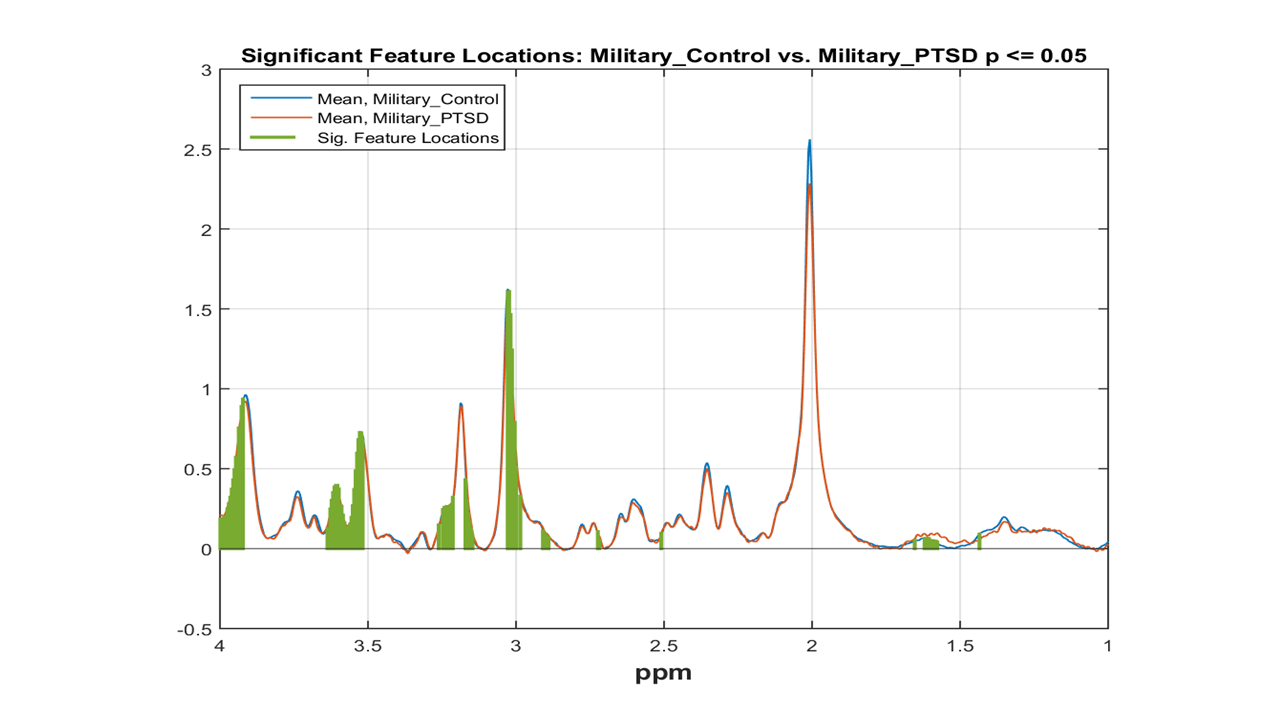
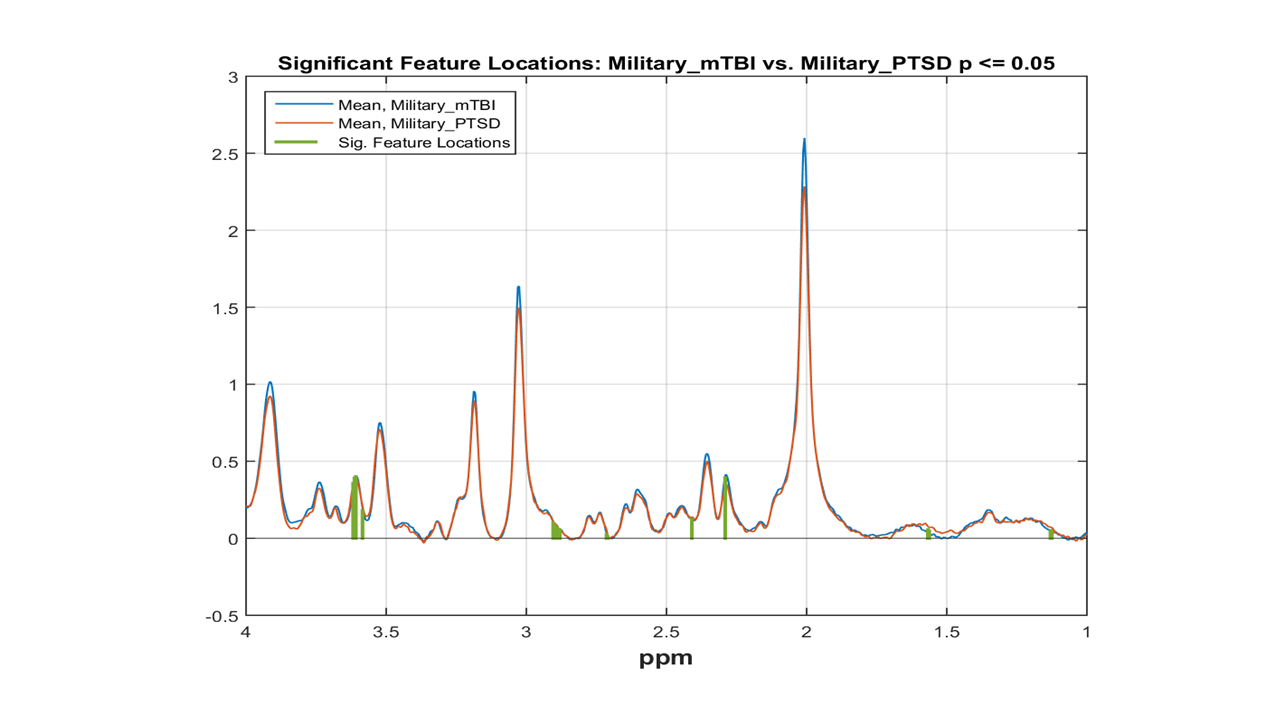
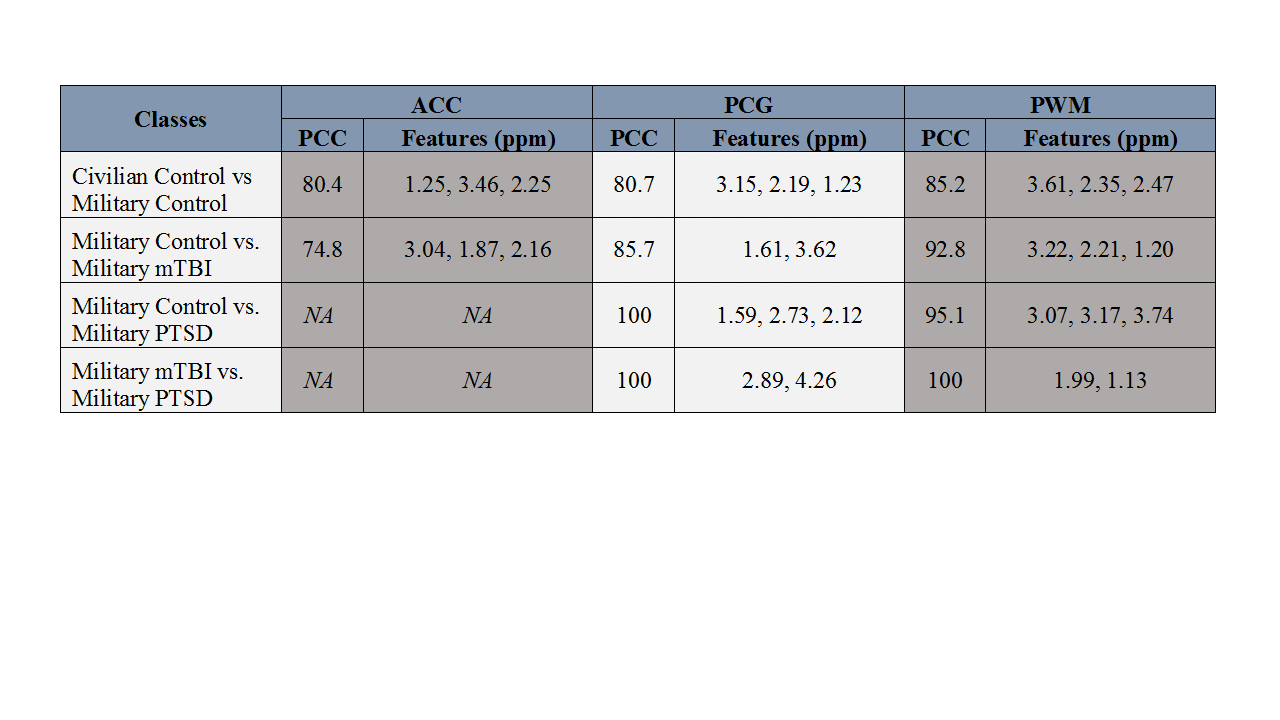
To demonstrate classification performance, we performed 100 iterations of 5-fold cross-validation of a Linear Discriminant Analysis classification method, using a Sequential Forward Selection (SFS) scheme to identify optimal subsets of features for discriminating between the classes. The following tables contain the average Percent Correct Classification (PCC) from all iterations of the cross-validated SFS search for, at most, the top 3 features it selected. The results show that classifiers relying on the MRS signal can achieve high accuracy when distinguishing among mTBI, PTSD, and military controls (Table 1). The specific metabolites depend on the objective of the classifier (Figures 2 and 3).DISCUSSION
The
classifier performance provides strong evidence that concentrations of specific
metabolites, as measured from MRS, are objective biomarkers for mTBI and PTSD as
well as differentiating between civilian and military controls. Significant
features differentiating PTSD from control focus on creatine and myoinositol,
whereas distinguishing features between PTSD and TBI focused more on the
glutamate and glutamine region. These
differences in the critical metabolites across the 3 voxels suggest that
further research is needed to understand the underlying mechanisms associated
with PTSD and mTBI. In addition, fused analysis of the data across the voxels
has the potential improve the classifier performance and the robustness of the
corresponding biomarkers. CONCLUSION
The classification results suggest that MRS can identify unique neuro-metabolite profiles for military service members with mTBI or PTSD diagnoses and distinguish these subjects from controls. The ability of MRS to distinguish small differences across many clinically useful metabolites allows us to develop a clearer and quantifiable measure of mTBI and PTSD.Acknowledgements
This study was funded by DOD CDMRP WX81-XWH-10-1-0835. The views expressed in this abstract are those of the authors and do not reflect the official policy of the Department of Army, Department of Defense, or the U.S. Government.References
1. Moore J.B. et al, The Wounded Warrior Handbook: A Resource Guide for Returning Veterans. Rowman & Littlefield Publishing Group, Inc (2012)
2. Litz B and Schlenger W, PTSD in Service Members and New Veterans of the Iraq and Afganistan Wars: A Bibliography and Critique. National Center for PTSD (2009)
3. Provencher, Stephen W. "Estimation of metabolite concentrations from localized in vivo proton NMR spectra." Magnetic resonance in medicine 30.6 (1993): 672-679.
4. Daubechies, I., Ten lectures on wavelets. 1992: SIAM.
Figures