4956
GlucoCEST weighted MRI detects metabolic abnormalities following experimental TBI on 7T and 9.4TTsang-Wei Tu1,2, Jaclyn Witko2, and Joseph Frank2
1Howard University, Washington, DC, United States, 2National Institutes of Health, Bethesda, MD, United States
Synopsis
Delayed glucose hypometabolism has been reported in traumatic brain injury (TBI) patients from weeks to years posing a high risk for neurodegenerative diseases. This study shows the feasibility of glucoCEST weighted MRI (GWI) to detect metabolic abnormalities following TBI on 7T and 9.4T. The GWI results were compared to 2DG autoradiography and immunohistochemitry indicating that the injured brain needed immediate energy to restore nervous function and then entered a hypometabolism state in week 2. GWI affords the sensitivity to detect cerebral metabolic states following TBI and has potential to identify the treatment window to increase neuronal survival.
Introduction
Delay in glucose hypometabolism has been reported in traumatic brain injury (TBI) patients from weeks to years posing a high risk for neurodegenerative diseases.1 Recently, the MRI based molecular imaging, known as glucose chemical exchange saturation transfer (glucoCEST) has been introduced for detecting glucose without radioisotopes.2 The CEST contrast is related to the proton exchange rate, number of exchangeable protons, pH, T1, T2, saturation amplitude and efficiency, with many of these factors being closely related to the magnetic field strength of the scanner. This study compared the glucoCEST weighted images (GWI) acquired on 7T and 9.4T for the changes related to glucose metabolism in experimental TBI.Materials and Methods
TBI was induced on female 10-week-old rats by a 2m/450g weight drop model. Rats were imaged at baseline, day 1, week 1, 2, 3, 4 post injury on Bruker 7T and 9.4T (n=6, each time point). Diffusion tensor imaging (DTI) was first performed; fractional anisotropy (FA) were derived for diffuse axonal injury (DAI). CEST data were acquired from -4 to +4ppm, 0.25ppm stepping by fast spin echo for 7T (TR/TE 2.5s/10.4ms; 200µm2; MT pulse 2μT, 2s) and 9.4T (TR/TE 2.1s/10.4ms; 200µm2; MT pulse 1.5μT, 1s).1 WASSR correction3 was applied for B0/B1 correction. GWI were derived by integrating the asymmetry of magnetization transfer ratio (MTRasym) at 1.2, 2.1 and 2.9ppm.1 3 rats at each time point were randomly picked for axon (SMI31), neuron (NeuN), glucose transporters (Glut3/Glut1) and apoptosis (TUNEL) stainings and 2DG autoradiography. Data from cortex (CT) were analyzed by one-way ANOVA.Results
After TBI, FA exhibited 12–18% decrease at corpus callosum in day 1 on both 7T and 9.4T indicative of DAI (see Figures). Compared to the baseline GWI, an immediate increase of MTRasym was seen on day 1 by both 7T and 9.4T (+10%, p=NS). Significant decreases of MTRasym were detected by 7T (-49%, p<0.01) and 9.4T (-32%, p<0.01) from week 2 to week 3, and a gradual returned toward the baseline level was seen on 7T (-36%, p<0.05) and 9.4T (-20%, p=NS) by week 4. 2DG substantiated the trends demonstrating an immediately increase of glucose uptake at day 1 and reached the lowest at week 2 (-19% of the baseline level, p<0.05) and then normalized at week 4 (p=NS). Glut3 and Glut1 stainings showed 1 to 3 folds increase (p<0.01) on day 1 then normalzed after week 2.Discussion
This study shows the feasibility of GWI to detect the hypometabolism in TBI on 7T and 9.4T by adapting a low-to-moderate saturation power (1.5-2μT) with short duration length (1-2s). The advantage of higher fields (>7T) CEST allows prolonged storage of saturation, improved the saturation efficiency and the frequency separation.2-4 At 9.4T, GWI required a critical power range to prevent large direct saturation competing with hydroxyl proton exchanges of glucose.4 The GWI results parallel with 2DG and IHC indicating that the injured brain needed immediate energy to restore the nervous function right after injury and entered a hypometabolism state in week 2. GWI affords the sensitivity to identify the window for treatments to increase neuronal survival in TBI.Acknowledgements
No acknowledgement found.References
1. Bergsneider et al., J Neurotrauma, 2000, 17: 389-401. 2. Chan et al., MRM, 2012, 68:1764-73. 3. Kim et al. MRM, 2009 61:1441-1450. 4. van Zijl and Yadav, MRM, 2011 65:927-48.Figures
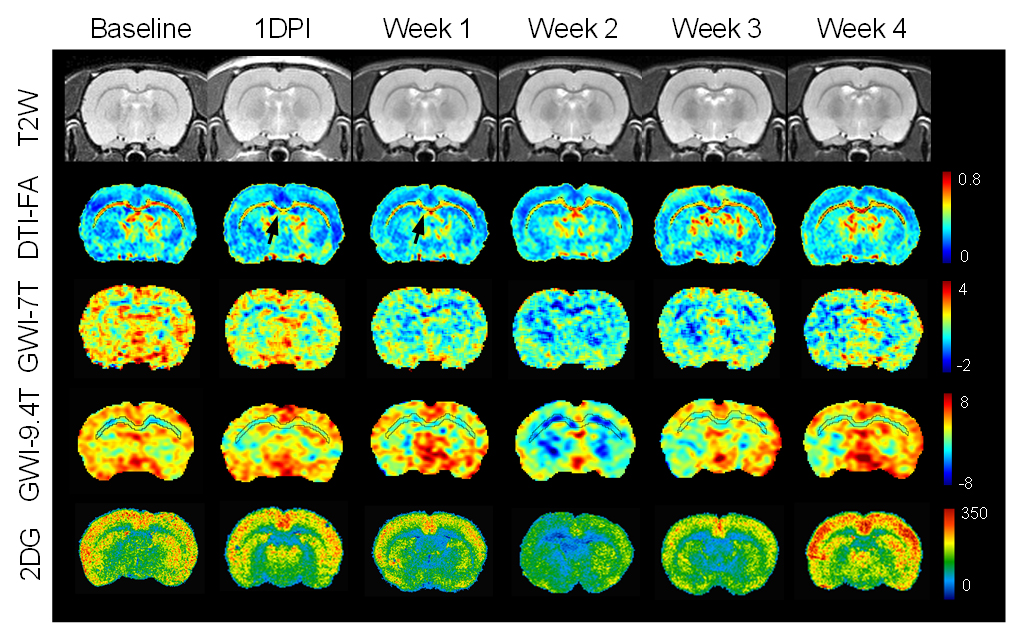
Fig.1 Following TBI, the
longitudinal T2W images were not differences over time, while DTI-FA was
sensitive to show injury in corpus callosum (CC, arrows) on both 7T and 9.4T
indicative of DAI. Significant increase of FA was seen in week 2 and 3 in
cortex (CT). GWI observed significant decreases of MTRasym from week 2 to week
3, both by 7T and 9.4T, while the 2DG autoradiographs also displayed the similar
changes on glucose uptake.
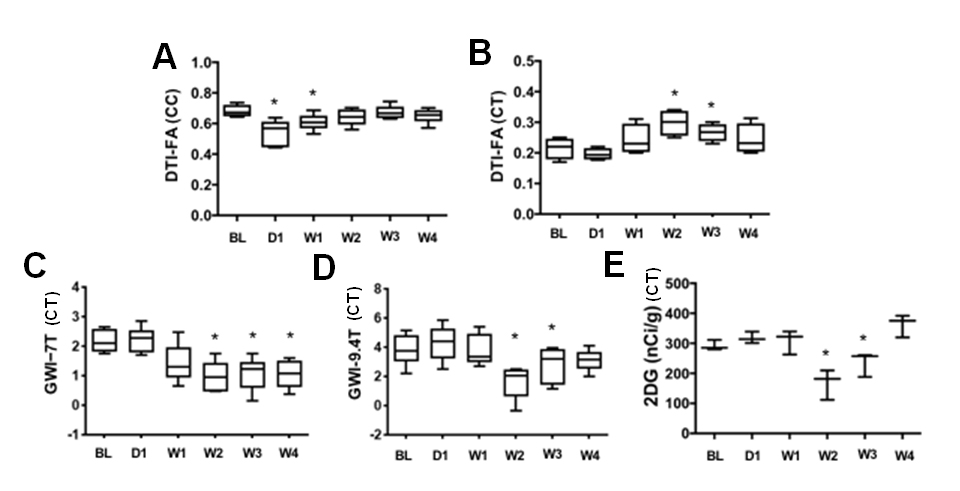
Fig.2 The corresponding
quantifications in Fig. 1 (n=6).
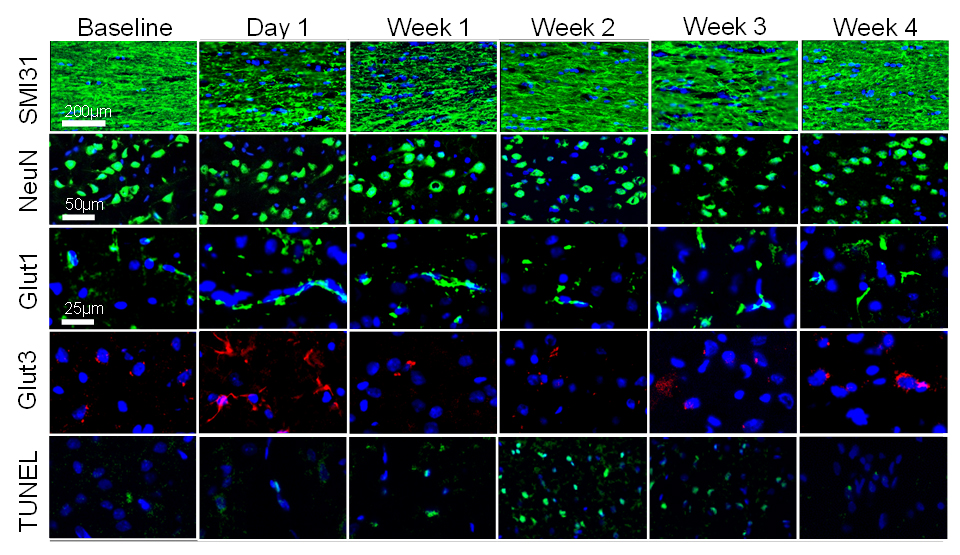
Fig.3
Histology showed significant loss of SMI31 in day 1 and week 1 associated with
axonal beadings. In week 4, SMI31 recovered close to the baseline condition.
NeuN only shows a decreased trend. Glut1 and Glut3 significantly increased in
day 1 and normalized to the baseline level in week 4, suggesting the immediate
upregulation of endothelial and neuronal glucose transporters. Apoptotic cell
death significantly rose in week 2 and 3, correlating to the decreased of
glucose utilization observed in GWI and 2DG data.