4954
Low-frequency Fluctuations of Resting-state fMRI BOLD Signal after Experimental Mild Traumatic Brain Injury1Research Center of Translational Image, Teipei Medical University, Taipei, Taiwan, 2Department of Radiology, School of Medicine, College of Medicine, Taipei Medical University, Taipei, Taiwan, 3Department of Anatomy and Cell Biology, School of Medicine, College of Medicine, Taipei Medical University, Taipei, Taiwan, 4Department of Biomedical Imaging and Radiological Science, China Medical University, Taichung, Taiwan
Synopsis
Introduction
As negative neuroimage finding from conventional CT and MRI can be expected in the acute phase of mild traumatic brain injury (mTBI) due to the subtle and undetectable axonal damage, more studies focused on probing the brain functional change after mTBI by using functional MRI.1, 2 We have demonstrated that change of brain connectivity in the primary somatosensory cortex and DMN in the acute phase after experimental mTBI with the preserved brain structure in rats.3 We, thus, hypothesized that the regional spontaneous fluctuation in BOLD signal was affected by the impact of mTBI as well. Amplitude of low-frequency fluctuation (ALFF) reflecting information about the spectral content of spontaneous fluctuations in each voxel represents the property of rsfMRI signal, especially from the perspective of the amplitude.4 While ALFF is an effective method to detect abnormalities in different neuropsychological disease such as major depressive disorder5, schizophrenia6, brain tumor7, and etc., no ALFF studies after mTBI has been proposed to date. In this study, we demonstrated for the first time that the amplitude of spontaneous fluctuation in BOLD signal was altered along with the mTBI progression.Methods
Male Sprague–Dawley rats (weighing 250–400 g) were anesthetized with Chloral Hydrate and placed in a stereotactic frame for modified impact acceleration injury (IAI). In brief, a weight of 600 g was dropped from a height of 1 m through a stainless-steel tube on the secured impact aiming at the metal helmet cemented on the skull. Animals were injured by single impact at the skull of the forelimb region of primary sensory cortex (S1FL) (n=10) and at the central portion of the skull (n=10), respectively. Longitudinal MRI was performed pre, at 24 h, and 50 after IAI. MRI in rats was performed on a Bruker 7 T PharmaScan with a volume coil as the transmitter and a rat surface coil as the receiver. After the bolus injection of dexmedetomidine (0.015 mg/kg), continuous infusion of dexmedetomidine (0.03 mg/kg/h) was performed with low-dose isoflurane (0.25%) during the whole MR protocol.8 rsfMRI was performed after 90 min over infusion and acquired using the single-shot echo-planar imaging (EPI) as described in the previous study.3 T2-weighted images with the same geometry were also acquired. Image pre-processing and group ICA maps calculated from rsfMRI data were proposed in the previous studies.3 The power spectra of rsfMRI signals were acquired using the integral of the Welch power spectral density (PSD)9 and estimated in the major independent components (ICs) identified from group ICA. The ALFF was then computed by the integration of amplitudes in 0.01–0.3 Hz.10 Statistical analysis was performed using t-test with the significant level set at P<0.05.Results & Discussion
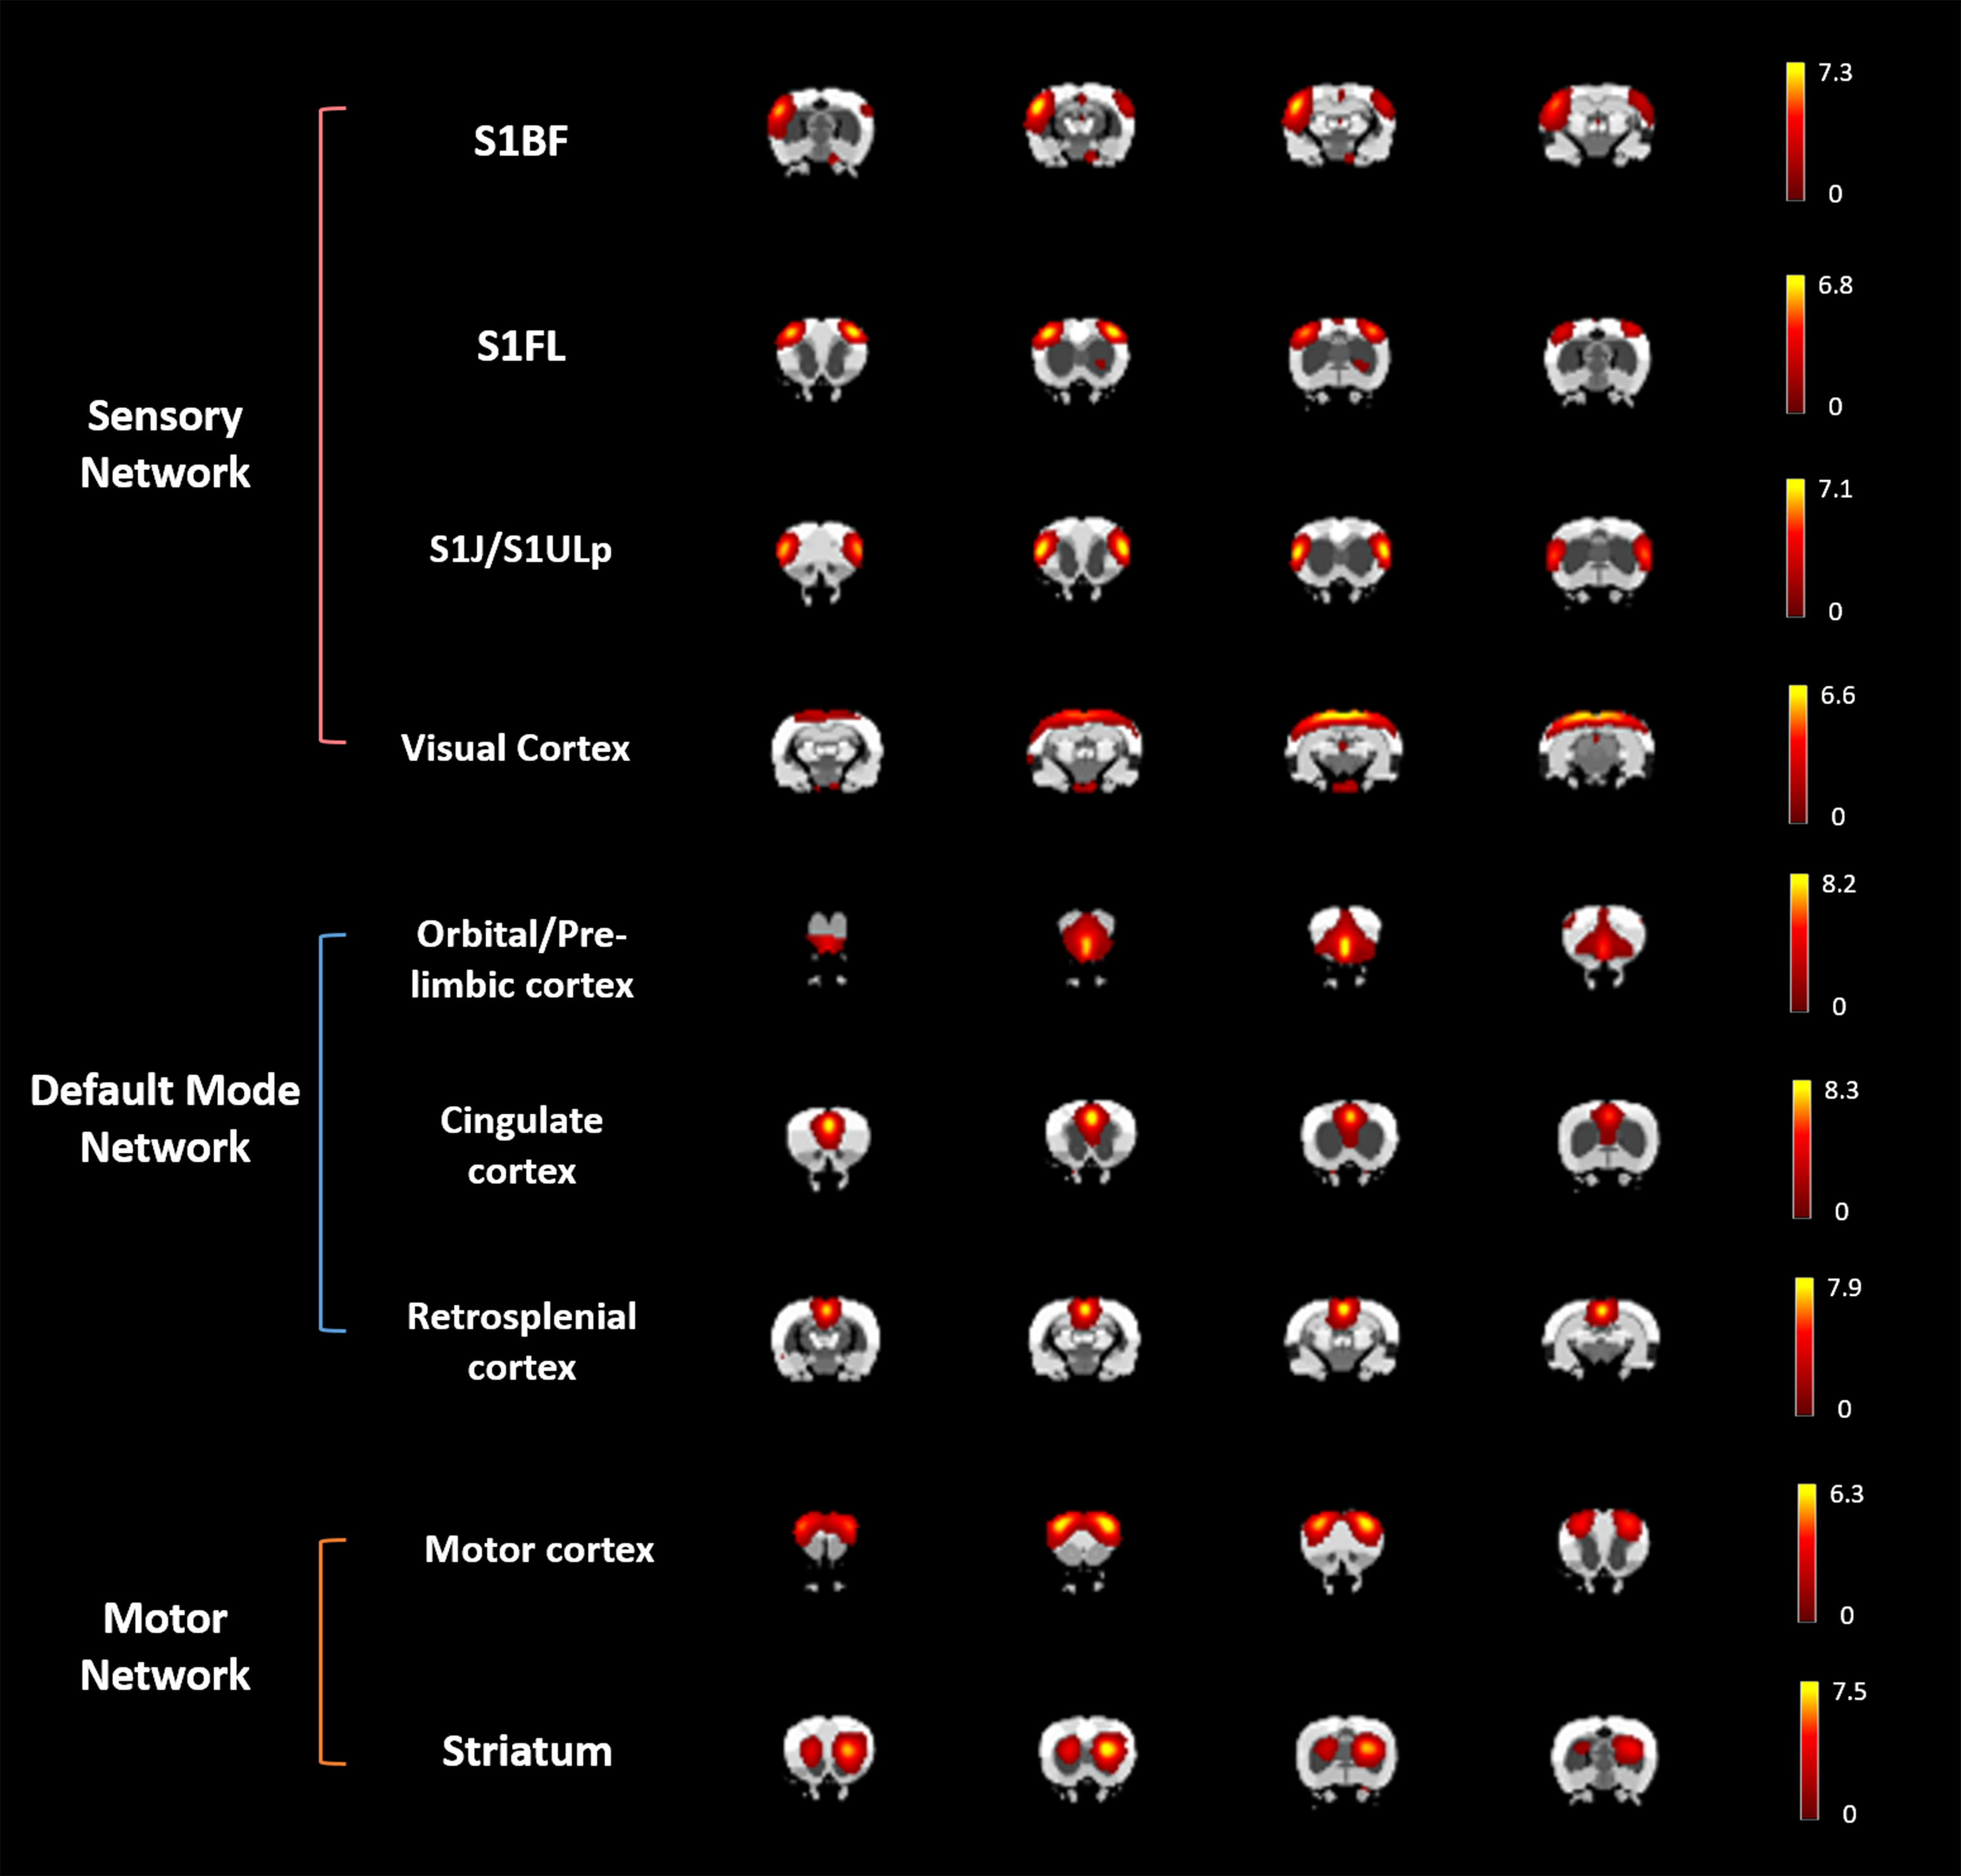
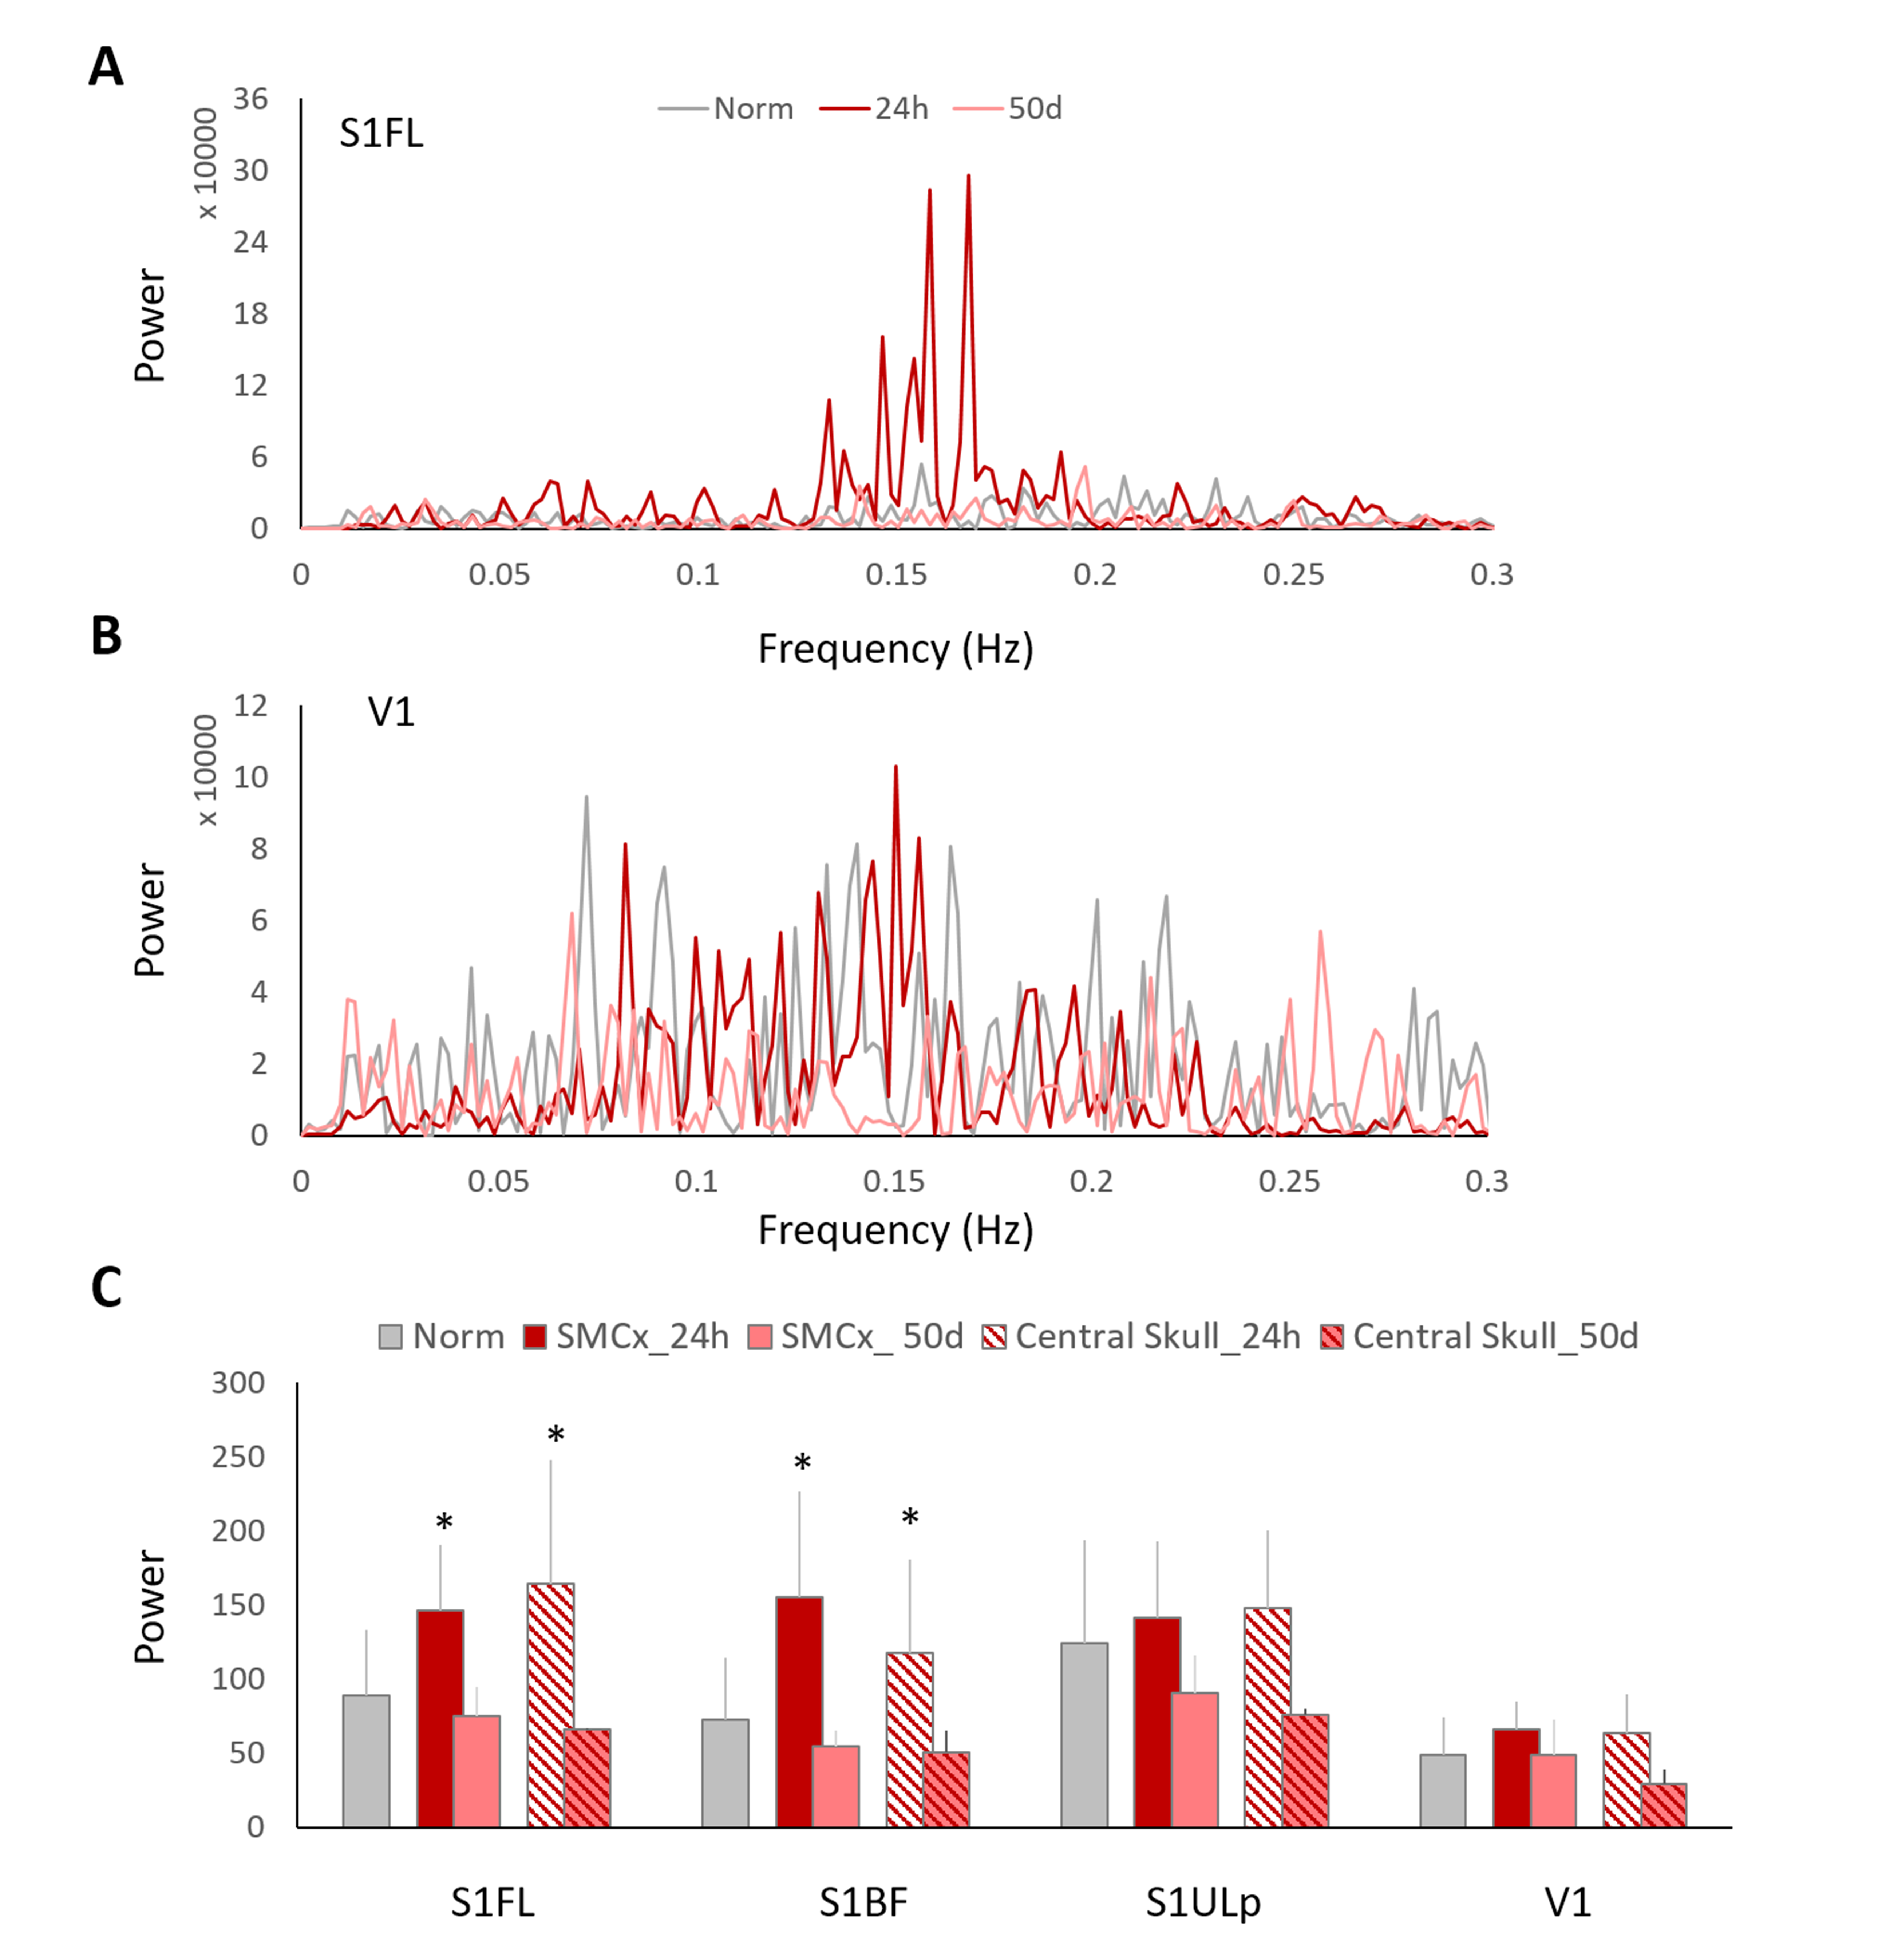
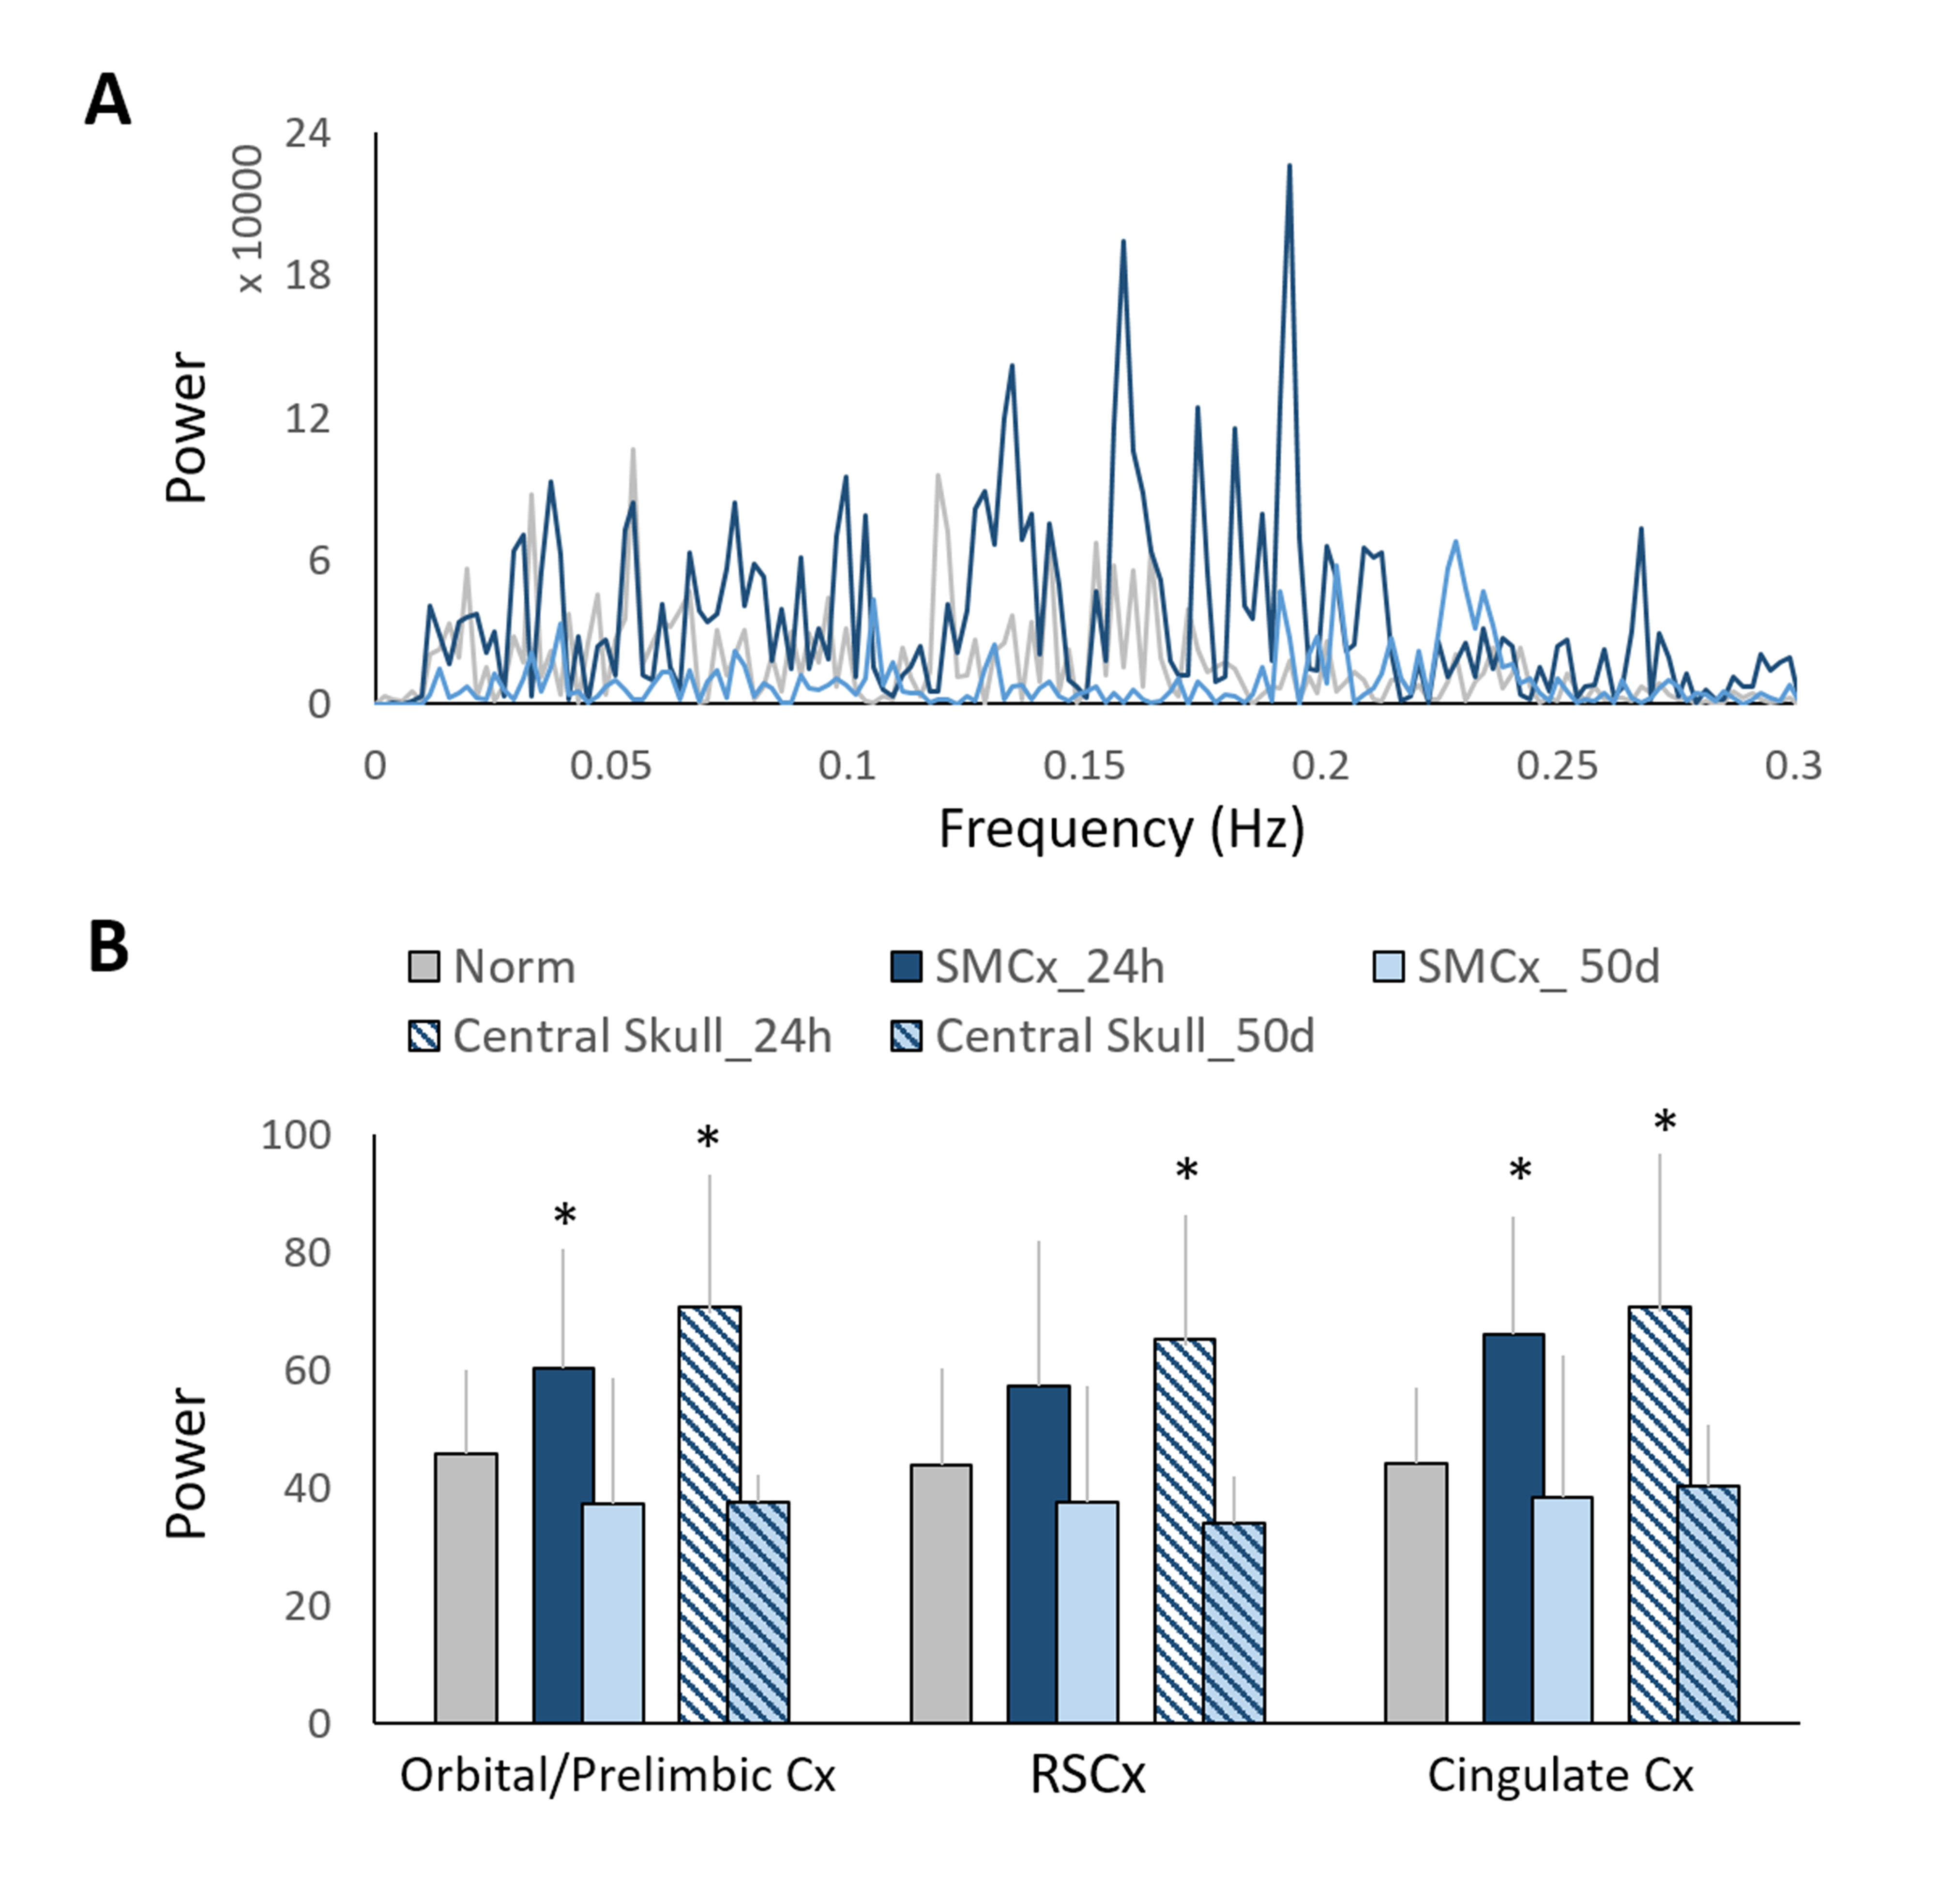
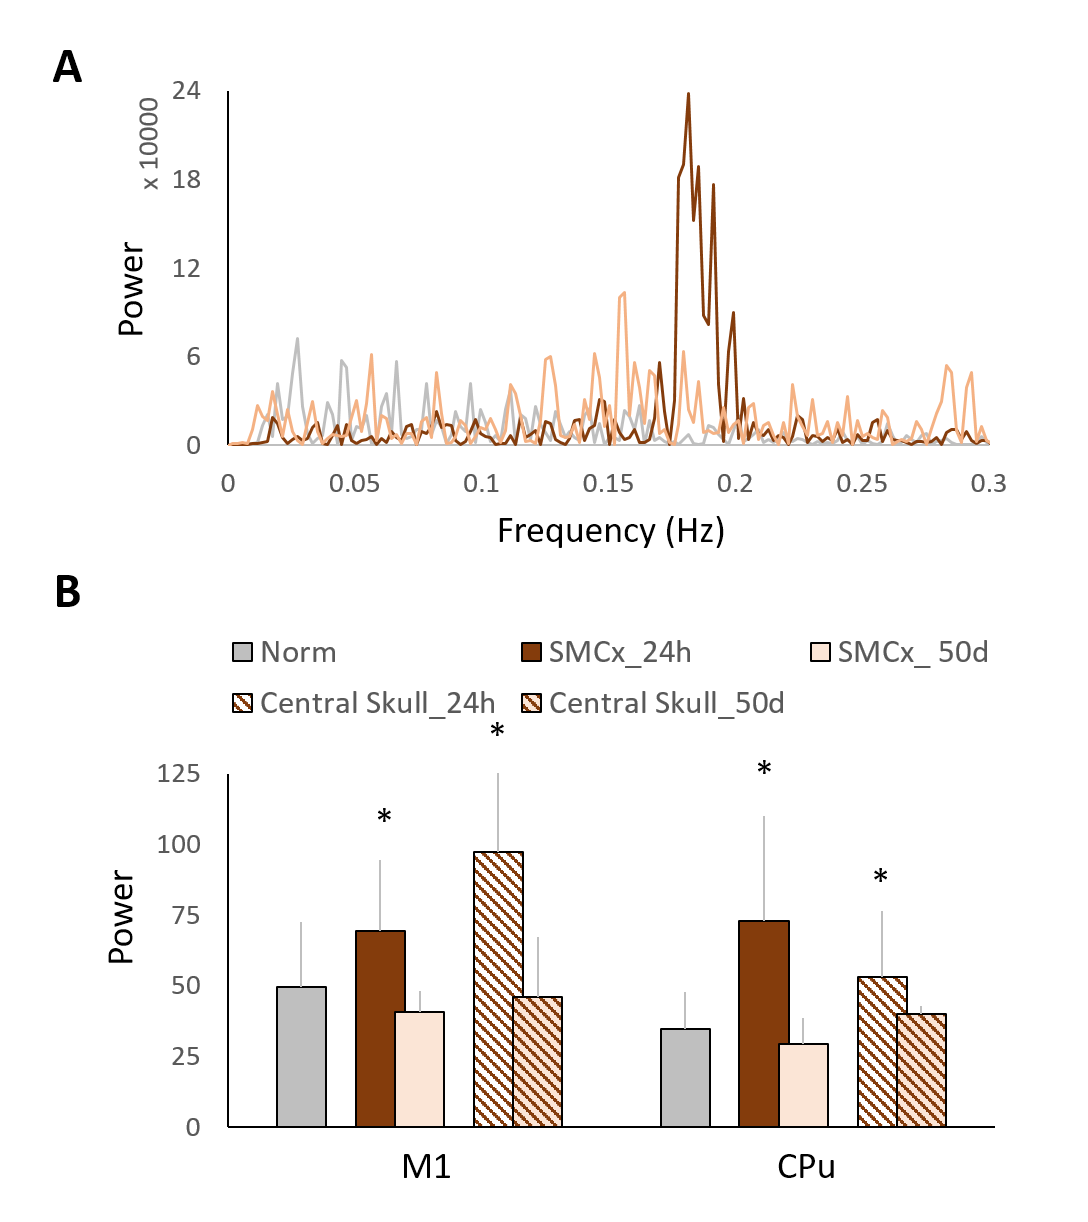
Major ICs of our interest including 1) the sensory network with the barrel field region (S1BF), the forelimb region (S1FL), the upper lip region (S1ULp) of the primary sensory cortex, and the visual cortex(V1), 2) the default mode network (DMN) in rats with the orbitofrontal and prelimbic cortex (Orbital/Prelimbic Cx), the cingulate cortex (Cingulate Cx), and the retrosplenial cortex (RSCx)8, and 3) the motor network with the motor cortex (M1) and the caudate putamen (CPu), were identified from the intact brains. In the S1FL, the power of PSD at 24 h after mTBI increased from the baseline with majority of the power concentrated in the frequency range around 0.015 Hz and recovered at 50 days (Figure 2A). Significant increase in PSD at 24 h after mTBI was observed in the S1FL and S1BF (P<0.05, Figure 2C), while no prominent changes in the S1ULp and V1 (Figure 2B and C) was shown regardless of the impact site. In the DMN, significant increase in PSD at 24 h after mTBI was observed in the Orbital/Prelimbic Cx and the cingulate Cx (P<0.05, Figure 3). The power in RSCx increased at 24 h when the central skull was impacted (P<0.05, Figure 3) likely due to the direct injury by the impact. Significant increase in PSD at 24 h after mTBI was observed in the M1 and CPu (P<0.05, Figure 4). Taken together, the increase of ALFF in the brain regions close to the impact site at acute phase after mTBI may be driven by the changes in the underlying neuronal activity and neurovascular response after injury.7, 11 No significant difference in the power at 50 days after mTBI was observed in all the brain regions, suggesting the recovery and the re-normalization of the neuronal activity in the chronic phase of mTBI. Our future studies will aim to explore the change of ALFF and the mTBI outcome correlates.Acknowledgements
This study was funded in part by Ministry of Science and Technology (104-2923-B-038 -003 -MY3, MOST 105-2628-B-038-002-MY2, MOST 106-2218-E-039-001-MY3,106-2314-B-038 -024 -MY2, and MOST 106-2314-B-038-079), Taipei, Taiwan.References
1. Chen C J, Wu C H, Liao Y P, et al., Working memory in patients with mild traumatic brain injury: functional MR imaging analysis. Radiology, 2012. 264(3): 844-51.
2. Mayer A R, Mannell M V, Ling J, et al., Functional connectivity in mild traumatic brain injury. Hum Brain Mapp, 2011. 32(11): 1825-35.
3. Kao Y C J L, C.F.; Chen, C.Y., Behavioral and Image Evidence for Mild Traumatic Brain Injury in Rats with the Skull Helmet ISMRM Preceeding, 2017.
4. Zang Y, Jiang T, Lu Y, et al., Regional homogeneity approach to fMRI data analysis. Neuroimage, 2004. 22(1): 394-400.
5. Liu F, Guo W, Liu L, et al., Abnormal amplitude low-frequency oscillations in medication-naive, first-episode patients with major depressive disorder: a resting-state fMRI study. J Affect Disord, 2013. 146(3): 401-6.
6. Yu R, Chien Y L, Wang H L, et al., Frequency-specific alternations in the amplitude of low-frequency fluctuations in schizophrenia. Hum Brain Mapp, 2014. 35(2): 627-37.
7. Agarwal S, Lu H, and Pillai J J, Value of Frequency Domain Resting-State Functional Magnetic Resonance Imaging Metrics Amplitude of Low-Frequency Fluctuation and Fractional Amplitude of Low-Frequency Fluctuation in the Assessment of Brain Tumor-Induced Neurovascular Uncoupling. Brain Connect, 2017. 7(6): 382-389.
8. Lu H, Zou Q, Gu H, et al., Rat brains also have a default mode network. Proc Natl Acad Sci U S A, 2012. 109(10): 3979-84.
9. Zhang J, Zhou J, Lu F, et al., Investigation of the Changes in the Power Distribution in Resting-State Brain Networks Associated with Pure Conduct Disorder. Sci Rep, 2017. 7(1): 5528.
10. Grandjean J, Schroeter A, Batata I, et al., Optimization of anesthesia protocol for resting-state fMRI in mice based on differential effects of anesthetics on functional connectivity patterns. Neuroimage, 2014. 102 Pt 2: 838-47.
11. Wu T L, Mishra A, Wang F, et al., Effects of isoflurane anesthesia on resting-state fMRI signals and functional connectivity within primary somatosensory cortex of monkeys. Brain Behav, 2016. 6(12): e00591.
Figures