4953
Alteration of Resting-state Functional Networks is Associated with Post Concussion Symptoms in Mild Traumatic Brain Injury1Research Center of Translational Imaging, College of Medicine, Taipei Medical University, Taipei, Taiwan, 2Department of Anatomy and Cell Biology, School of Medicine, College of Medicine, Taipei Medical University, Taipei, Taiwan, 3Department of Biomedical Imaging and Radiological Sciences, National Yang-Ming University, Taipei, Taiwan, 4Department of Radiology, School of Medicine, College of Medicine, Taipei Medical University, Taipei, Taiwan, 5Department of Medical Imaging, Taipei Medical University Hospital, Taipei, Taiwan, 6Department of Medical Research, Taipei Medical University Hospital, Taipei, Taiwan
Synopsis
A subgroup of patients with mild traumatic brain injury (mTBI) suffer from a series of post-concussion symptoms, such as headache, dizziness, and cognitive deficits. These patients also present altered neural connectivity compared to healthy controls (HC). In our study, we examined resting-state functional connectivity in 30 mTBI patients and 35 HC using independent component analysis. We found that patients showed lower functional connectivity in several resting-state networks, and the left frontoparietal network was associated with the level of dizziness in patients. We concluded that the alterations of resting-state neural networks may support post-concussion symptoms after mTBI.
Introduction
Around 15 to 20% of mild traumatic brain injury (mTBI) patients suffer from long-lasting post-concussion symptoms, such as headache, fatigue, dizziness and cognitive deficits1,2. However, the neural correlates of these complex symptoms still remain unclear. In this study, we aim to investigate the association between post-concussion symptoms and functional connectivity networks in mTBI patients using resting-state fMRI.Methods
Participants: We included 35 healthy controls (HC) and 30 mTBI patients within 1 month of their injury. Patients with suspected intracranial hemorrhage were excluded. All participants signed informed consent forms approved by the institutional review board.
Psychological assessment: Before the acquisition of MRI data, participants performed self-report questionnaires, including Rivermead Post Concussion Symptoms Questionnaire(PCSQ) with three sub-domains3 (i.e., cognitive, emotion, and somatic), and Dizziness Handicap Inventory (DHI) with three sub-domains4 (i.e., functional, emotional, and physical). Participants’ cognitive functions were examined using Wechsler Adult Intelligence Scale (WAIS)-IV. The Working Memory index (WM) and Processing Speed index (PS) were calculated to represent the executive control abilities5.
MR acquisition: Images were acquired on a 3T MRI scanner (MAGNETOM Prisma, Siemens) using a 20-channel head coil. Structural 3D T1-weighted images were acquired using magnetization-prepared rapid acquisition with gradient echo (MPRAGE) sequence, with the following parameters: repetition time (TR)=2300ms, echo time (TE)=3.3ms, flip angle (FA)=8˚, 176 axial slices, field of view (FOV)=256×256×176mm3, voxel size=1x1x1mm3. During the resting-state functional images session, 190 echo-planar imaging (EPI) scans were acquired using the following parameters: TR=2000ms, TE=20ms, FA=90˚, 40 axial slices with slice thickness=3.5mm, FOV=210×210mm2, voxel size=3.0x3.0x3.5mm3. In this scan session, participants were presented with a central fixation and instructed to stay awake with their eyes open.
Preprocessing: Preprocessing was conducted with SPM12 software which was implemented within MATLAB R2013b (The MathWorks, Inc., Natick, Massachusets, USA). The first 10 functional scans were discarded. The 180 functional scans were corrected for slice-timing and head motion. The structural scan was coregistrated to the mean image of realigned functional scans. The functional scans were normalized into MNI space using the function “old normalize” in SPM12, and then spatially smoothed using 6-mm full-width at half maximum (FWHM) Gaussian kernel.
Independent component analysis (ICA): The group spatial ICA was performed for all 65 participants using the GIFT software version 3.0b (http://mialab.mrn.org/software/gift/). The functional data were decomposed into 24 independent components with the infomax algorithm6. Single subject time courses and spatial maps were back-reconstructed. Finally, the spatial maps of components for each subject were z-transformed into ICA z-maps.
Statistics: One-sample T tests in each ICA z-map were performed to create binary component masks followed by the two-sample T tests in each ICA z-map for group comparison. Finally, partial correlation analyses between behavioral measures related to post-concussion symptoms and averaged z-value of components that revealed significant group differences were performed for the mTBI group, controlling for age, sex, and duration between injury and scanning date.
Results
Behaviors: Demographics and psychological assessment results are presented in Table 1. Compared to the HC, the mTBI showed higher PCSQ and DHI in either total scores or sub-domain scores. However, the WM and PS revealed no group difference.
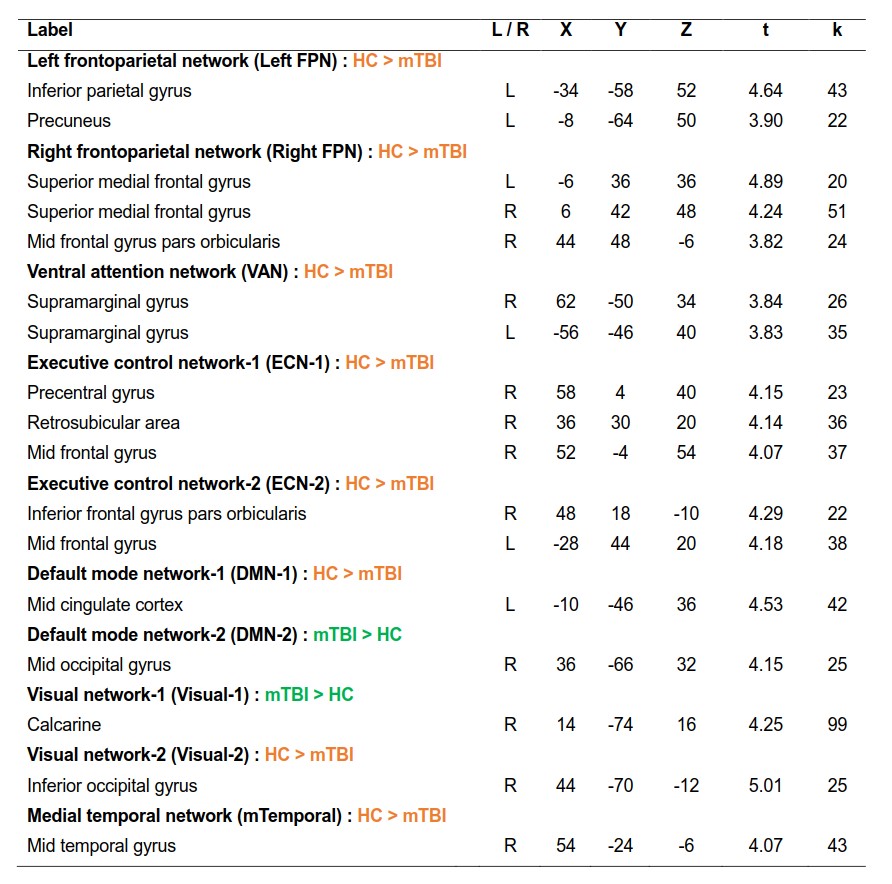
Group ICA: We found 10 independent components showing significant differences between mTBI and HC. The spatial patterns of these components were extracted from results of one-sample T tests and shown in Fig.1. The group differences in each component are depicted in Fig.2 and listed in Table 2. Compared to the HC, the mTBI showed lower functional connectivity in 8 components, but showed higher functional connectivity in only 2 components.
Behaviors-ICs relationships: In partial correlation analyses, the physical sub-domain of DHI is negatively correlated with averaged z-value of left FPN (partial r=-0.400, p=0.039). Furthermore, the PS is positively correlated with averaged z-values of VAN (partial r=0.401, p=0.038) and of ECN-1 (partial r=0.434, p=0.024).
Discussion
The altered functional connectivity in mTBI patients may correlate to post-concussion symptoms. For example, we found that patients reporting higher level of dizziness tended to show lower connectivity in the left FPN. Compared to the HC, the mTBI showed lower connectivity in the left inferior parietal regions within left FPN, which may link to visuospatial processing deficit7 and contribute to dizziness. On the other hand, the mTBI patients with preserved functional connectivity in VAN and ECN-1 showed less deficits in processing speed, though no significant group difference were found. A larger sample size is demanded to draw a stronger conclusion in the future study.Acknowledgements
Our work was supported by grants MOST104-2923-B-038-003-MY3 and MOST 106-2314-B-038-024-MY2 from the Ministry of Science and Technology of Taiwan.References
1. Marshall S, Bayley M, McCullagh S, et al. Clinical practice guidelines for mild traumatic brain injury and persistent symptoms. Canadian Family Physician. 2012;58(3):257-267.
2. Stålnacke M, Björnstig U, Karlsson K, et al. One-year follow-up of patients with mild traumatic brain injury: post-concussion symptoms, disabilities and life satisfaction at follow-up in relation to serum levels of S-100B and neuron-specific enolase in acute phase. J. Rehabil. Med. 2005;37(5):300-305.
3. Potter S, Leigh E, Wade D, et al. The Rivermead post concussion symptoms questionnaire. J Neurol. 2006;253(12):1603-1614.
4. Jacobson P, & Newman W. The development of the dizziness handicap inventory. Arch Otolaryngol. 1990;116(4):424-427.
5. Carlozzi E, Kirsch L, Kisala A, et al. An examination of the Wechsler Adult Intelligence Scales, (WAIS-IV) in individuals with complicated mild, moderate and Severe traumatic brain injury (TBI). The Clinical Neuropsychologist. 2015;29(1):21-37.
6. Bell J & Sejnowski J. An information maximisation approach to blind separation and blind deconvolution. Neural Comput. 1995;7(6):1129-1159.
7. Kravitz J, Saleem S, Baker I, et al. A new neural framework for visuospatial processing. Nat Rev Neurosci, 2011;12(4):217-230.
Figures
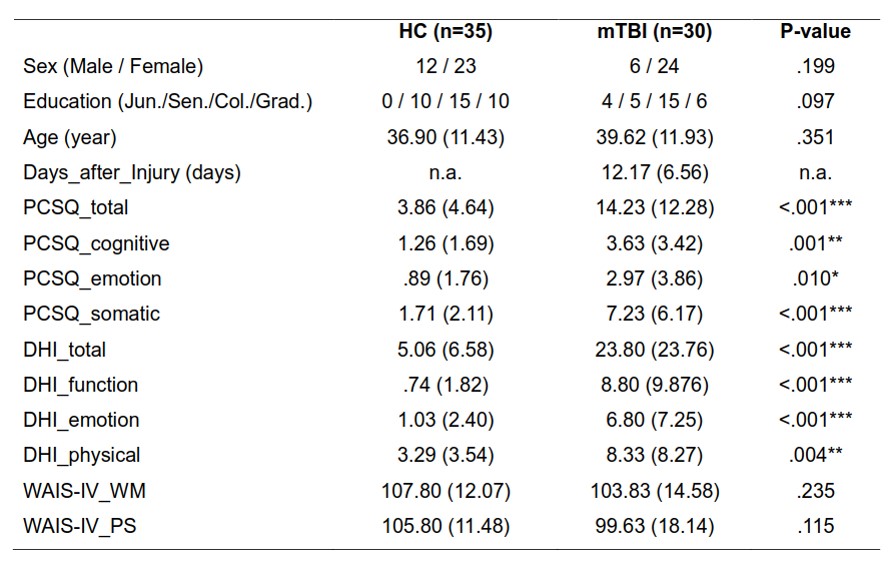
Table 1 Demographic and psychological assessment results. Data are presented as mean (SD). All measures were tested using two-sample T test, except for the categorical variables (i.e., sex, education), which were tested using Pearson chi-square test. *p<0.05; **p<0.01; ***p<0.001.
Col.= College and university; Days_after_injury= days between injury date and scanning date; DHI=Dizziness Handicap Inventory; Grad.= Graduate school; Jun.= Junior high school; PCSQ = Rivermead Post Concussion Symptoms Questionnaire; Sen.= Senior high school; WAIS-IV = Wechsler Adult Intelligence Scale-IV (WM=Working memory index; PS = Processing speed index).
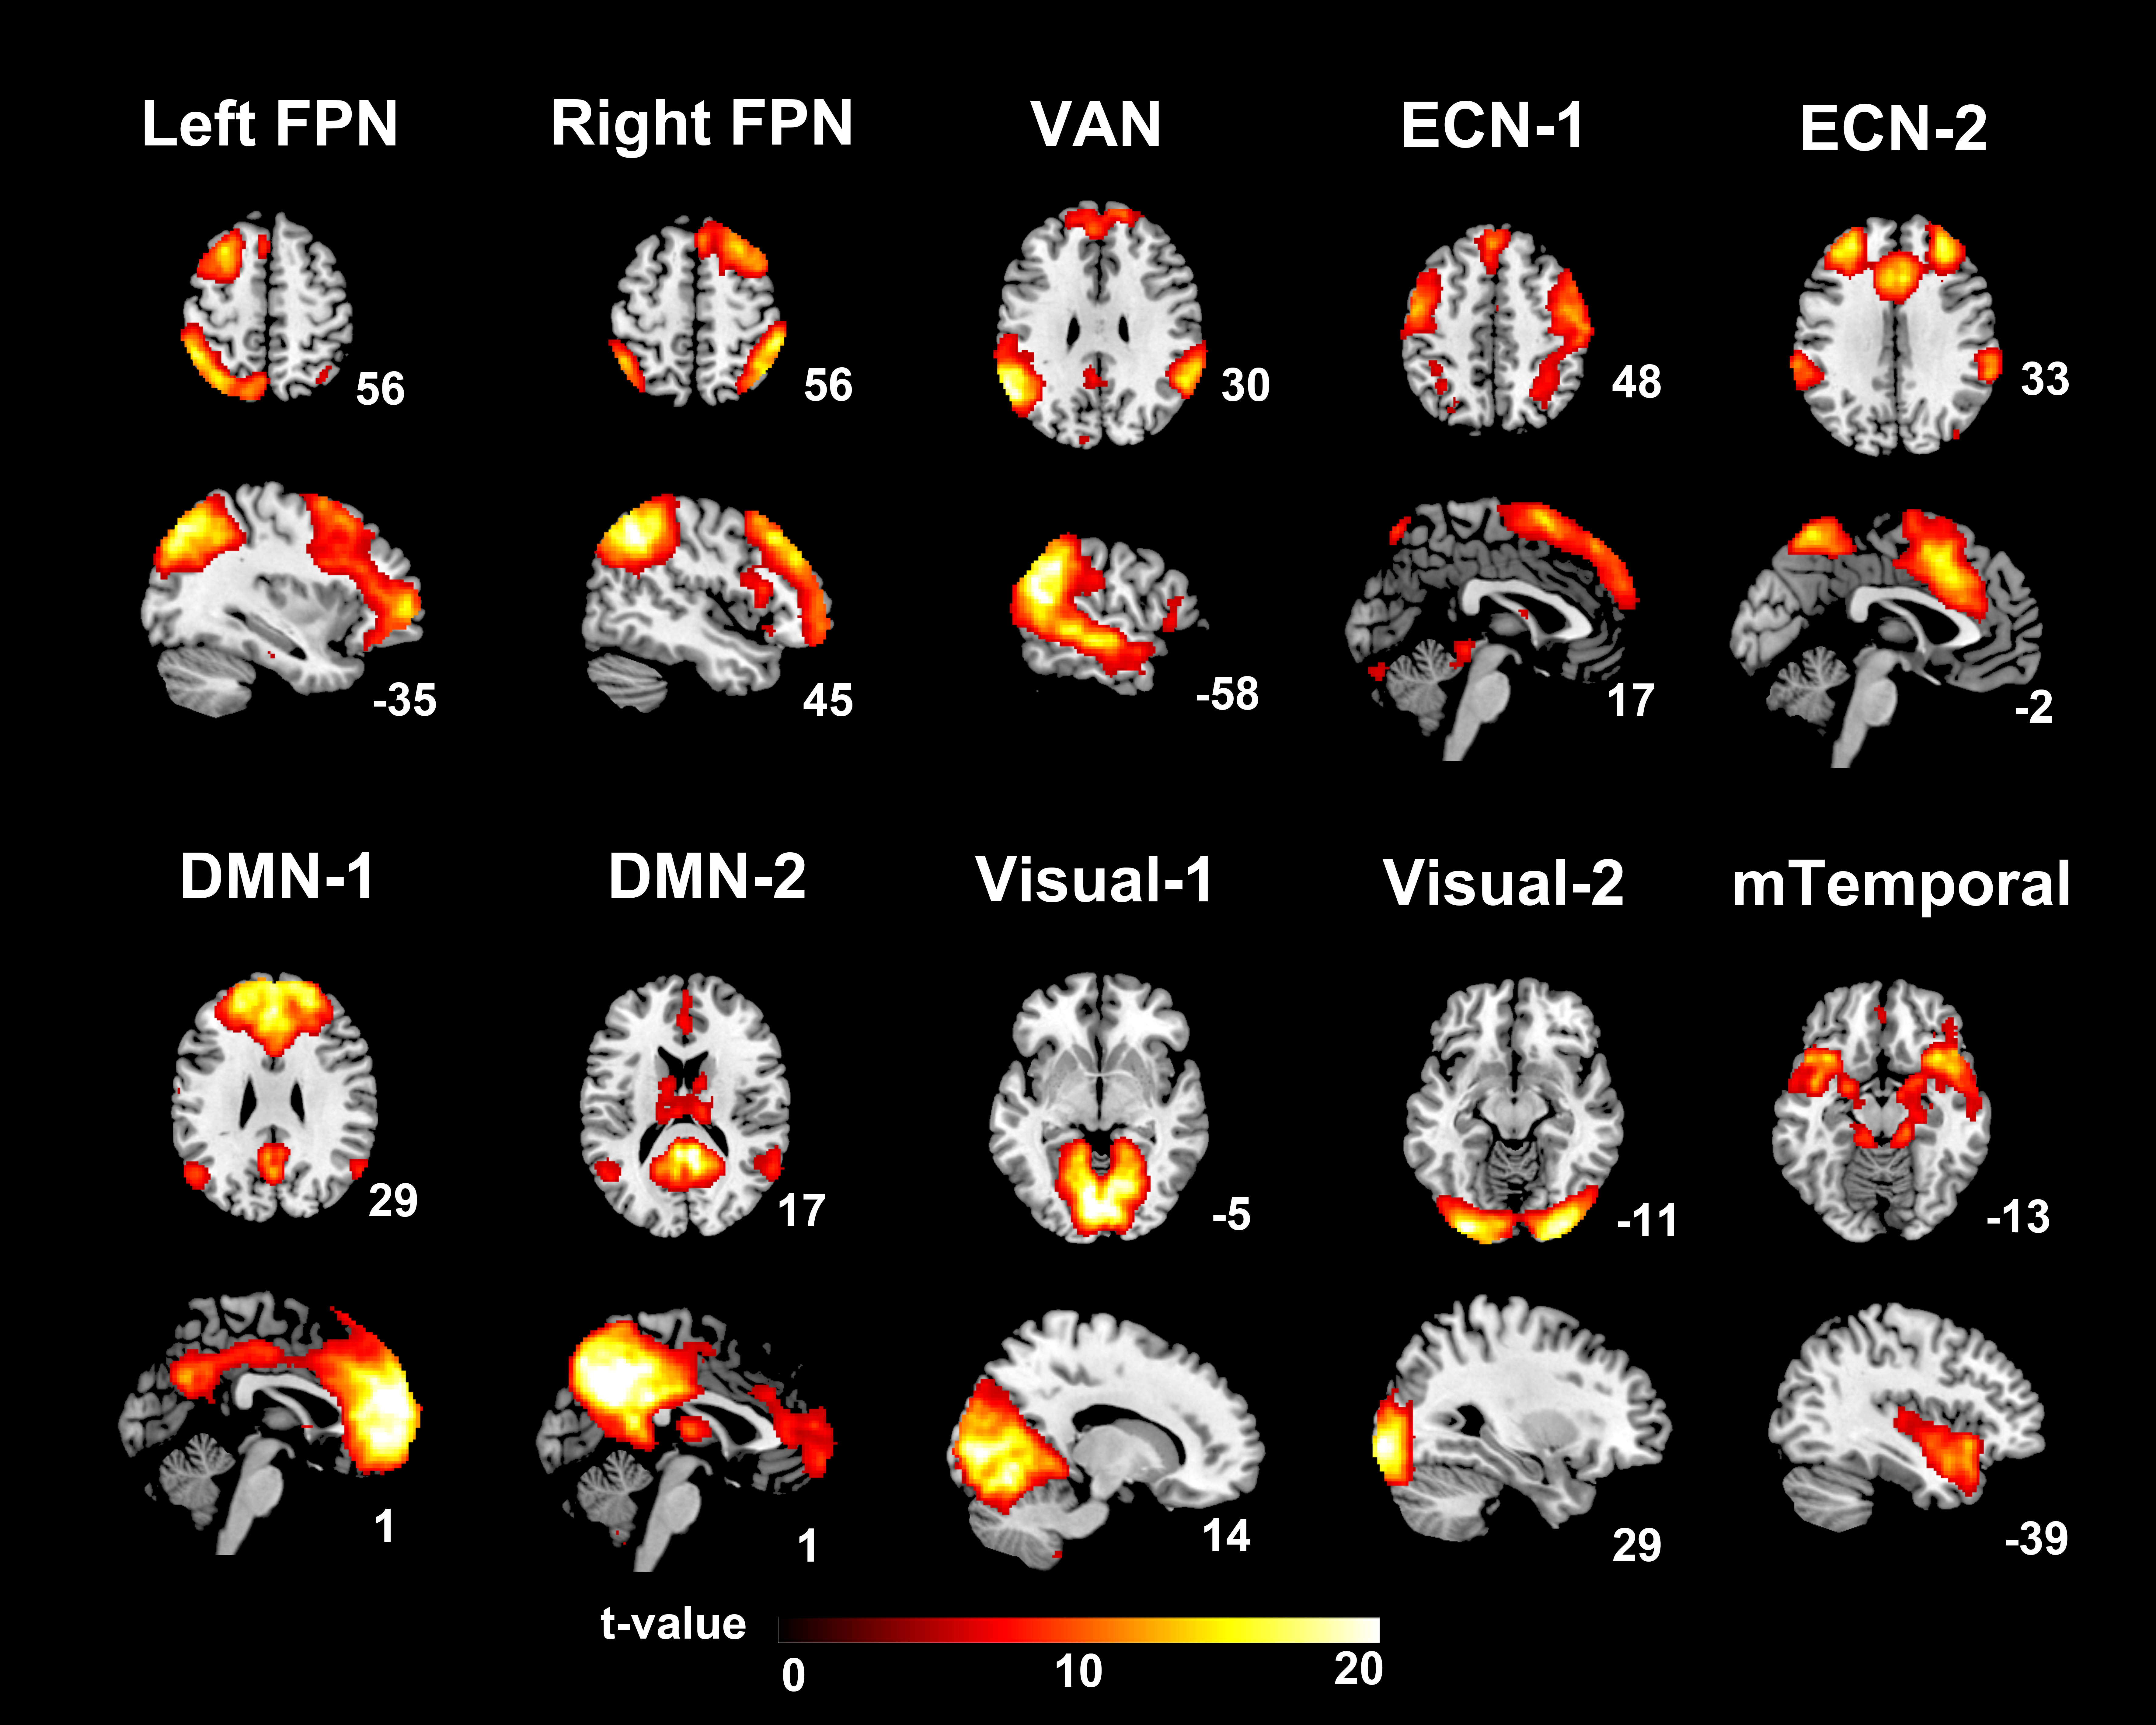
Figure 1 Spatial patterns of the 10 Independent components extracted using one-sample T tests (FWE corrected p < 0.05, T > 5.50, and cluster size k ≥ 20). Slices are labeled using MNI coordinate.
DMN-1 & -2 = Default mode network-1 & -2; ECN-1 & -2 = Executive control network-1 & -2; Left FPN = Left frontoparietal network; mTemporal = Medial temporal network; Right FPN = Right frontoparietal network; VAN = Ventral attention network; Visual-1 & -2 = Visual network-1 &-2.
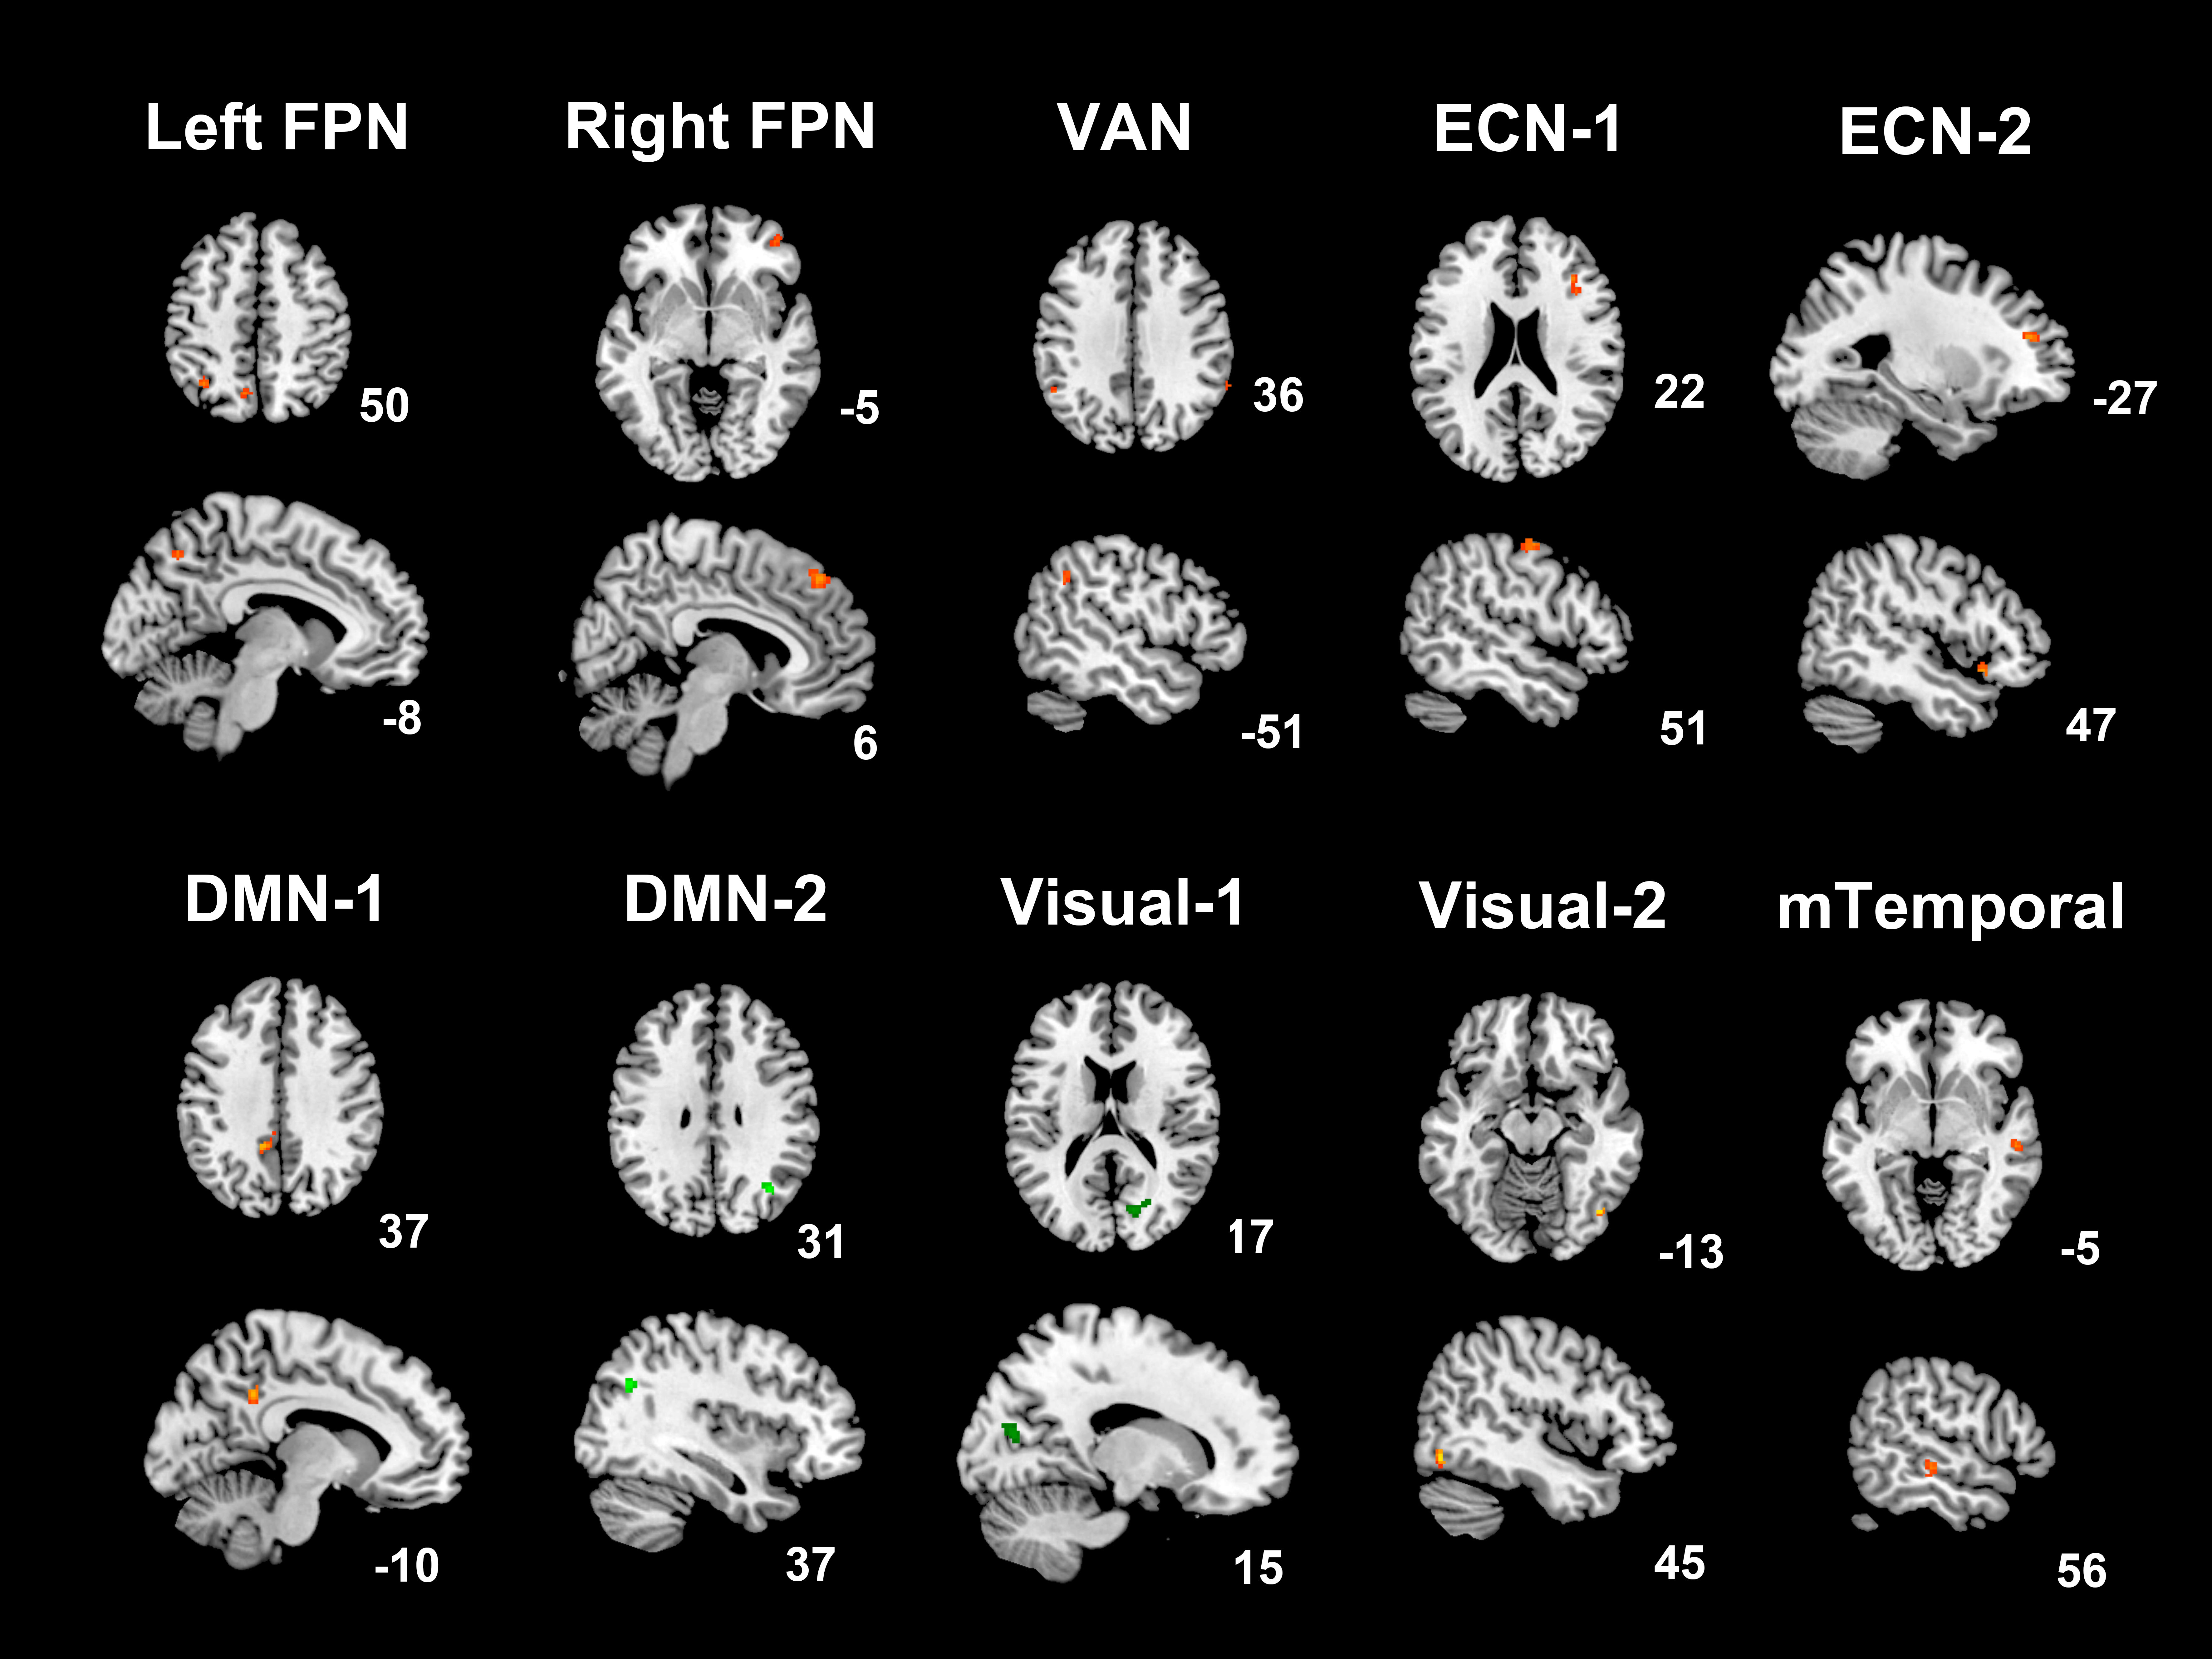
Figure 2 Group difference of the 10 independent components examined using two-sample T tests (p<0.001, T >3.22, cluster size k≥20, with the corresponding binary component mask). Slices are labeled using MNI coordinate. The orange clusters represent for HC > mTBI, while the green cluster represent for mTBI > HC.
DMN-1 & -2 = Default mode network-1 & -2; ECN-1 & -2 = Executive control network-1 & -2; Left FPN = Left frontoparietal network; mTemporal = Medial temporal network; Right FPN = Right frontoparietal network; VAN = Ventral attention network; Visual-1 &-2 = Visual network-1 &-2.